Volumatic Support Resistance Levels MT5 Scanner
- Indicators
-
Duc Hoan Nguyen
 ->| I am a dedicated developer and programmer specializing in MQL4, MQL5, and Pine Script for TradingView, with a strong track record of success in building high-performing, tailored solutions for MT4, MT5, and TradingView platforms. Over the years, I have worked extensively within the financial and
 - Version: 1.0
- Activations: 10
New tools will be $30 for the first week or the first 3 purchases!
Trading Tools Channel on MQL5: Join my MQL5 channel to update the latest news from me
Volumatic Support/Resistance Levels Scanner is a support‑and‑resistance indicator that adds volume context to price structure. By showing how trading activity clusters around recent pivots, it helps users see where buying or selling interest has been most active.
See more MT4 version at: Volumatic Support Resistance Levels MT4 Scanner
See more products at: All Products
1 · Overview
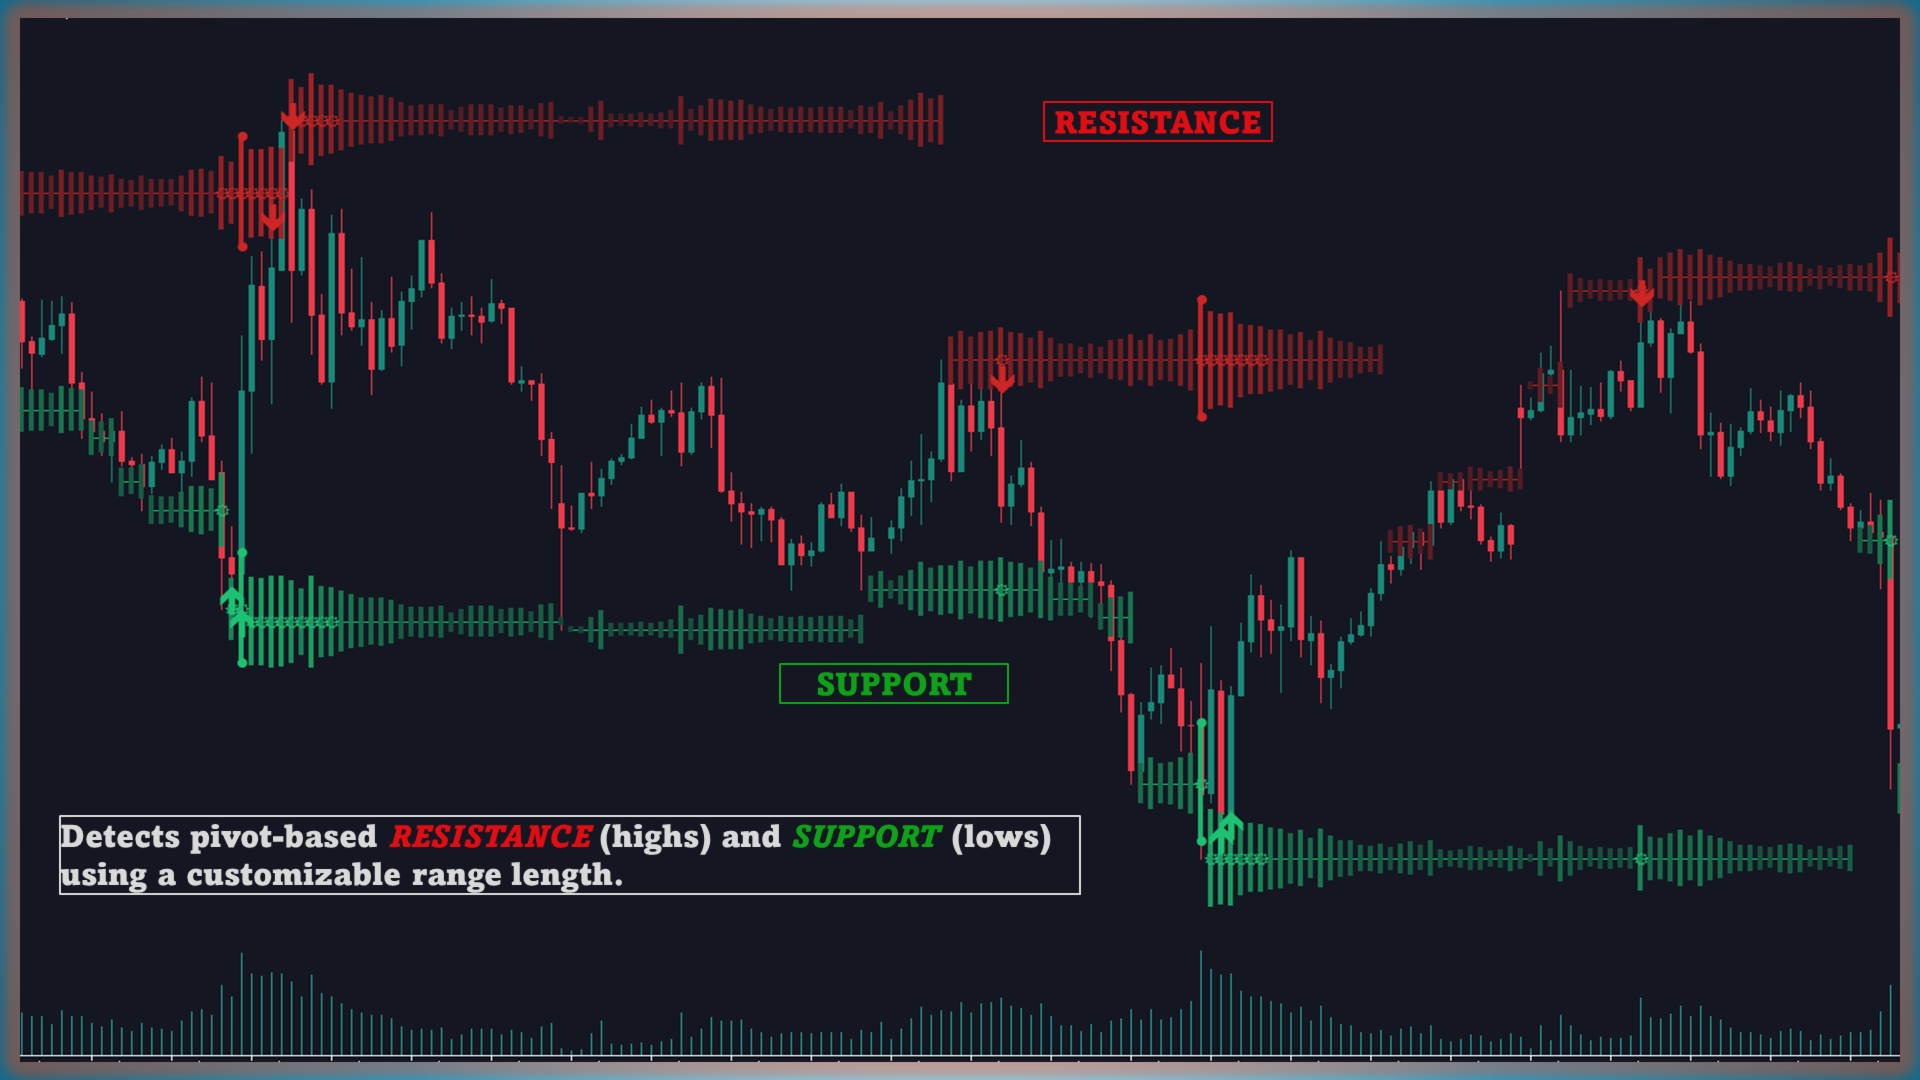
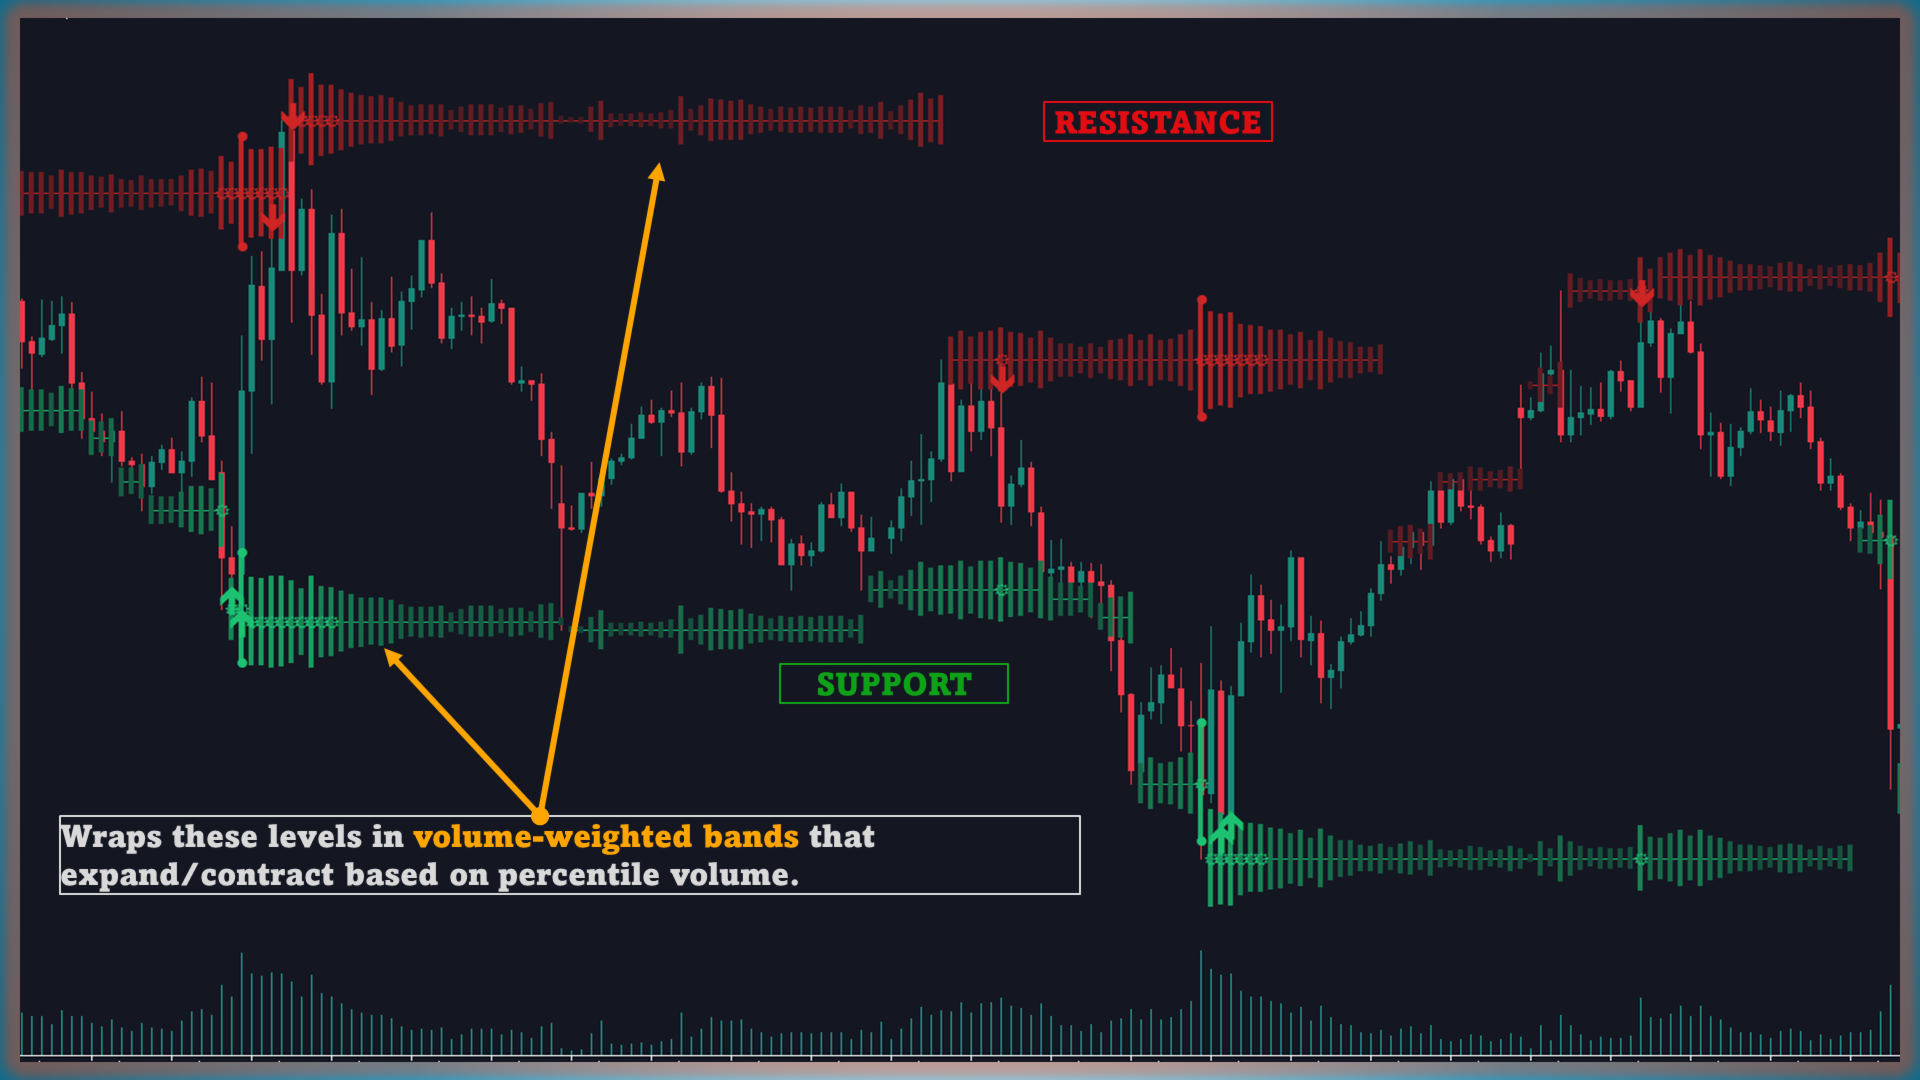
The indicator draws price zones from the most recent swing highs and lows, then overlays a volume histogram for each zone. Histogram thickness expands or contracts with current activity, allowing users to gauge how much attention the market is paying to a given level.
2 · Key concepts-
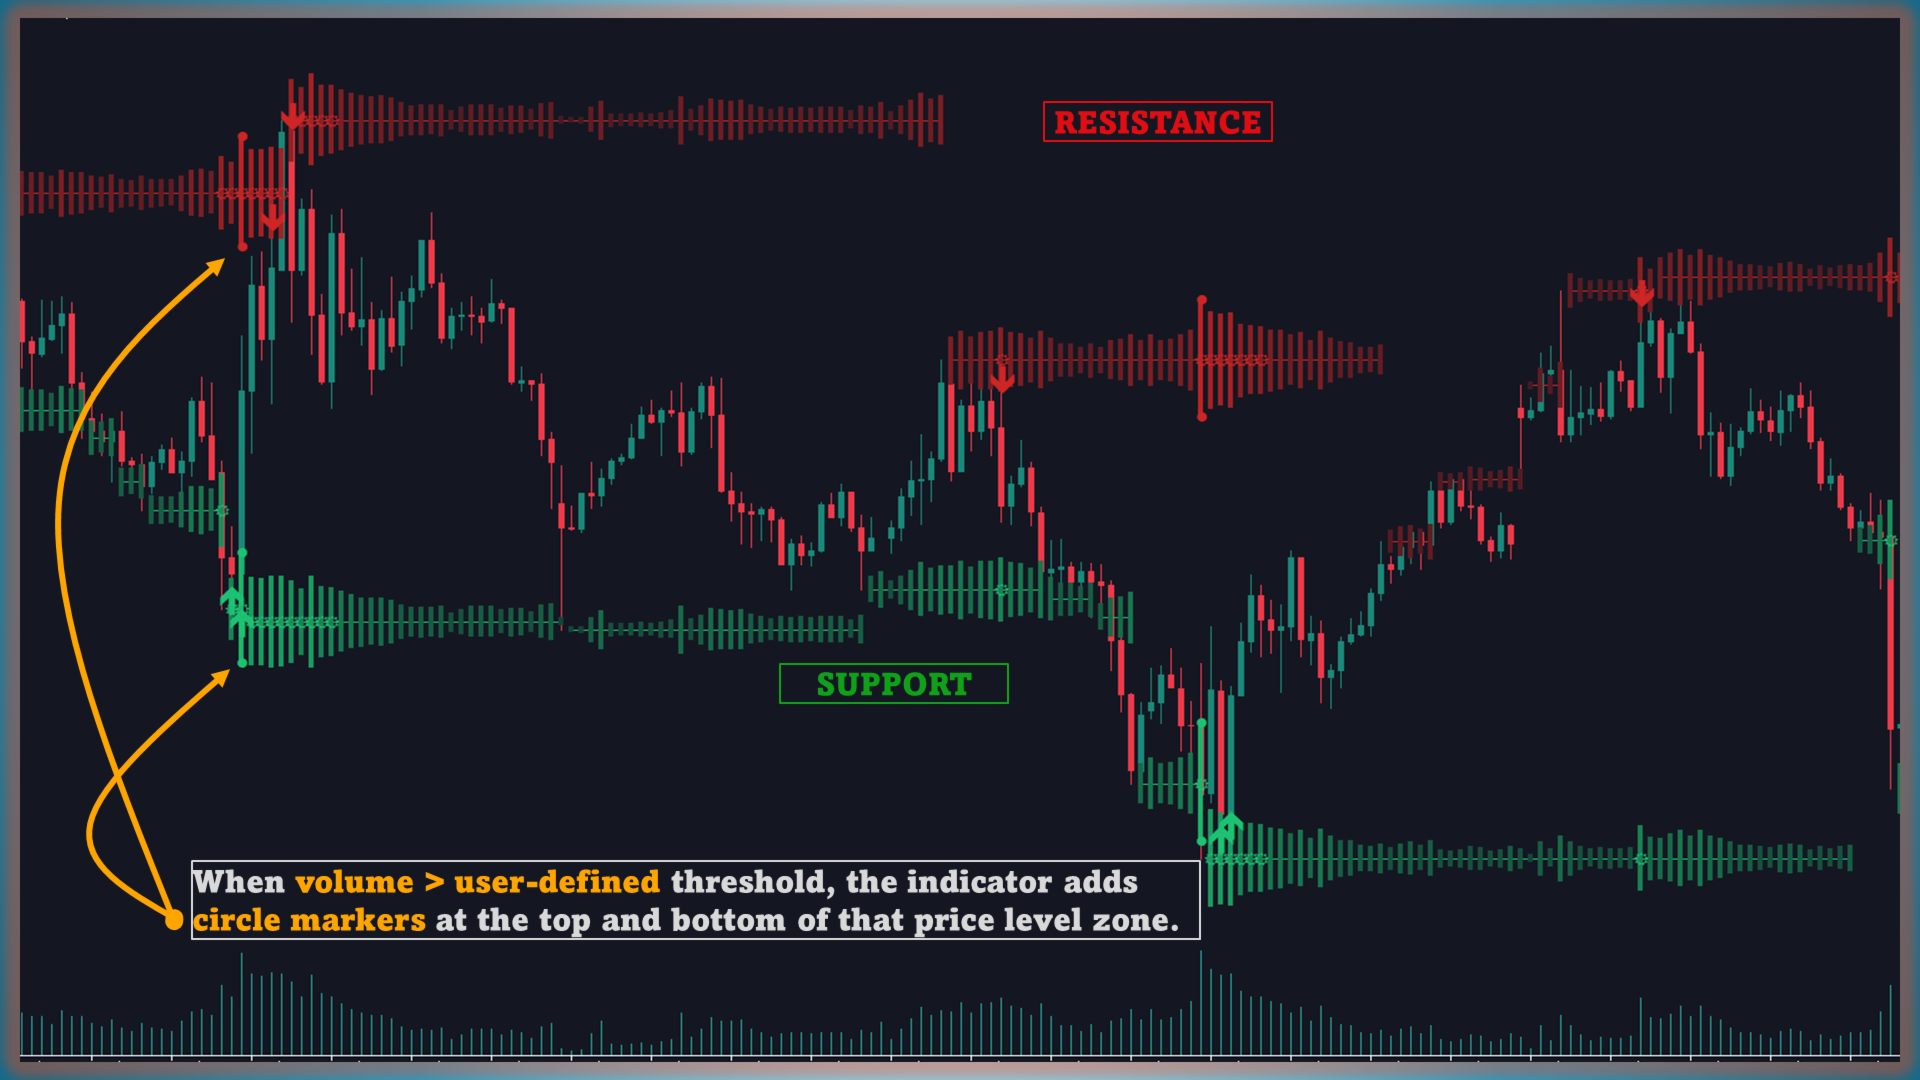
Price zones — horizontal bands plotted at recent price pivots.
-
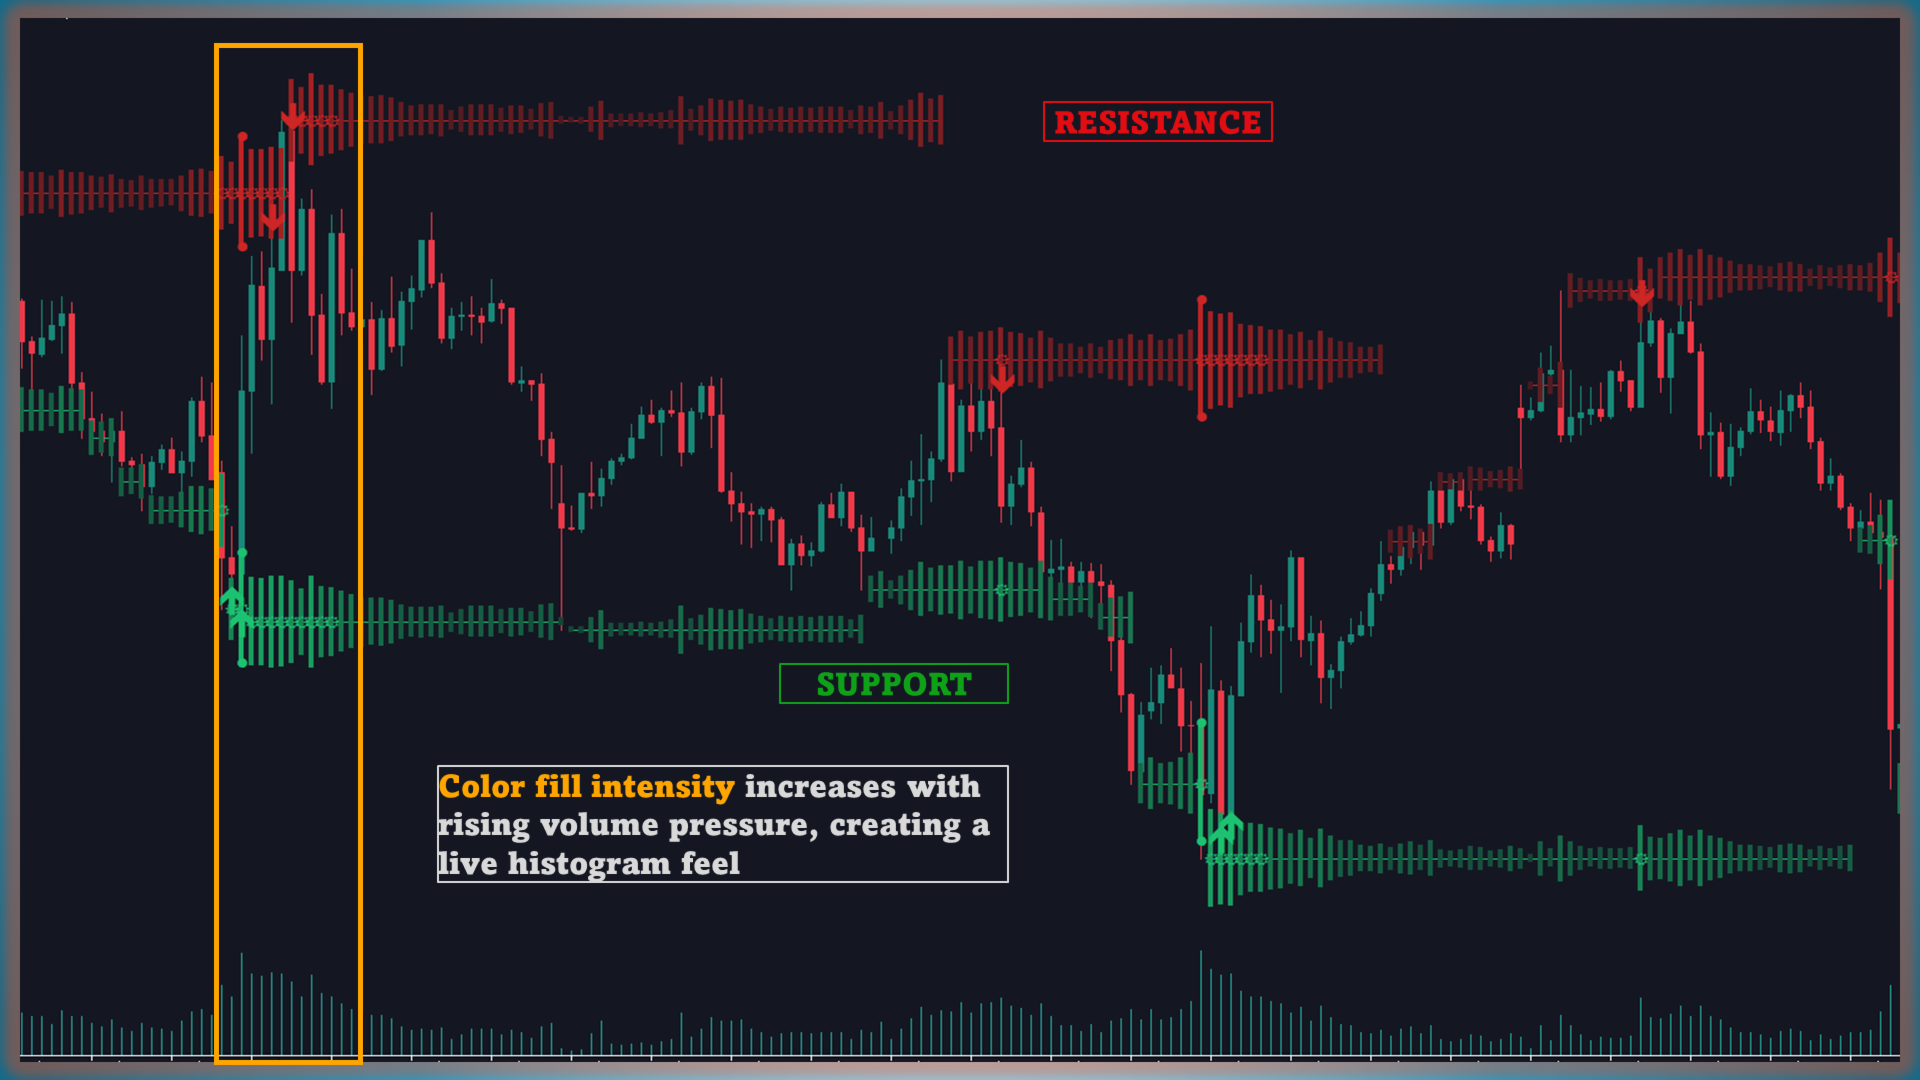
Volume histogram — a filled band whose width changes with the percentile rank of volume near the zone.
-
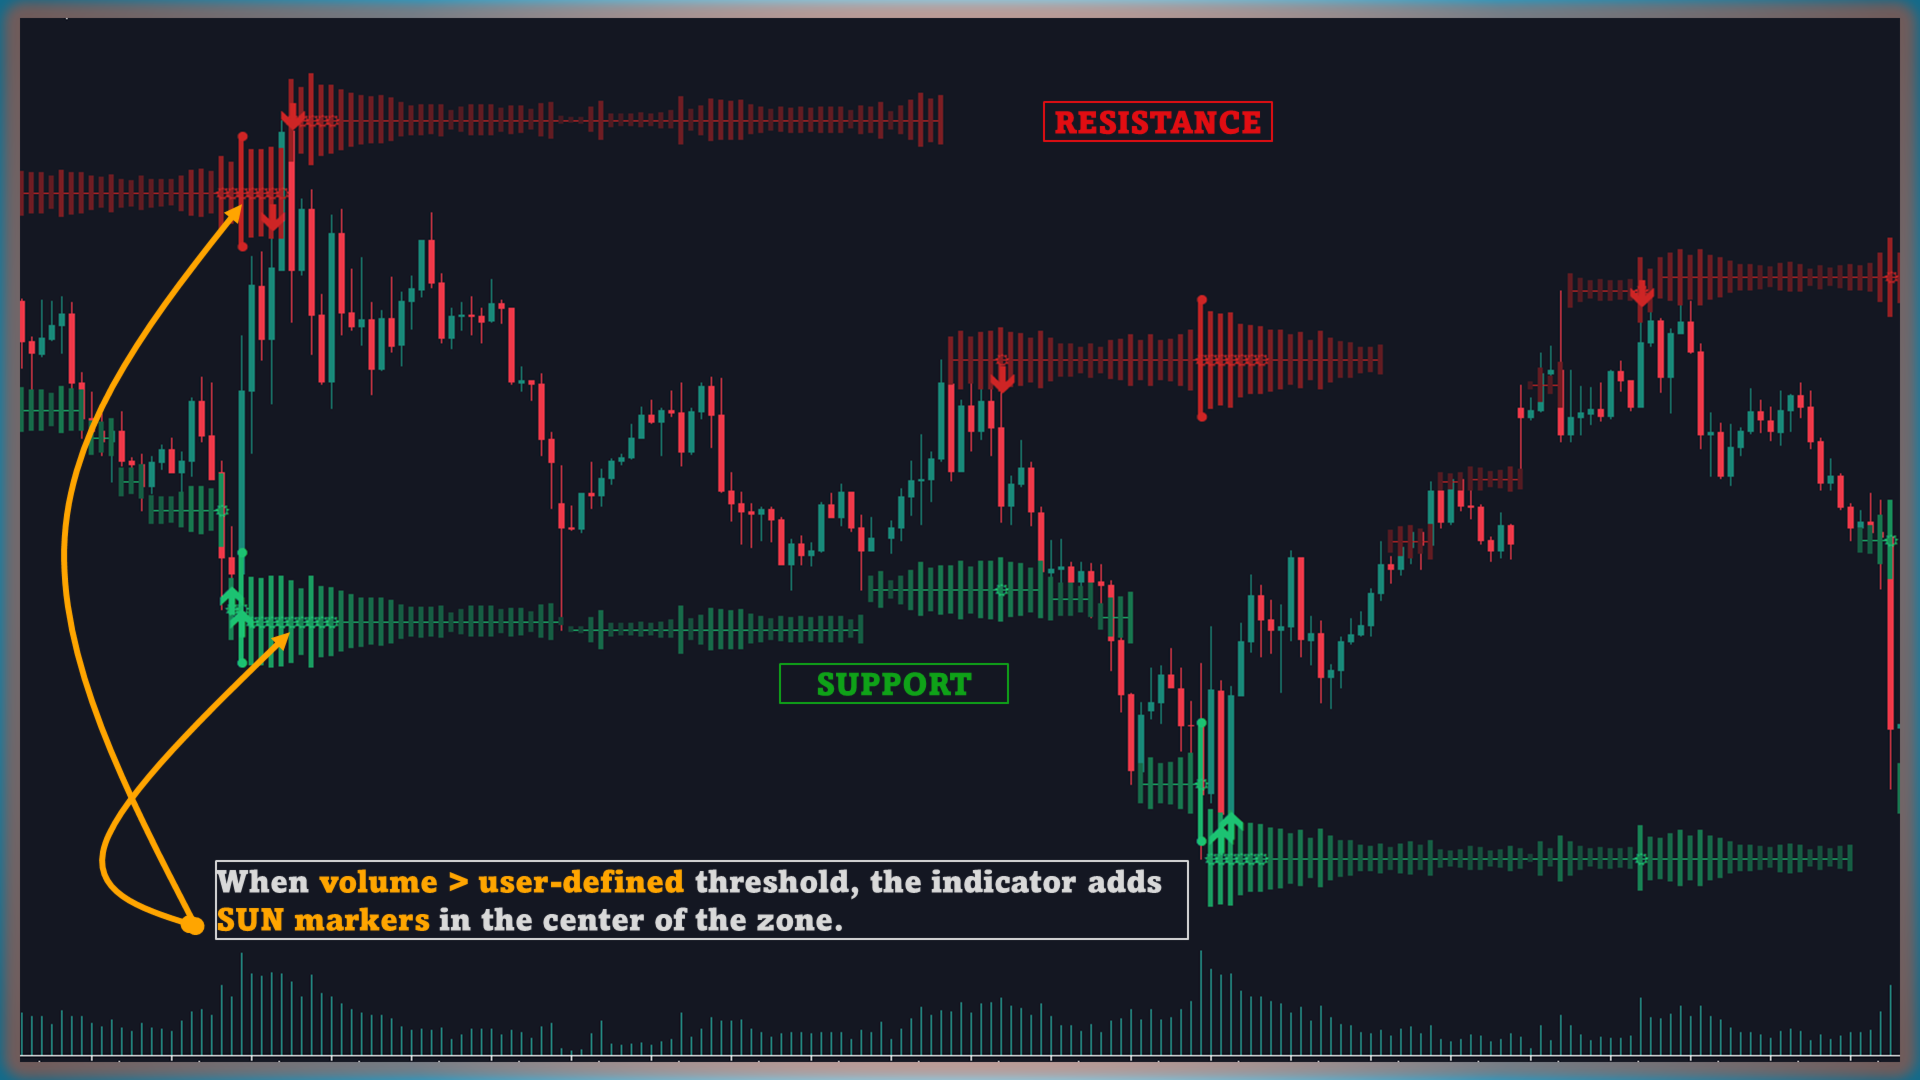
High‑volume marker — a circle that appears when volume at a zone exceeds a user‑defined threshold.
-
Bars volume max — a “sun” icon shown on candles whose volume crosses that threshold, highlighting the start of heightened activity.
-
Pivot look‑back – number of bars used to find swing highs and lows.
-
Volume threshold – percentile or absolute value that triggers markers and Bars volume max.
-
Band expansion factor – controls how much the histogram widens under higher volume.
-
Colour options – separate colours for support, resistance, histogram, and markers.
-
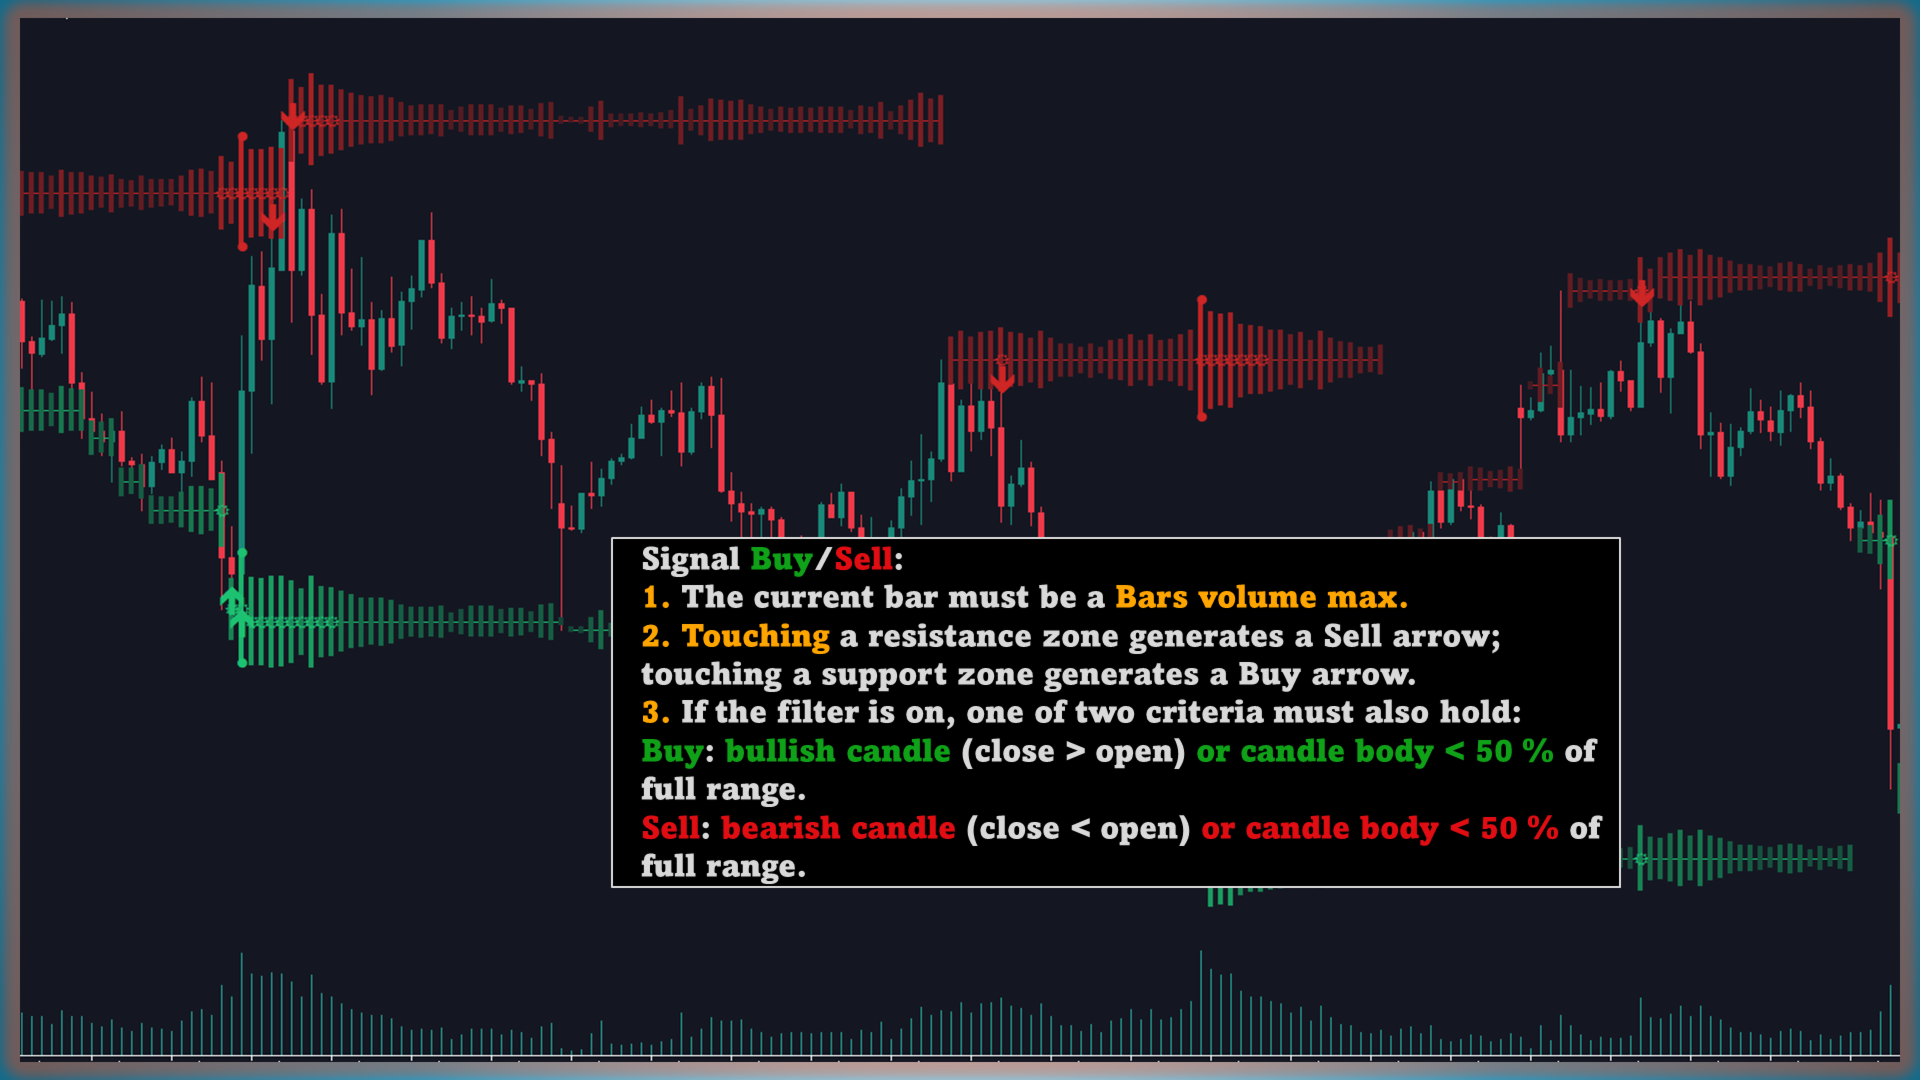
Candle filter for signal – extra conditions for arrow signals:
-
The current bar must be a Bars volume max.
-
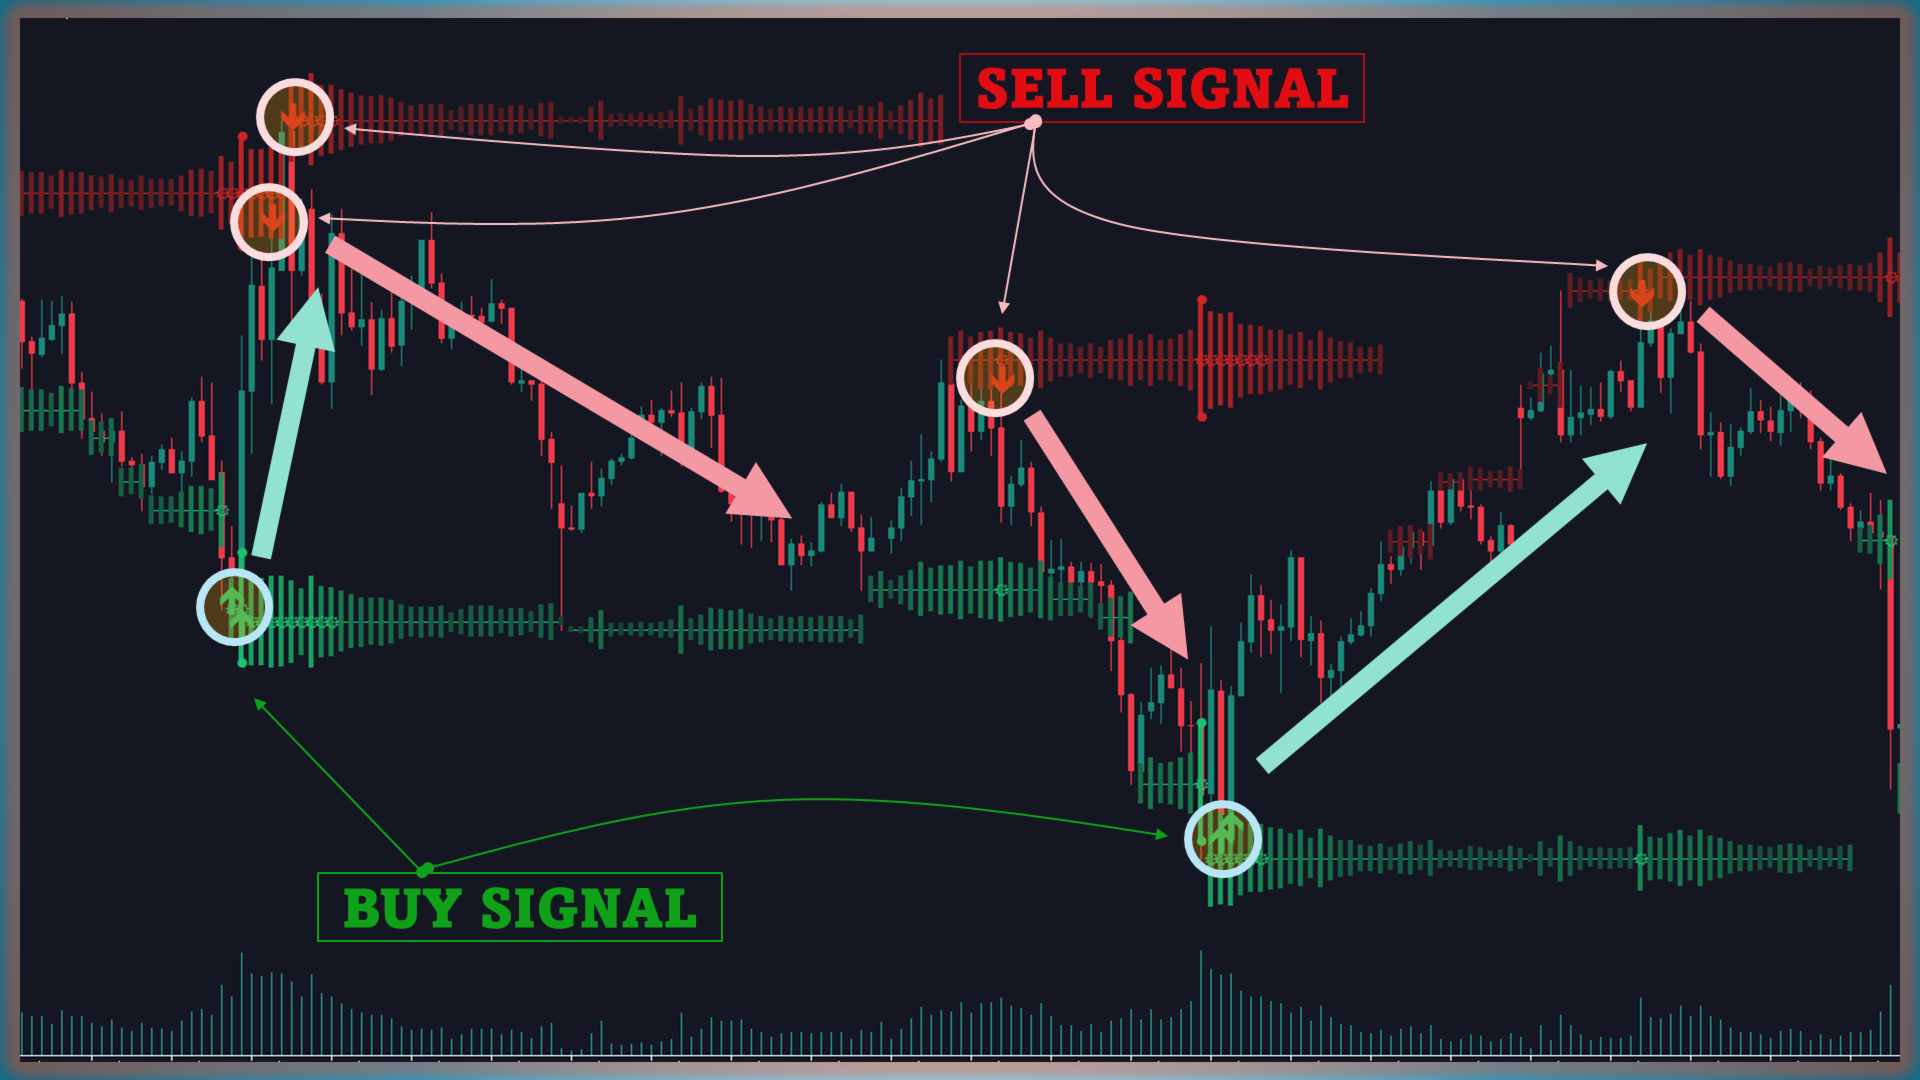
Touching a resistance zone generates a Sell arrow; touching a support zone generates a Buy arrow.
-
If the filter is on, one of two criteria must also hold:
-
Buy: bullish candle (close > open) or candle body < 50 % of full range.
-
Sell: bearish candle (close < open) or candle body < 50 % of full range.
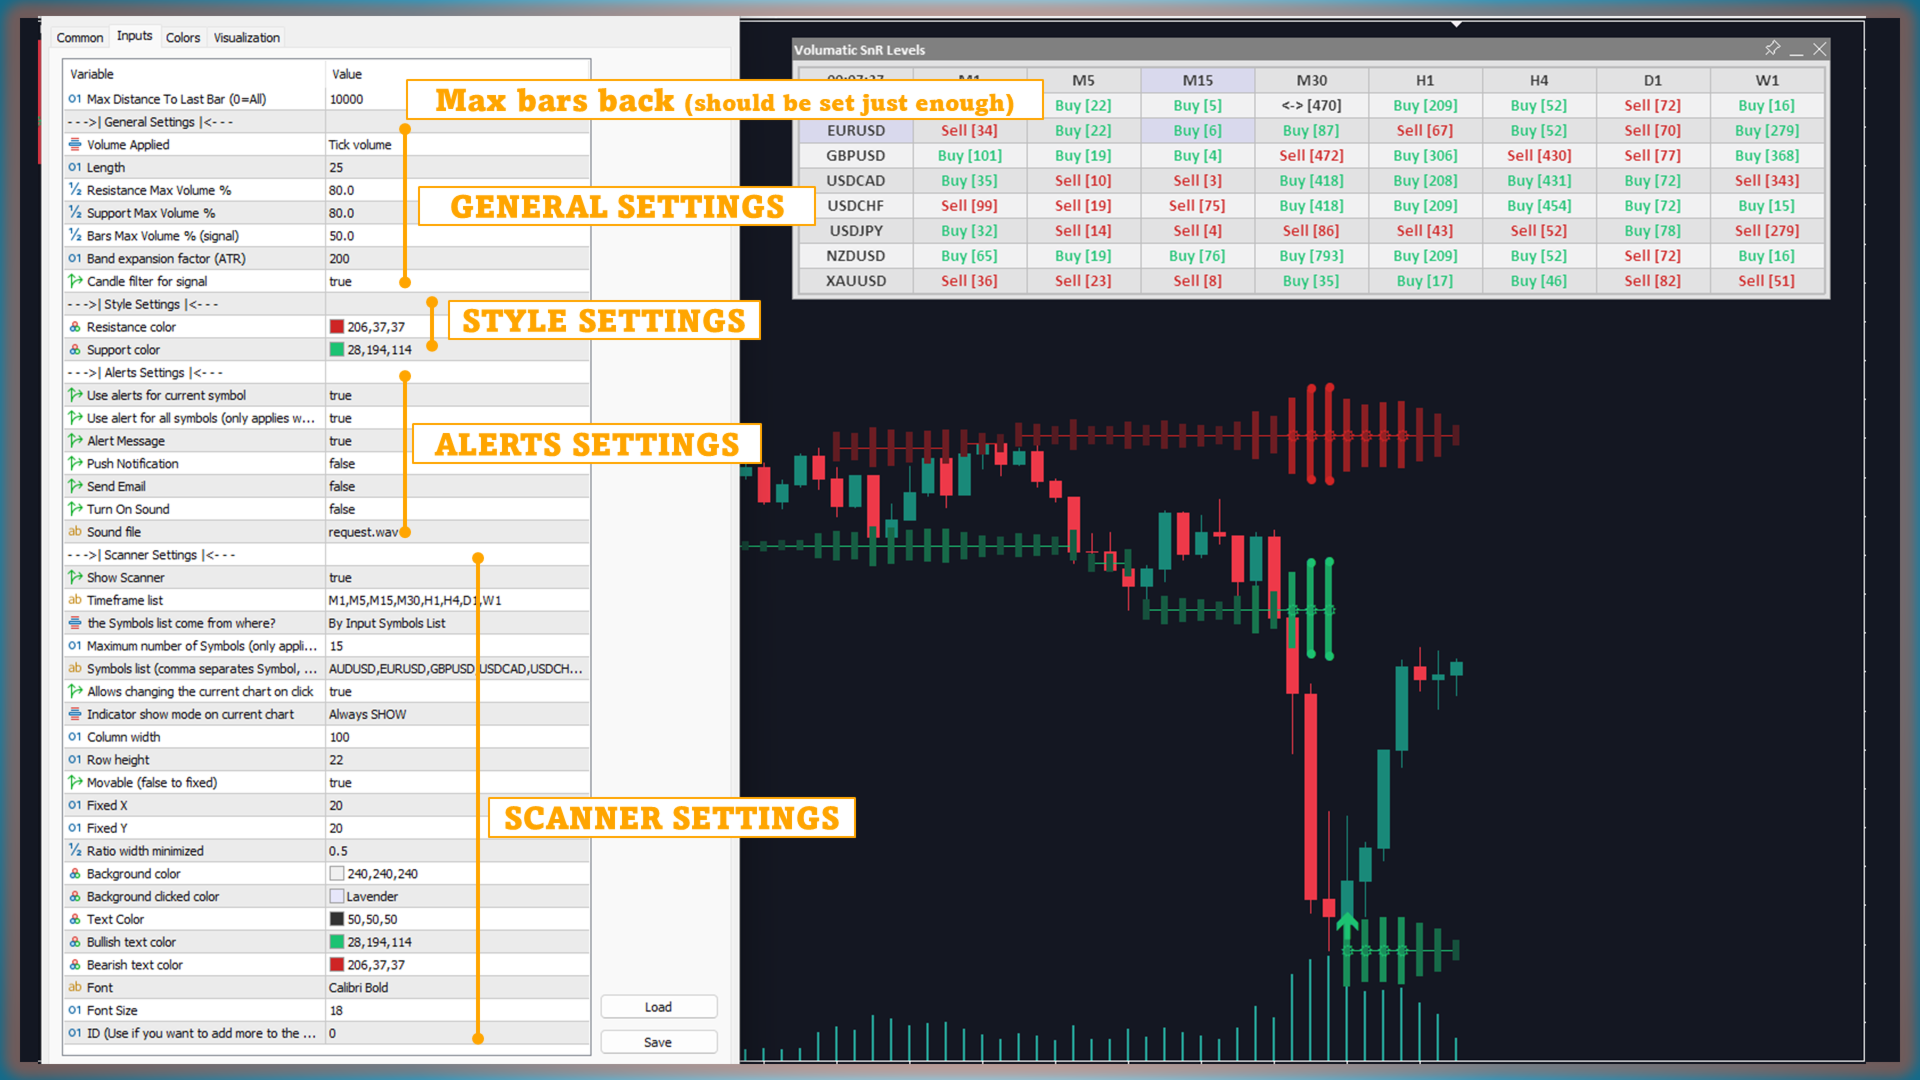
- Alert Settings - Enable alerts when Buy/Sell signals appear
- Watch support (green) and resistance (red) zones together with their volume histograms.
- Give extra attention to zones that show both a thick histogram and a high‑volume marker—an indication of strong participation.
- Use the coloured candles to identify when the volume surge started and place that moment in broader market context.
- Combine the output with trend lines, liquidity zones, or other tools when building a trade plan.
-
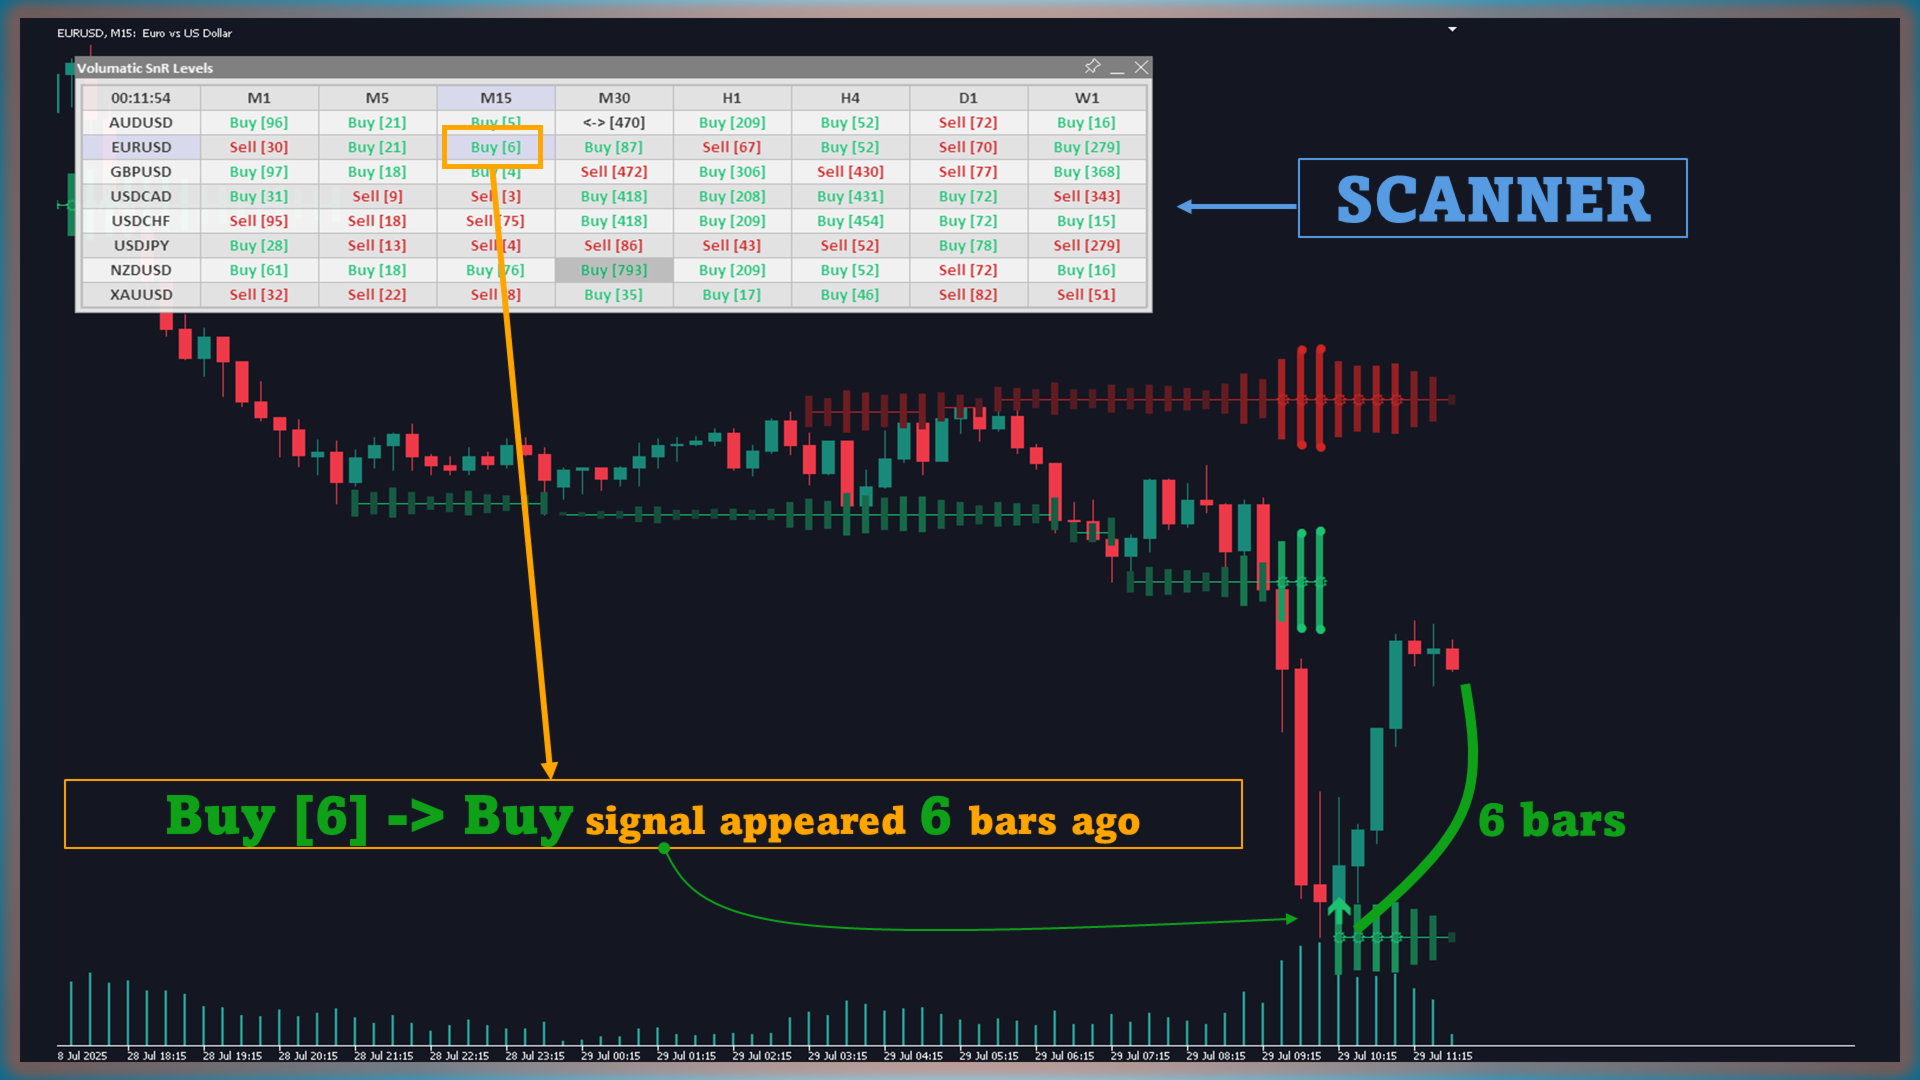
Monitors Buy/Sell signals across multiple symbols and timeframes for a quick market overview.
-
Note: loading a large number of symbols or timeframes may slow platform start‑up.
Conclusion
Volumatic Support/Resistance Levels offers a clear view of where trading activity concentrates around key price levels. By merging price structure and volume data, it helps users evaluate how firmly the market interacts with each zone.