Triple Exponential Moving Average Indicator MT5
- Indicators
- Eda Kaya
- Version: 2.1
Triple Exponential Moving Average Indicator MetaTrader 5
The Triple Exponential Moving Average (Trix) indicator in MetaTrader 5 serves as a powerful tool for traders, assisting them in determining price momentum and identifying overbought or oversold market conditions. This oscillator generates signals through blue arrows for Buy signals and red arrows for Sell signals. By utilizing the Exponential Moving Average (EMA), the Trix indicator forecasts price movements and provides trade entry signals.
«Indicator Installation & User Guide»
MT5 Indicator Installation | Triple Exponential Moving Average MT4 | ALL Products By TradingFinderLab | Best MT5 Indicator: Refined Order Block Indicator for MT5 | Best MT5 Utility: Trade Assistant Expert TF MT5 | TP & SL Tool: Risk Reward Ratio Calculator RRR MT5 | Prop Firm Protector: Trade Assist Prop Firm Plus TF Expert MT5 | Money Management + DrawDown Protector: Trade Panel Prop Firm Drawdawn Limiter Pro MT5
Triple Exponential Moving Average Table
| Category | Oscillator - Volatile - Signal and Forecast |
| Platform | MetaTrader 5 |
| Skill Level | Beginner |
| Indicator Type | Leading - Continuation |
| Time Frame | Multi Time Frame |
| Trading Style | Short-Term - Medium-Term |
| Market | Forex - Cryptocurrencies |
Indicator Overview
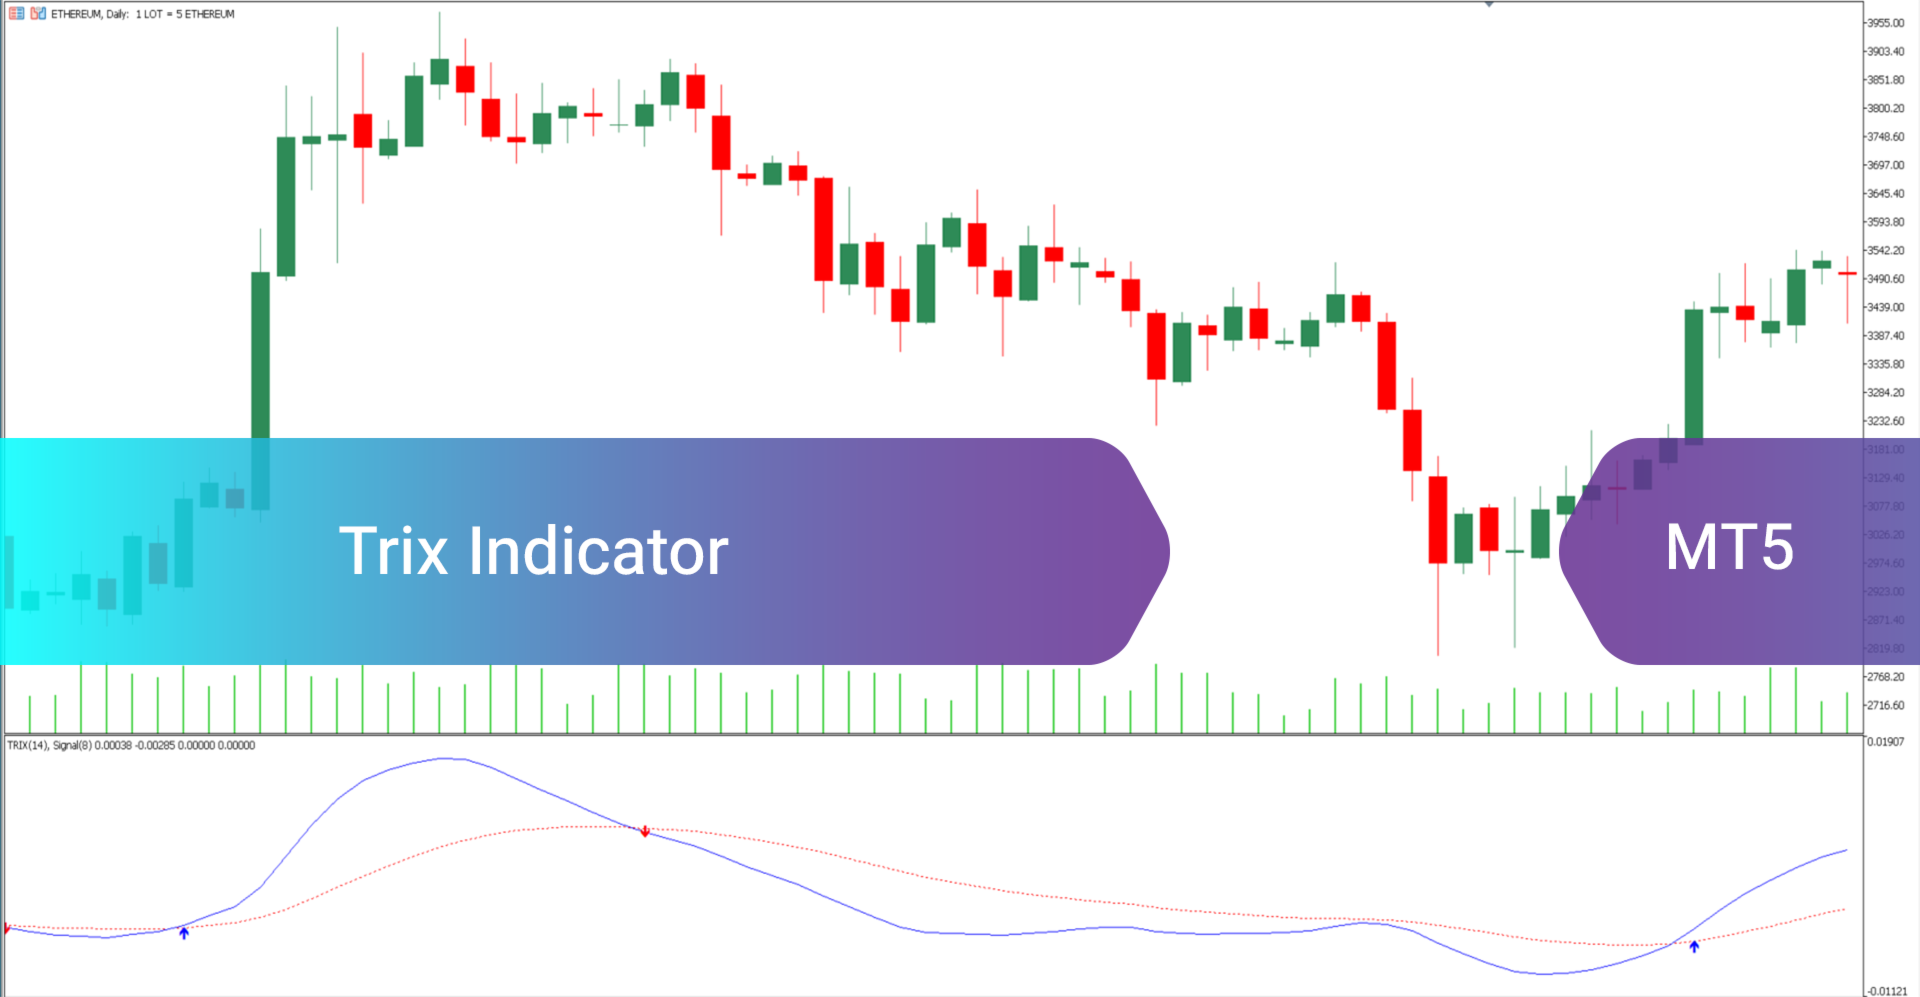
The Trix Triple Exponential Moving Average is a momentum-based oscillator that delivers both buy and sell signals. It helps traders make informed decisions regarding trade entry and exit points, based on price changes. The Trix indicator primarily employs the triple exponential moving average to generate these trading signals.
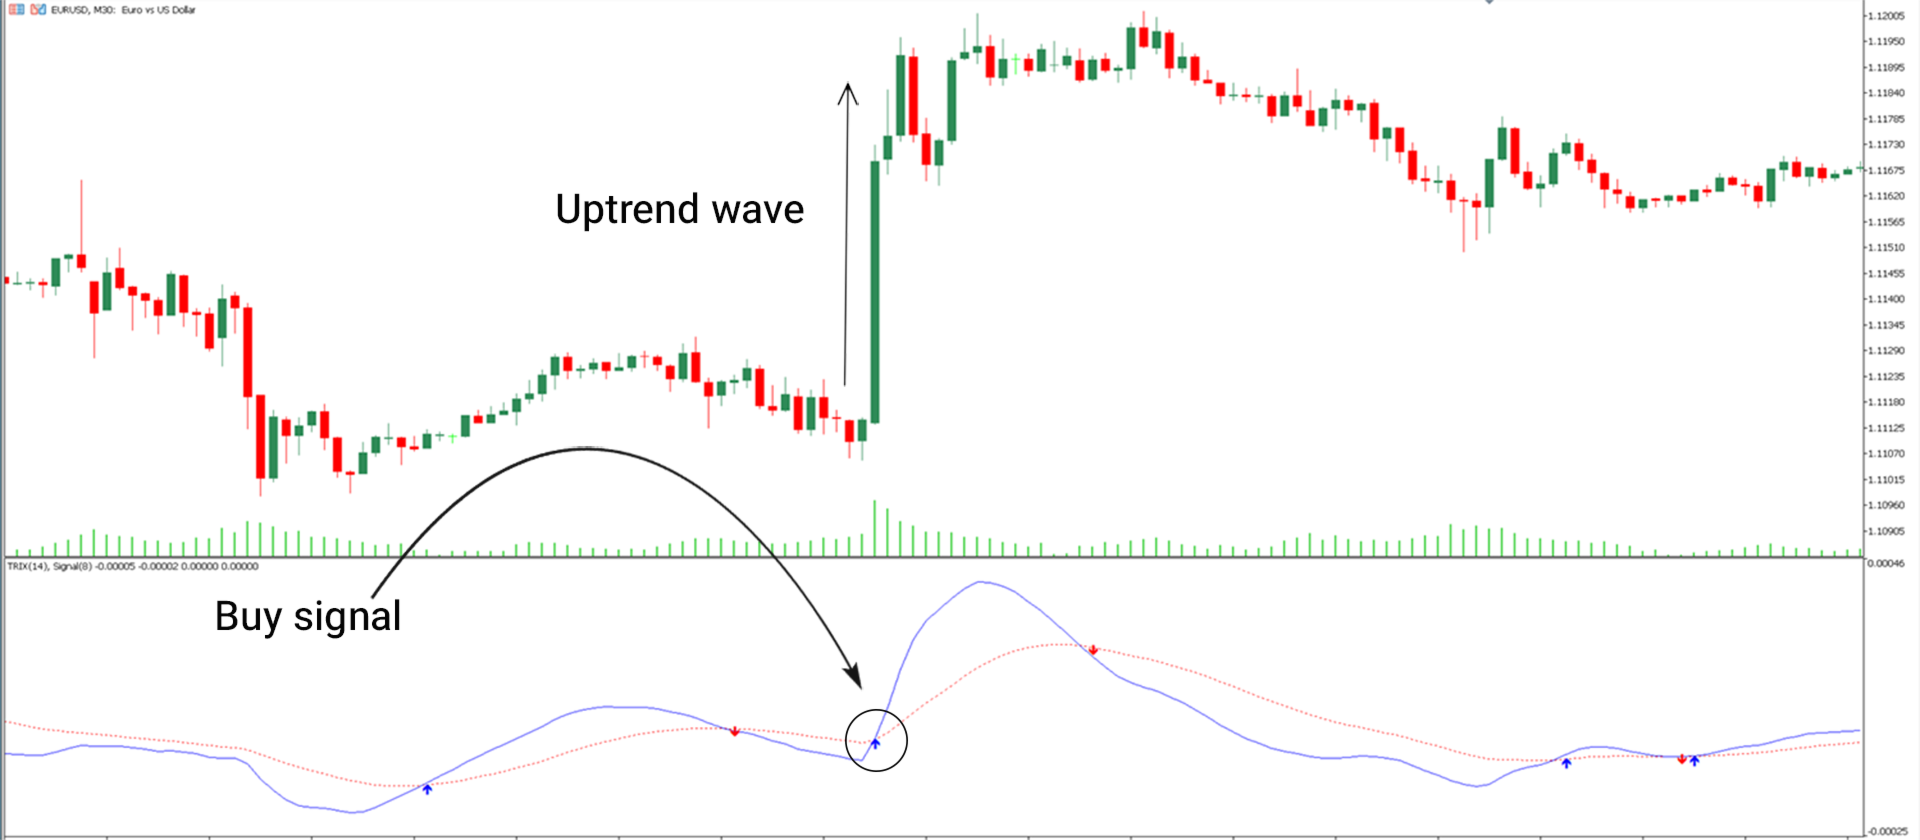
Buy Signal in an Uptrend
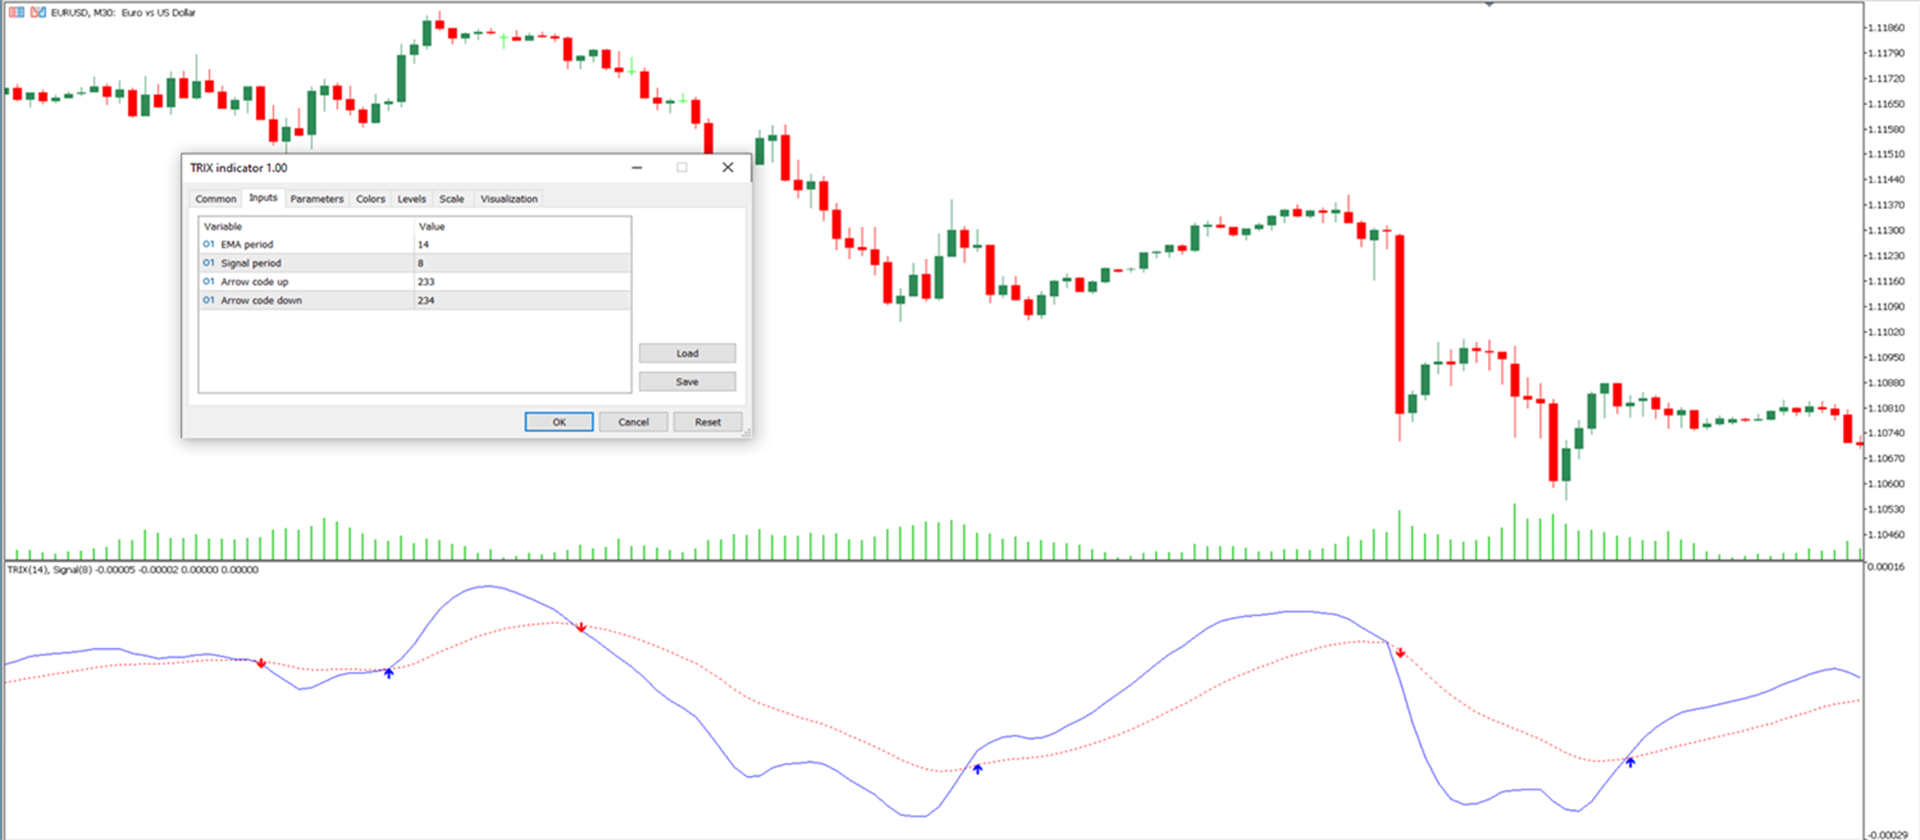
Observing the EUR/USD currency pair's price chart on a 30-minute timeframe illustrates how the indicator generates a buy entry signal during an uptrend. As shown in the accompanying image, the blue line crosses above the red line, and the indicator displays a distinctive blue arrow, signaling a Buy entry.
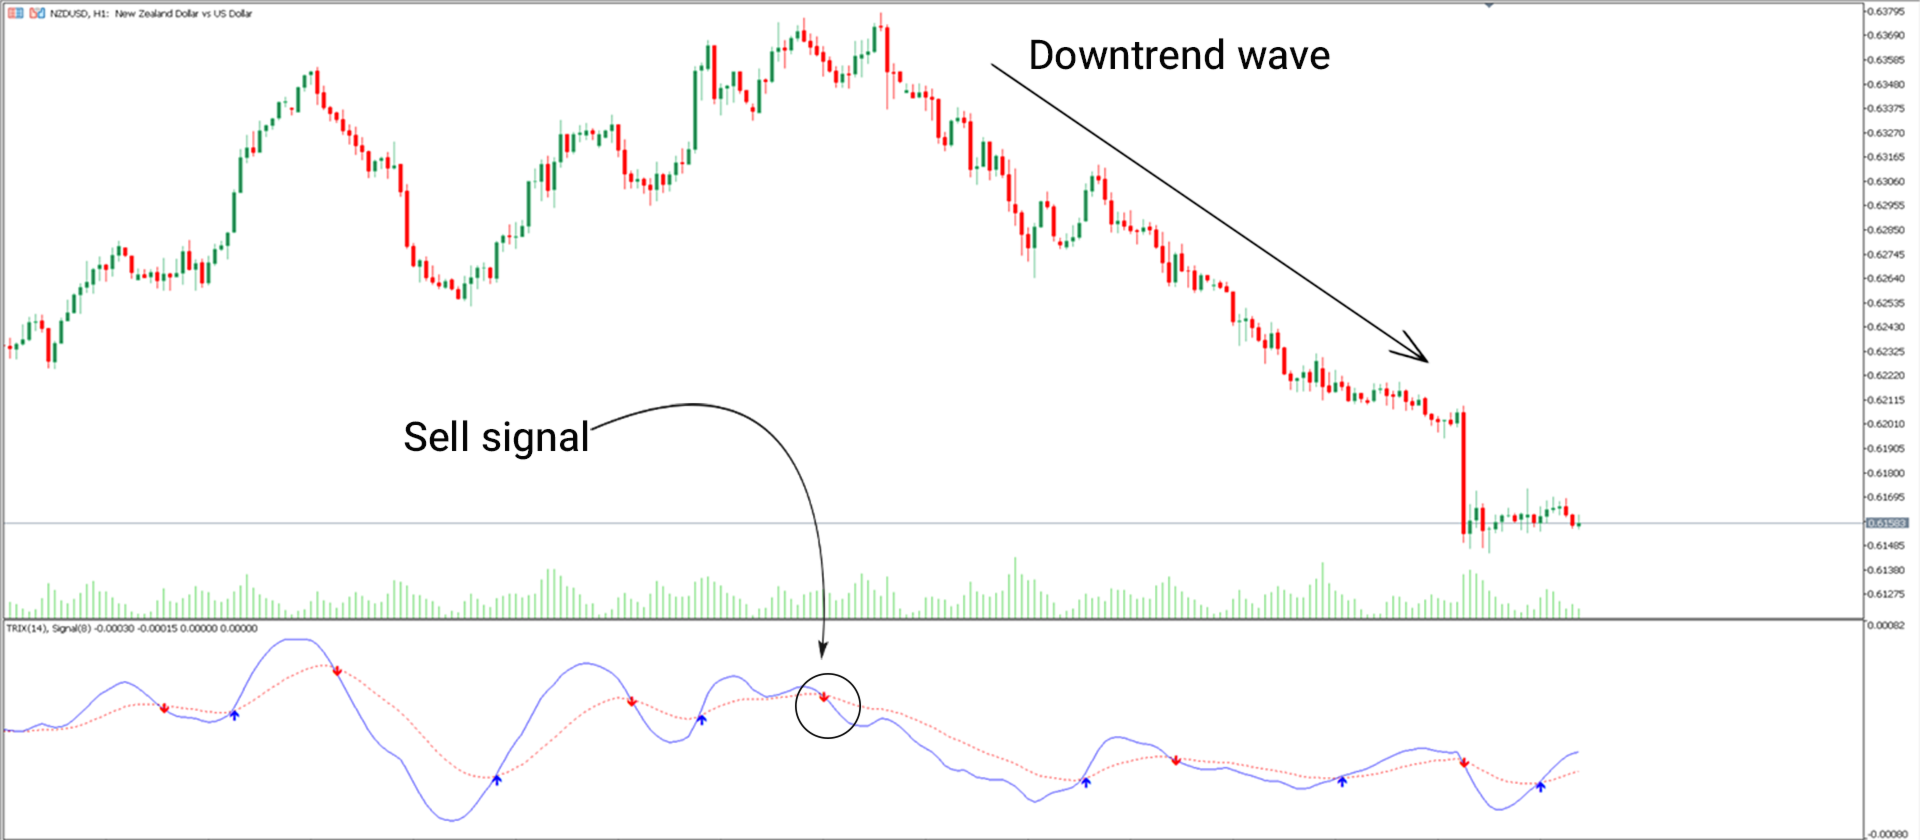
Sell Signal in a Downtrend
Conversely, the NZD/USD currency pair's price chart on a 1-hour timeframe demonstrates how the indicator produces a sell entry signal during a downtrend. In this scenario, as depicted in the image, the blue line crosses below the red line, and the indicator presents a red arrow, signaling a Sell entry.
Indicator Settings
- Trix Period: The indicator's calculation period is set to 14.
- Signal Period: The signal calculation period is set to 8.
- Signals: Signal display is configured to 233.
- CountBars: The number of candles counted is set to 234.
Conclusion
The Triple Exponential Moving Average (Trix) is an effective momentum-based oscillator capable of assessing both overbought and oversold market conditions. It functions as a leading indicator and can detect divergences on the chart, thereby assisting traders in identifying trends and entering trades appropriately.