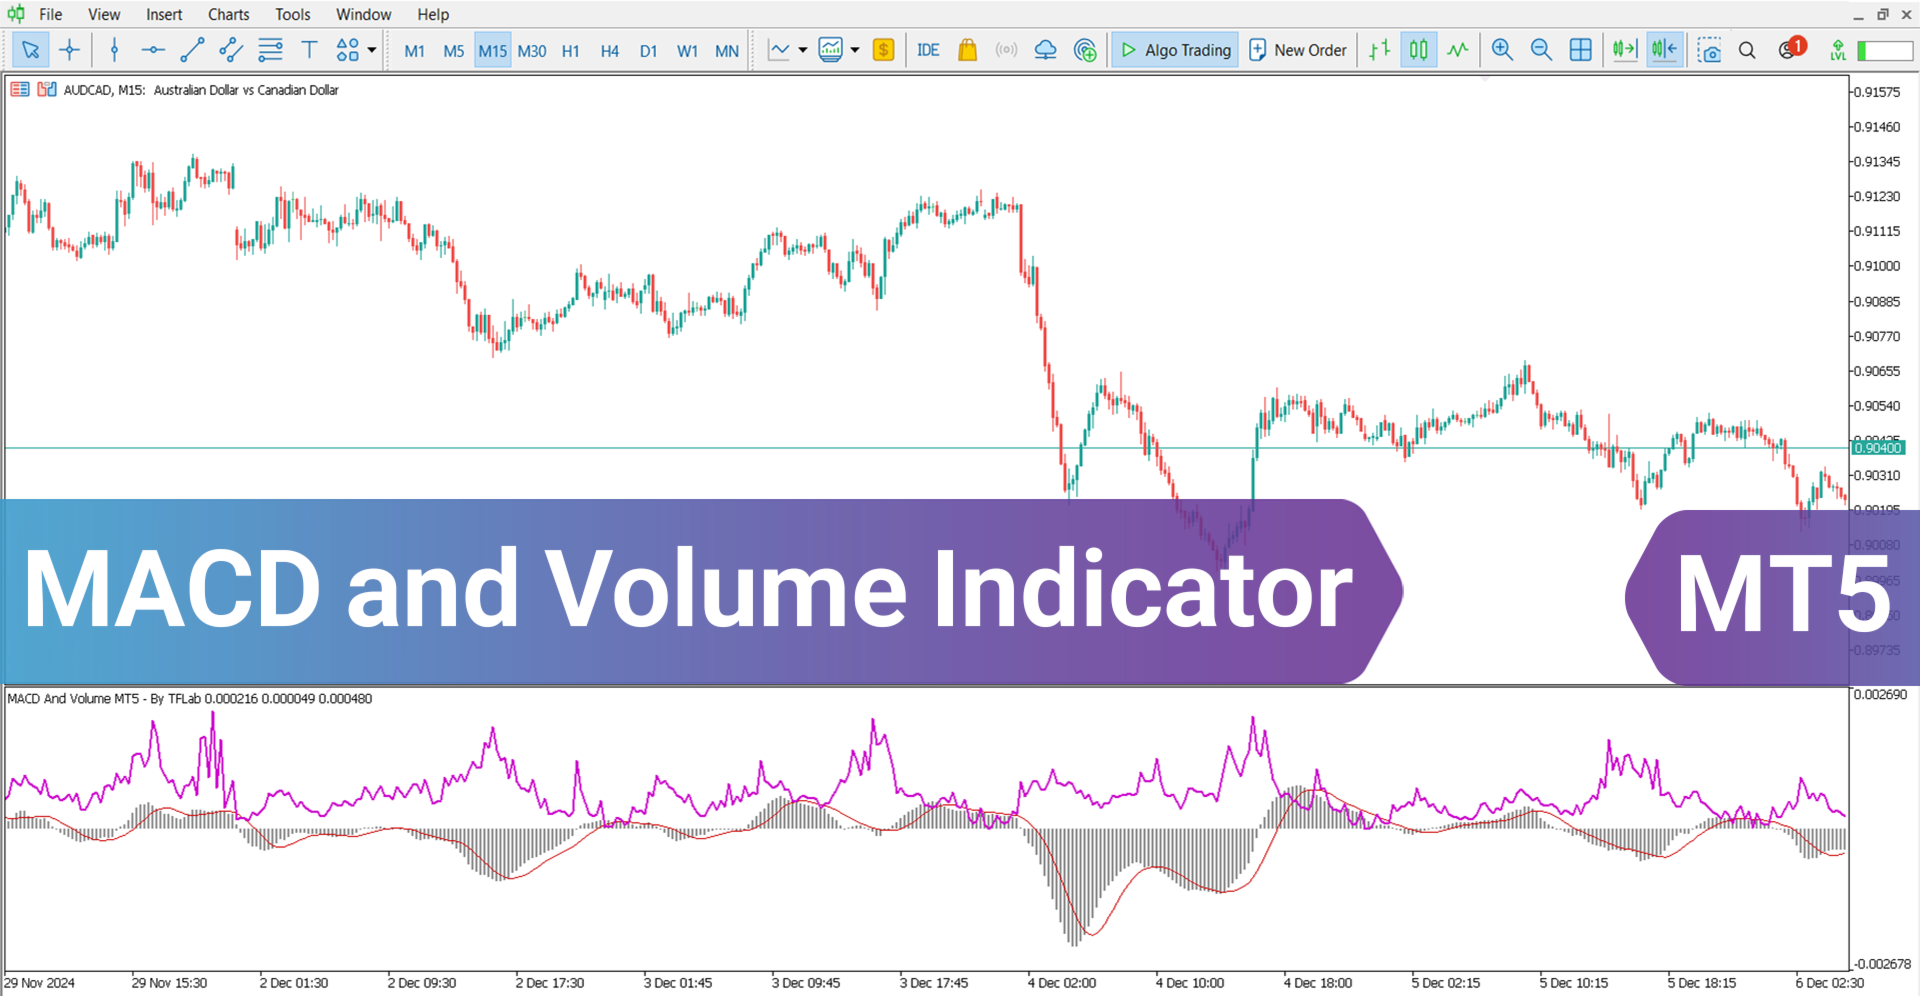
MACD and Volume Indicator MT5
- Indicators
- Eda Kaya
- Version: 2.2
MACD and Volume Indicator for MetaTrader 5
The MACD (Moving Average Convergence Divergence) and Volume Indicators combine core principles of technical analysis. By analyzing the convergence and divergence of moving averages, this tool provides critical insights into trend strength and potential reversals.
The integration of momentum and volume analysis makes it a powerful resource for informed trading strategies.
«Indicator Installation & User Guide»
MT5 Indicator Installation | MACD and Volume Indicator MT4 | ALL Products By TradingFinderLab | Best MT5 Indicator: Refined Order Block Indicator for MT5 | Best MT5 Utility: Trade Assistant Expert TF MT5 | TP & SL Tool: Risk Reward Ratio Calculator RRR MT5 | Prop Firm Protector: Trade Assist Prop Firm Plus TF Expert MT5 | Money Management + DrawDown Protector: Trade Panel Prop Firm Drawdawn Limiter Pro MT5
MACD and Volume Indicator Specifications Table
The key specifications of the MACD and Volume Indicator are outlined in the table below:
| Category | Volatile - Oscillator - Currency Strength |
| Platform | MetaTrader 5 |
| Skill Level | Intermediate |
| Indicator Type | Range - Trend Continuation - Reversal |
| Timeframe | Multi timeframe |
| Trading Style | Intraday Trading |
| Trading Market | All Markets |
Indicator Overview
The MACD and Volume Indicator includes two main elements: histogram bars and a volume oscillator.
- Histogram Bars: Represent the difference between the MACD line and the signal line.
- Extended bars indicate a strengthening trend, reflecting increasing momentum.
- Shorter bars suggest weakening trends, hinting at potential slowdowns or reversals.
- Volume Oscillator: Confirms trend continuation or points to possible reversals.
- Rising volume supports the continuation of bullish trends.
Declining volume may indicate a potential reversal, prompting traders to proceed with caution.
Uptrend Conditions
The price chart below displays the EUR/AUD currency pair on a 15-minute timeframe. When the histogram bars move above the zero level and the volume oscillator shows divergence, this signals strong bullish momentum. Traders may interpret this setup as a possible entry opportunity.
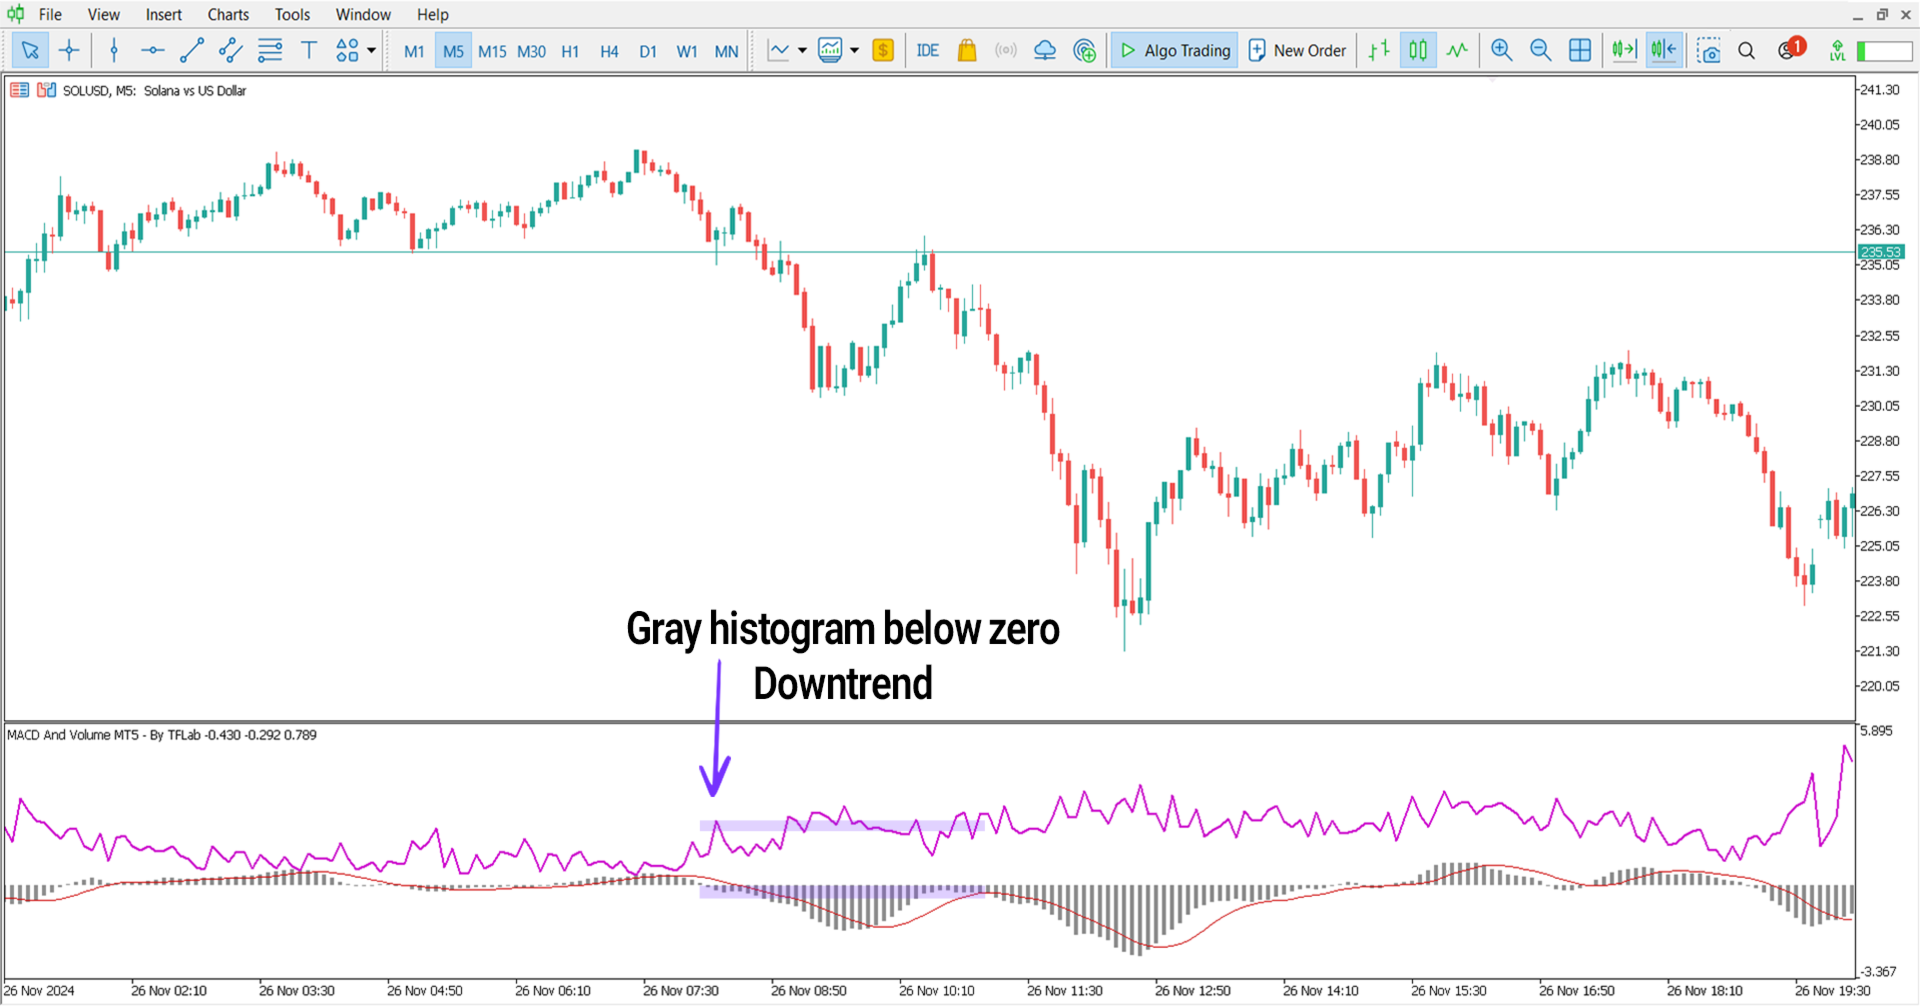
Downtrend Conditions
In the 5-minute chart of Solana (SOL/USD), falling histogram bars below the zero line combined with volume oscillator divergence reflect selling pressure. This configuration can be viewed as a potential sell signal.
Indicator Settings
The image below outlines the customizable settings available for the MACD and Volume Indicator:
• Fast EMA period: Set to 12;
• Slow EMA period: Set to 26;
• Signal SMA period: Set to 9;
• Applied price: Choose the price source;
• Type of volume: Define the volume type;
• Theme: Select the display theme.
Conclusion
The MACD and Volume Indicators are vital tools for technical analysis. MACD assists in identifying price direction and measuring trend strength, while the volume oscillator validates those trends. Combining both elements improves analytical precision and supports more confident decision-making, making this indicator a valuable asset for traders seeking strategic advantage.