Classic Shark Harmonic Pattern Indicator MT5
- Indicators
- Eda Kaya
- Version: 2.1
Classic Shark Harmonic Pattern Indicator for MetaTrader 5
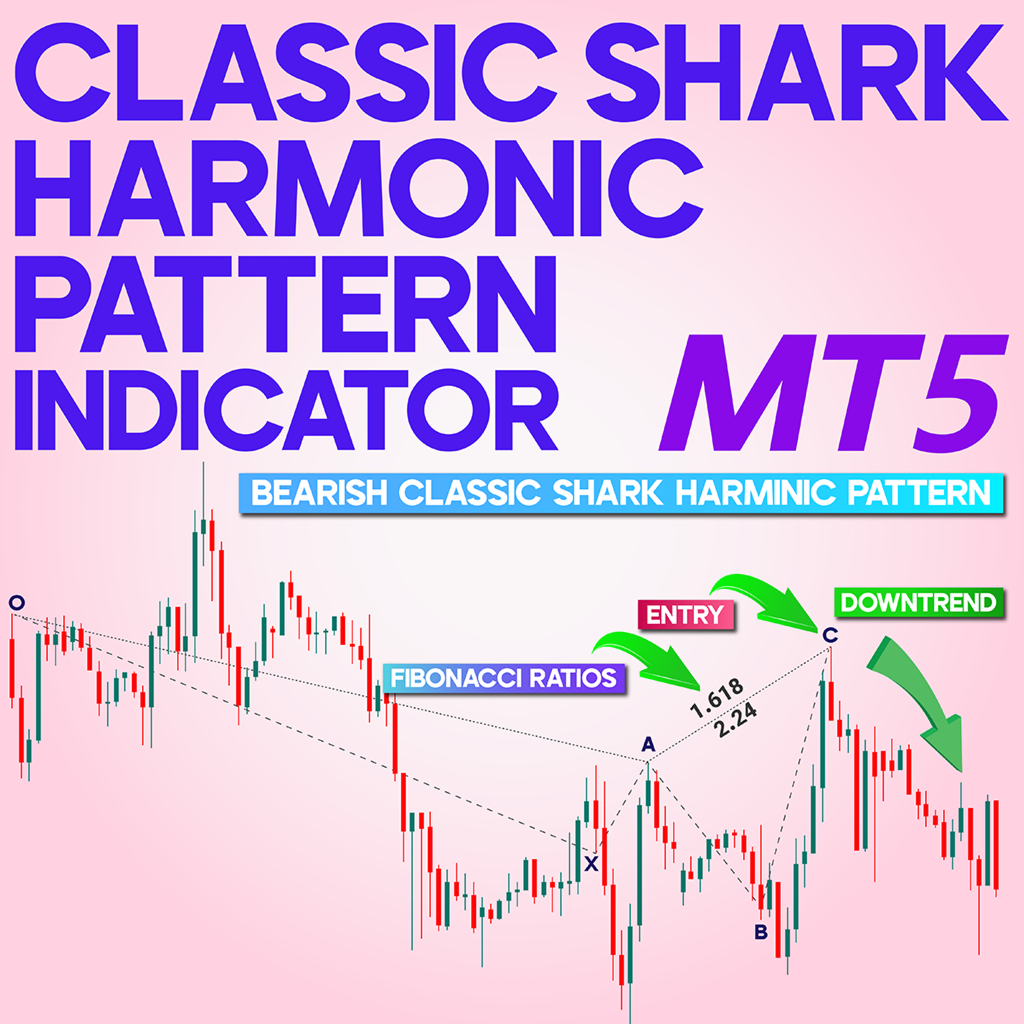
The Classic Shark Harmonic Pattern Indicator utilizes specific Fibonacci ratios—such as 88.6%, 113%, and 161.8%—to detect potential price reversal zones. By recognizing the geometric configuration of the pattern, the indicator automatically draws the Shark pattern on the chart and highlights the Potential Reversal Zone (PRZ) when conditions are met.
«Indicator Installation & User Guide»
MT5 Indicator Installation | Classic Shark Harmonic Pattern Indicator MT4 | ALL Products By TradingFinderLab | Best MT5 Indicator: Refined Order Block Indicator for MT5 | Best MT5 Utility: Trade Assistant Expert TF MT5 | TP & SL Tool: Risk Reward Ratio Calculator RRR MT5 | Money Management: Easy Trade Manager MT5 | Trade Copier: Free Fast Local Trade Copier MT5 | Money management + prop protector: Trade Assist Prop Protector MT5
Classic Shark Harmonic Pattern Indicator Table
The features of the Classic Shark Harmonic Pattern Indicator are summarized in the table below:
| Category | Harmonic Pattern – Support and Resistance – Classic and Chart Patterns |
| Platform | MetaTrader 5 |
| Skill Level | Intermediate |
| Indicator Type | Continuation – Reversal |
| Timeframe | Multi-Timeframe |
| Trading Style | Day Trading |
| Market | All Markets |
Indicator at a Glance
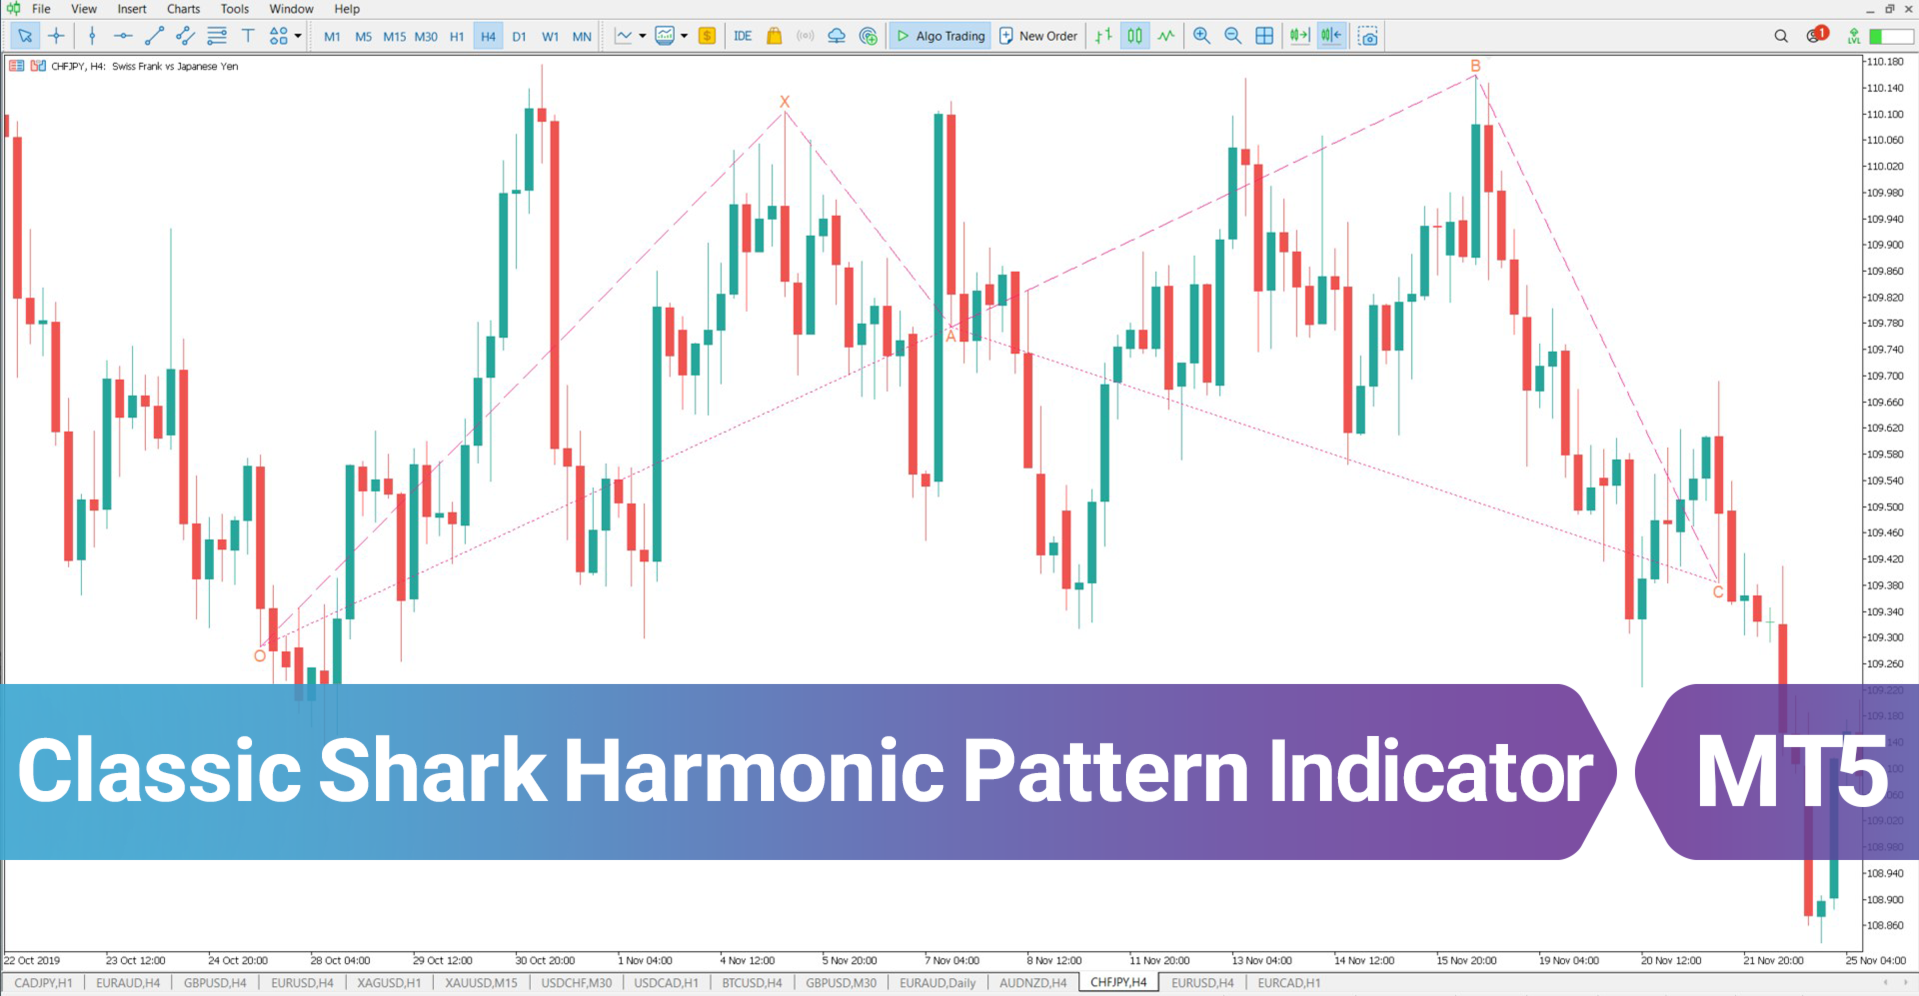
The Classic Shark Harmonic Pattern is a reversal setup among MT5 harmonic indicators. It comprises five key points: O, X, A, B, and C, making it suitable for day traders.
The most crucial Fibonacci levels are applied to the B-C and O-X waves. In the B-C wave, price movement typically extends between 113% and 161.8% of the A-B wave. Meanwhile, point C should align with the 88.6% Fibonacci retracement of the O-X wave.
Indicator in an Uptrend
In the example of the GBP/USD pair, the Classic Shark Harmonic Pattern appears in an uptrend.
After the O, X, A, and B points form, the price advances into the C zone—between 0.886 and 1.13 of the O-X wave. A price reaction at this level, along with a reversal candlestick pattern, signals the potential start of a new upward movement.
Indicator in a Downtrend
On the EUR/CAD chart, the Classic Shark Harmonic Pattern completes during a downtrend. Following an initial upward move through points O to B, the price approaches point C, a sensitive reversal zone. This area lies between the 0.886 and 1.13 Fibonacci levels of the O-X wave.
When combined with signs such as trend exhaustion and overbought conditions, this zone strongly suggests a likely price reversal into a new downtrend.
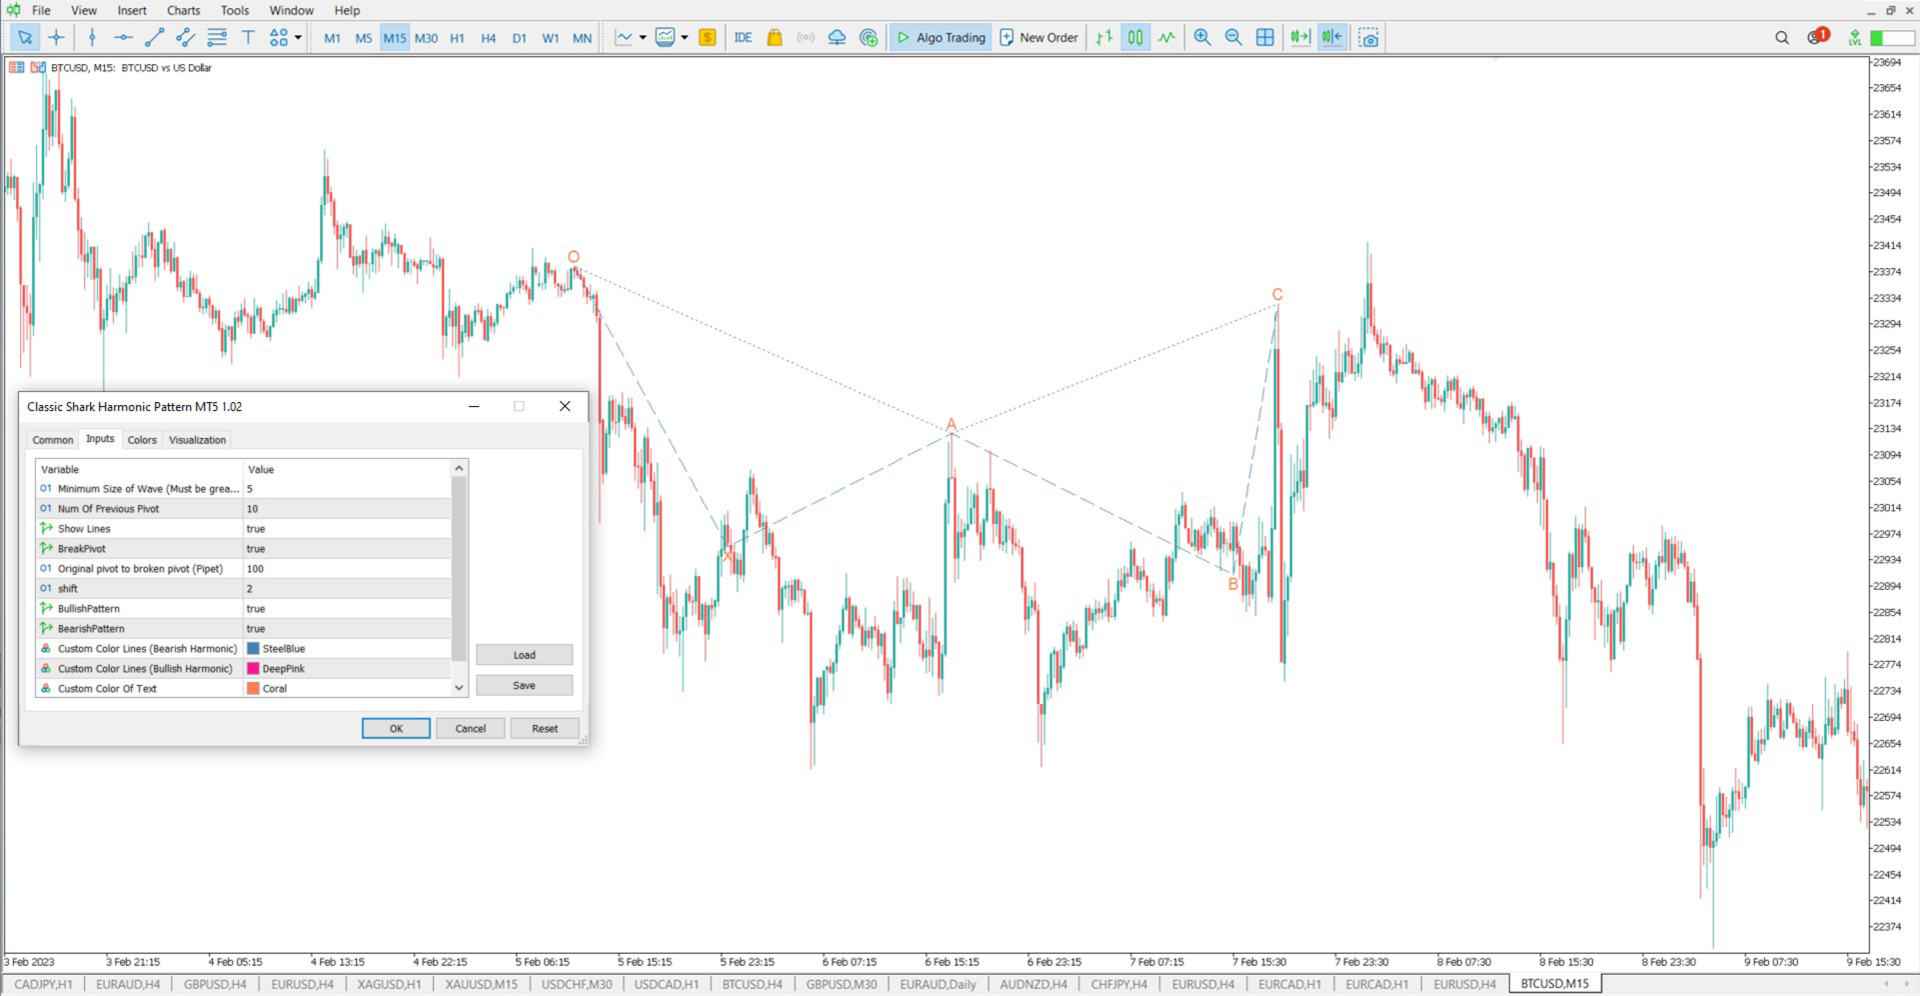
Classic Shark Harmonic Pattern Indicator Settings
-
Minimum Length of Wave (candle): Sets the minimum wave length using candle count
-
Num Of Previous Candle: Defines the number of historical candles for analysis
-
Show Lines: Option to show or hide the pattern lines
-
BreakPivot: Enables detection of pivot breaks
-
Original Pivot to Broken Pivot (Pipet): Sets the threshold between the original and broken pivots
-
Shift: Adjusts the shift of the pattern on the chart
-
BullishPattern: Enables the identification of bullish patterns
-
BearishPattern: Enables the identification of bearish patterns
-
Style Of Line: Selects the drawing style for pattern lines
-
Width Of Line: Adjusts the thickness of the pattern lines
-
Custom Color Lines (Bearish Harmonic): Sets custom color for bearish lines
-
Custom Color Lines (Bullish Harmonic): Sets custom color for bullish lines
-
Custom Color Of Text: Defines the color for text labels
Conclusion
The Classic Shark Harmonic Pattern Indicator is a highly effective tool for identifying market reversals at key levels.
By automatically plotting the Shark pattern using precise Fibonacci measurements—88.6%, 113%, and 161.8%—this MT5 indicator helps traders locate the Potential Reversal Zone (PRZ) and make more informed trading decisions.