Classic Cypher Harmonic Pattern Indicator MT5
- Indicators
- Eda Kaya
- Version: 2.1
Classic Cypher Harmonic Pattern Indicator for MT5
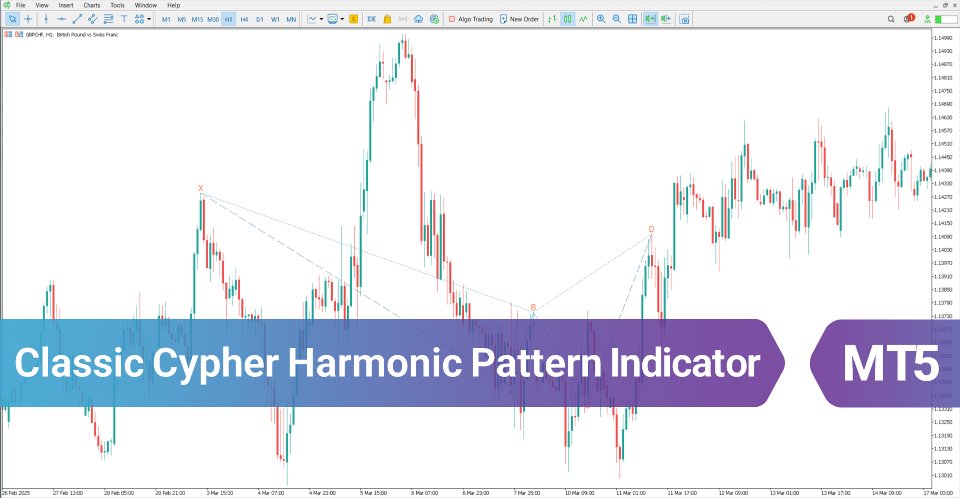
The Classic Cypher Harmonic Pattern Indicator is a technical analysis tool based on harmonic structures and designed with asymmetrical Fibonacci ratios. This indicator accurately identifies key points—X, A, B, C, and D—and marks significant potential reversal zones on the chart using red and gray lines for clear visual guidance.
«Indicator Installation & User Guide»
MT5 Indicator Installation | Classic Cypher Harmonic Pattern Indicator MT4 | ALL Products By TradingFinderLab | Best MT5 Indicator: Refined Order Block Indicator for MT5 | Best MT5 Utility: Trade Assistant Expert TF MT5 | TP & SL Tool: Risk Reward Ratio Calculator RRR MT5 | Money Management: Easy Trade Manager MT5 | Trade Copier: Free Fast Local Trade Copier MT5 | Money management + prop protector: Trade Assist Prop Protector MT5
Classic Cypher Harmonic Pattern Specifications Table
The specifications of the Classic Cypher Harmonic Pattern Indicator are presented in the table below:
| Category | Harmonic Pattern – Classic & Chart Patterns – Price Action |
| Platform | MetaTrader 5 |
| Skill Level | Intermediate |
| Indicator Type | Reversal – Continuation |
| Timeframe | Multi timeframe |
| Trading Style | Intraday Trading |
| Trading Market | All Markets |
Indicator at a Glance
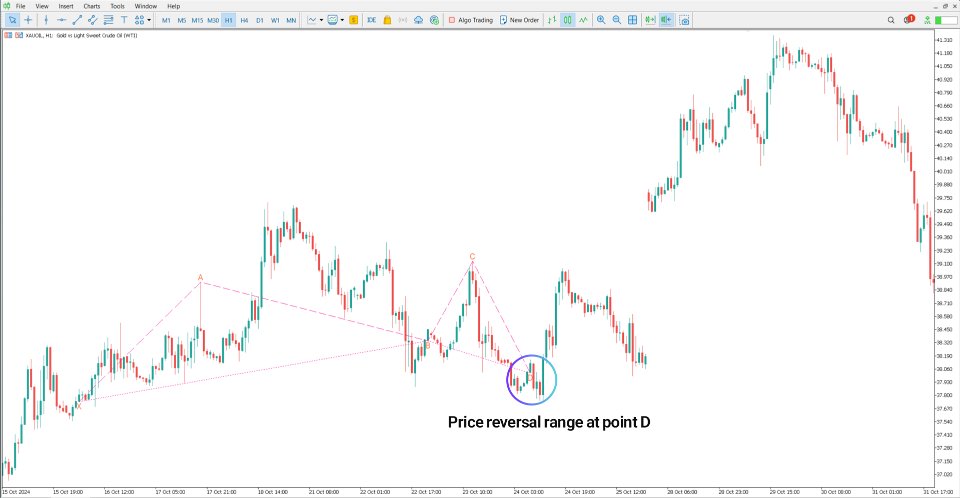
The Classic Cypher Harmonic Pattern Indicator is built on repetitive behavioral patterns in the market. It integrates precise Fibonacci ratios to detect areas where price momentum is weakening. The indicator examines market structure using four sequential waves and five reference points, highlighting point D as the zone with the highest potential for a price reaction.
Uptrend Conditions
On the one-hour Gold vs. Oil chart, the Cypher pattern starts with a bullish movement from point X to A. The market then experiences a pullback to point B.Wave BC follows, breaking above the previous high at point A. After this, the price enters a corrective phase and moves toward point D—identified as a probable bullish reversal zone.
Downtrend Conditions
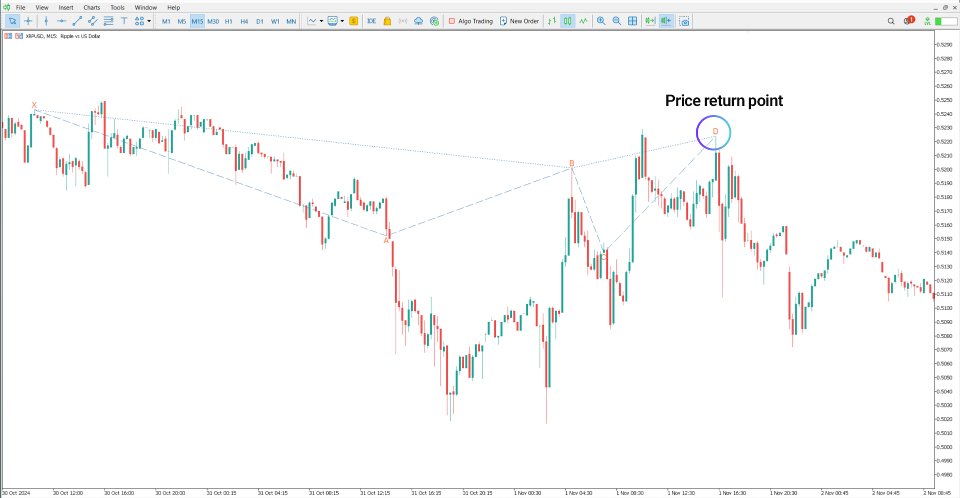
In the 15-minute XRPUSD chart, a bearish Cypher pattern begins with a decline from point X to A, followed by a corrective rise to point B. Wave BC then drops below point A with strong bearish momentum, signaling potential seller dominance. The pattern completes at point D, which serves as the Potential Reversal Zone (PRZ) for a likely bearish trend.
Indicator Settings
-
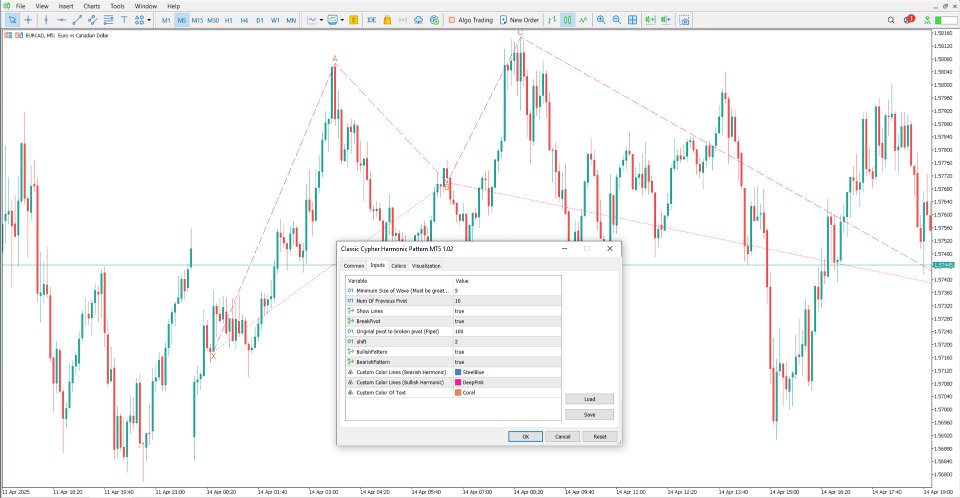
Minimum Length Of Wave (candle): Minimum number of candles per wave
-
Num Of Previous Candle: Number of historical candles analyzed
-
Show Lines: Toggle visibility of pattern lines
-
BreakPivot: Enable pivot breakout analysis
-
Original Pivot to Broken Pivot (Pipet): Distance in pipets between the original and broken pivot
-
Shift: Horizontal adjustment of line positioning
-
BullishPattern: Enable detection of bullish Cypher patterns
-
BearishPattern: Enable detection of bearish Cypher patterns
-
Style Of Line: Select the line style
-
Width Of Line: Set line thickness
-
Custom Color Lines (Bearish Harmonic): Define color for bearish pattern lines
-
Custom Color Lines (Bullish Harmonic): Define color for bullish pattern lines
-
Custom Color Of Text: Set color for on-chart text annotations
Conclusion
The Classic Cypher Harmonic Pattern Indicator is an advanced analytical tool that leverages Fibonacci ratios to pinpoint key reversal zones in the market. It is particularly effective in consolidating or low-volatility conditions, helping traders identify trade entry opportunities with greater precision.
