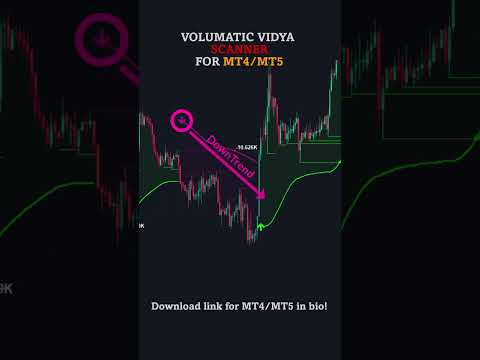
Volumatic VIDyA MT4

4.5
Special offer: ALL TOOLS, just $35 each!

New tools will be $30 for the first week or the first 3 purchases

Trading Tools Channel on MQL5: Join my MQL5 channel to update the latest news from me

Volumatic VIDYA (Variable Index Dynamic Average)は、トレンドを追跡し、トレンドの各フェーズ内での買い圧力と売り圧力を分析するために設計された高度なインジケーターです。可変インデックス動的平均 (Variable Index Dynamic Average) をコアの動的平滑化技術として利用することで、このツールは、価格とボリュームのダイナミクスに関する重要な洞察を、市場構造の重要なレベルで提供します。

MT5バージョンを見る: Volumatic VIDyA MT5

他の製品を見る: 全製品

To use iCustom for EA, please see here: Create EA (iCustom) with VOLUMATIC VIDYA
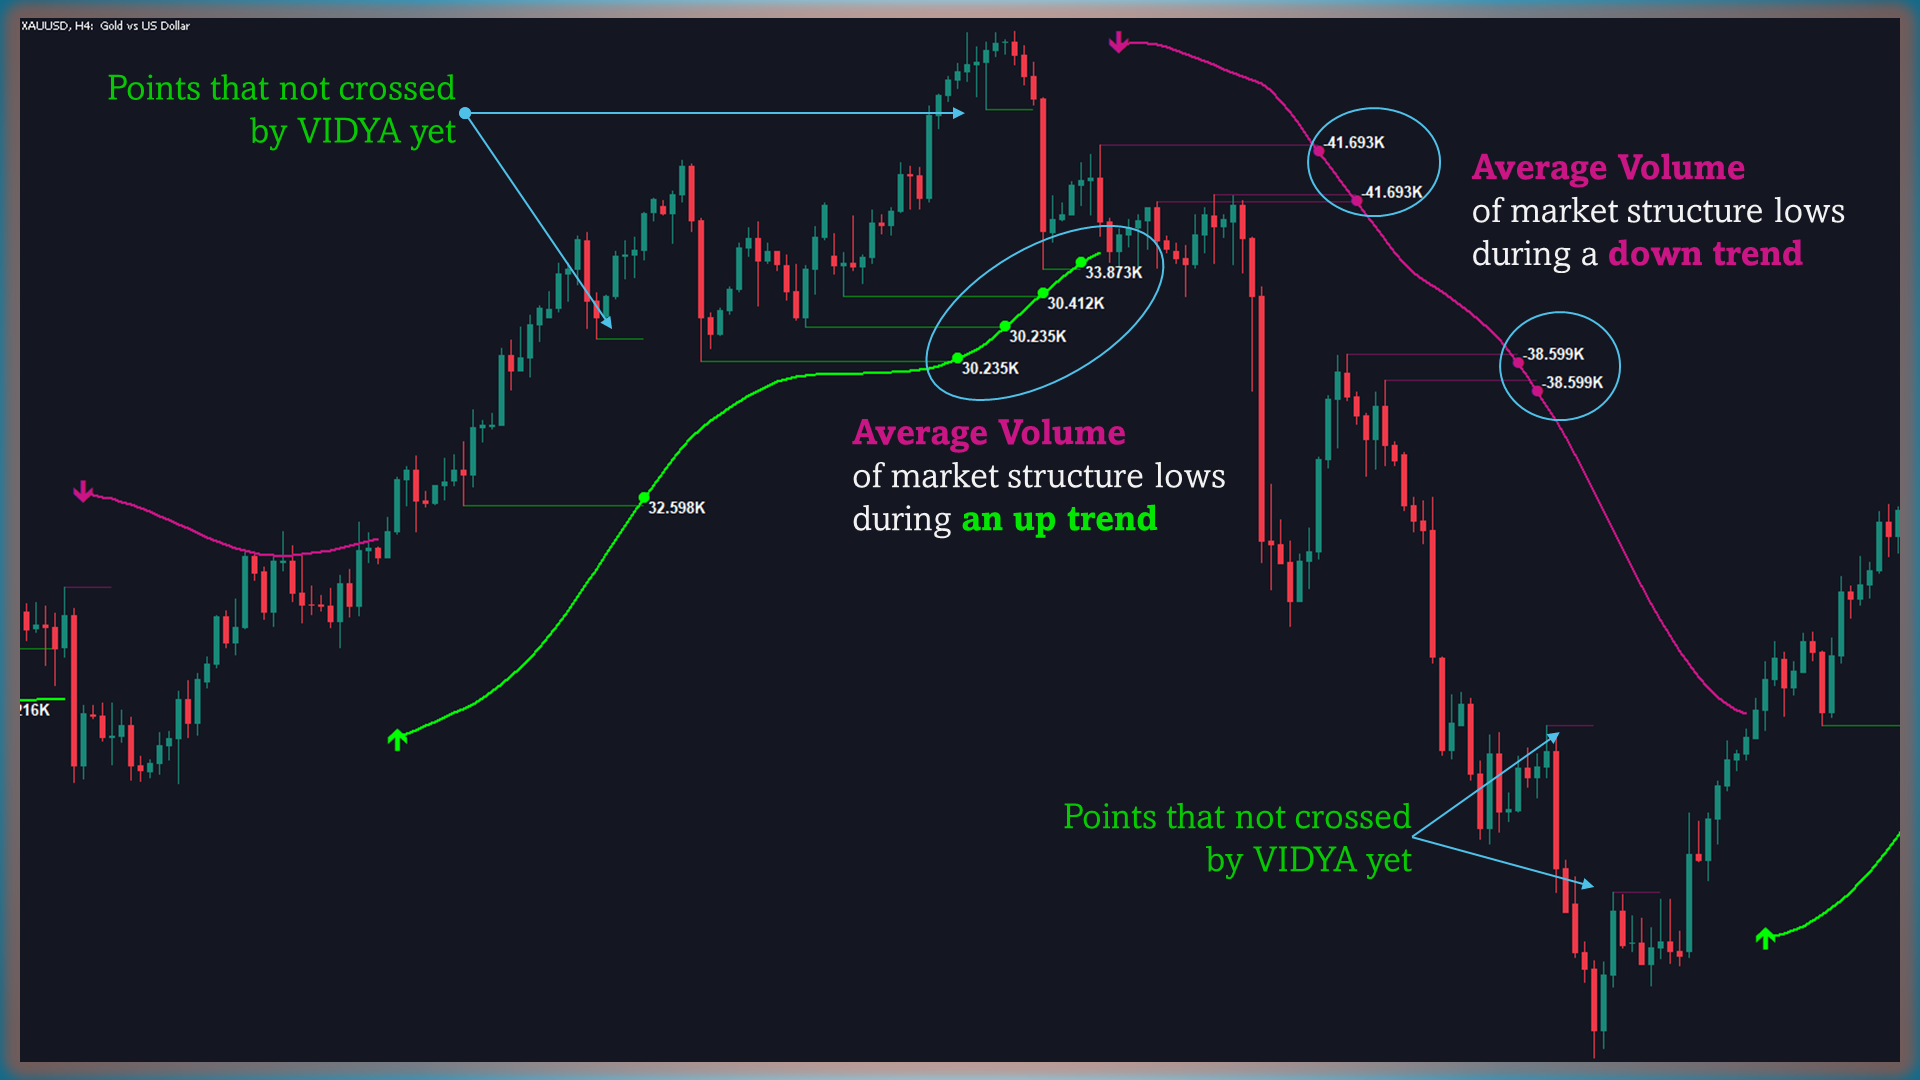
基本コンセプト

Volumatic VIDYAは、トレンドを特定し、それを動かすボリューム圧力を分析する際に優れた性能を発揮します。VIDYAラインは、価格変動の強度に動的に適応し、SMAやEMAなどの従来の移動平均線よりも応答性が高く、正確です。

トレンド検出に加えて、Volumatic VIDYAは買い圧力と売り圧力を計算して視覚化し、市場参加に関する包括的な視点を提供します。市場構造のピボットポイントから描かれた水平線は、ボリュームデータを活用して、主要なサポートとレジスタンスレベルを強調します。

さらに、アラート機能により、トレーダーは重要な市場動向を把握できるため、Volumatic VIDYAは積極的な取引ツールとなります。

主な機能

1. 動的VIDYA計算

VIDYAは、チャンデモメンタムオシレーター (CMO) を使用して、市場のモメンタムとボラティリティに動的に適応します。これにより、以下が可能になります:

  • 迅速に反応: 最小の遅延で市場の急変を捉える。
  • ノイズをフィルタリング: 低ボラティリティ時でも明確なシグナルを提供。
2. 矢印によるトレンド変更シグナル

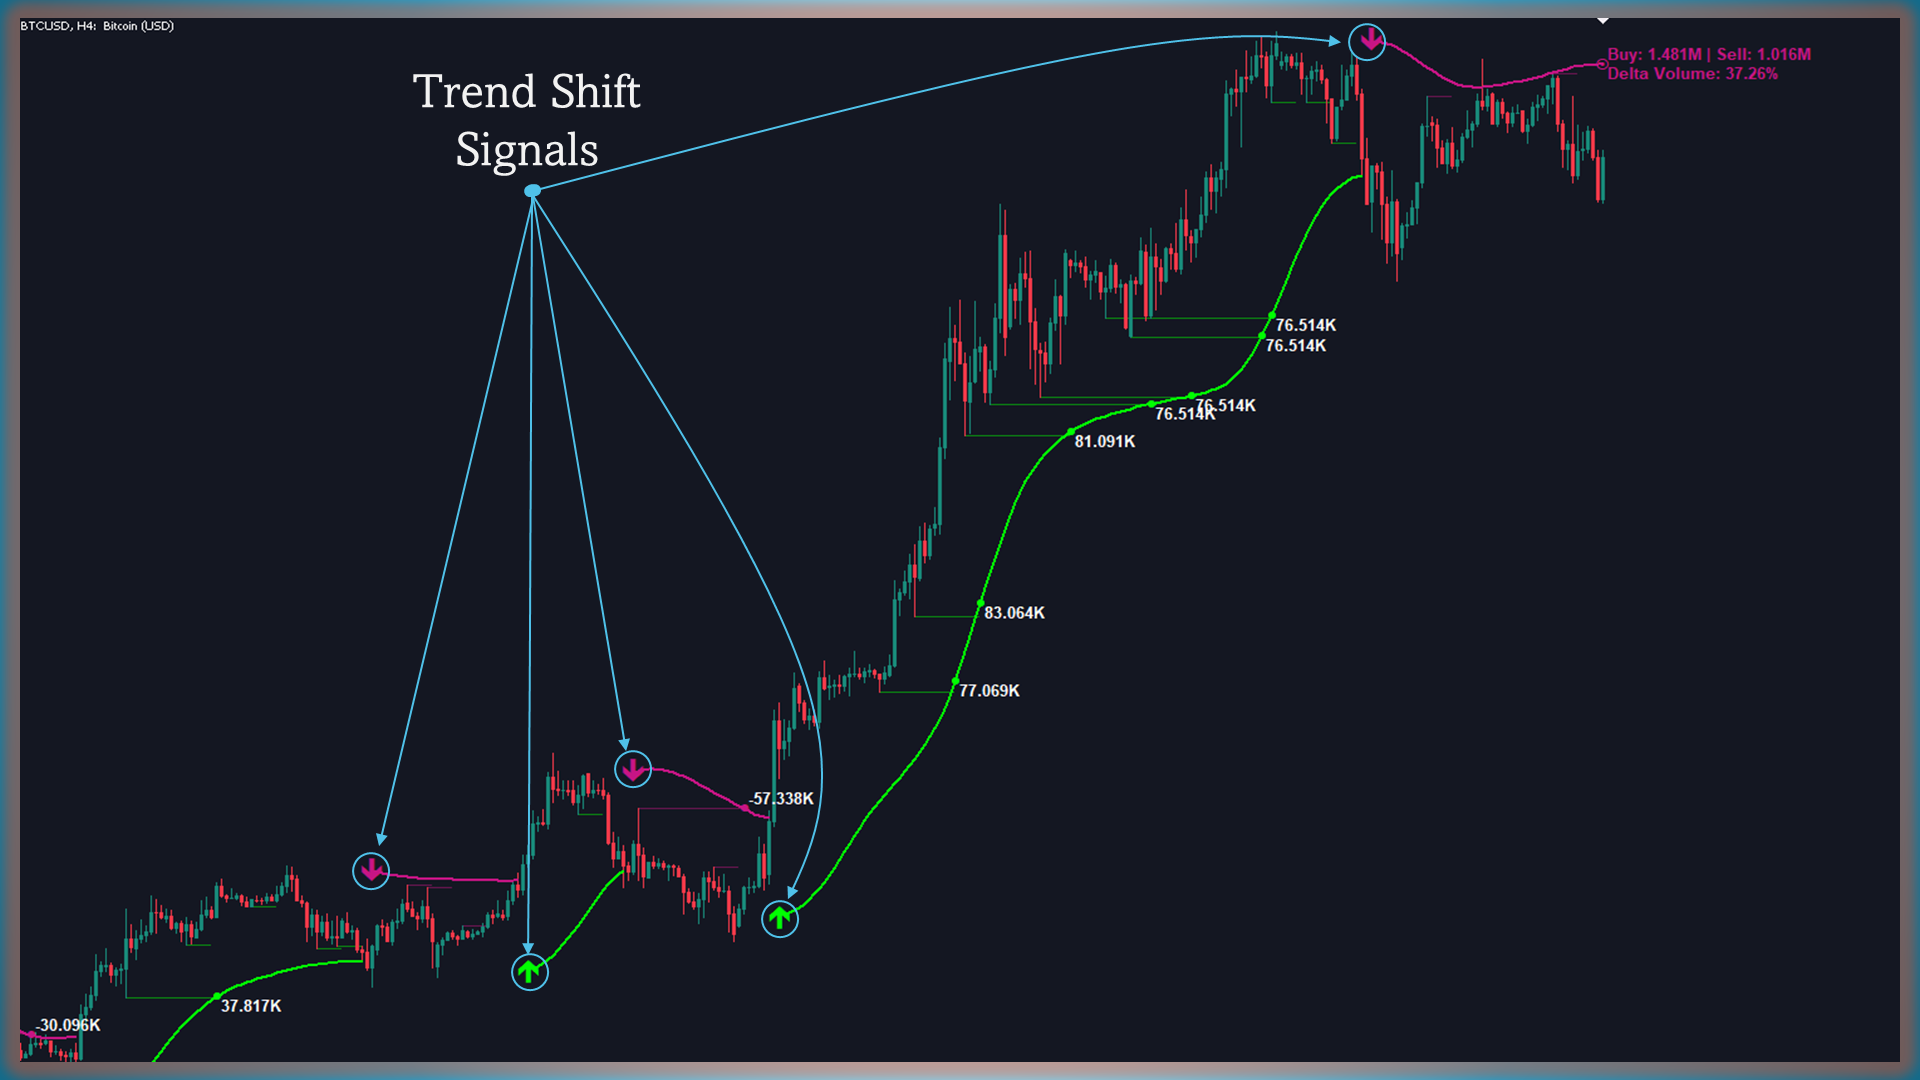
トレンドの反転を示すために、Volumatic VIDYAは直感的な矢印を使用します:

  • 上向きの矢印: 価格がVIDYAラインを上抜けた際に、強気の反転の可能性を示す。
  • 下向きの矢印: 価格がVIDYAラインを下抜けた際に、弱気の変化を示す。

これらのシグナルはトレンド変更アラートによって強化され、これらのイベントが発生するとリアルタイムでトレーダーに通知します。アラートは、画面から離れていてもタイムリーに行動できるようにし、トレーダーがチャンスを捉えたりリスクを軽減したりするのに役立ちます。
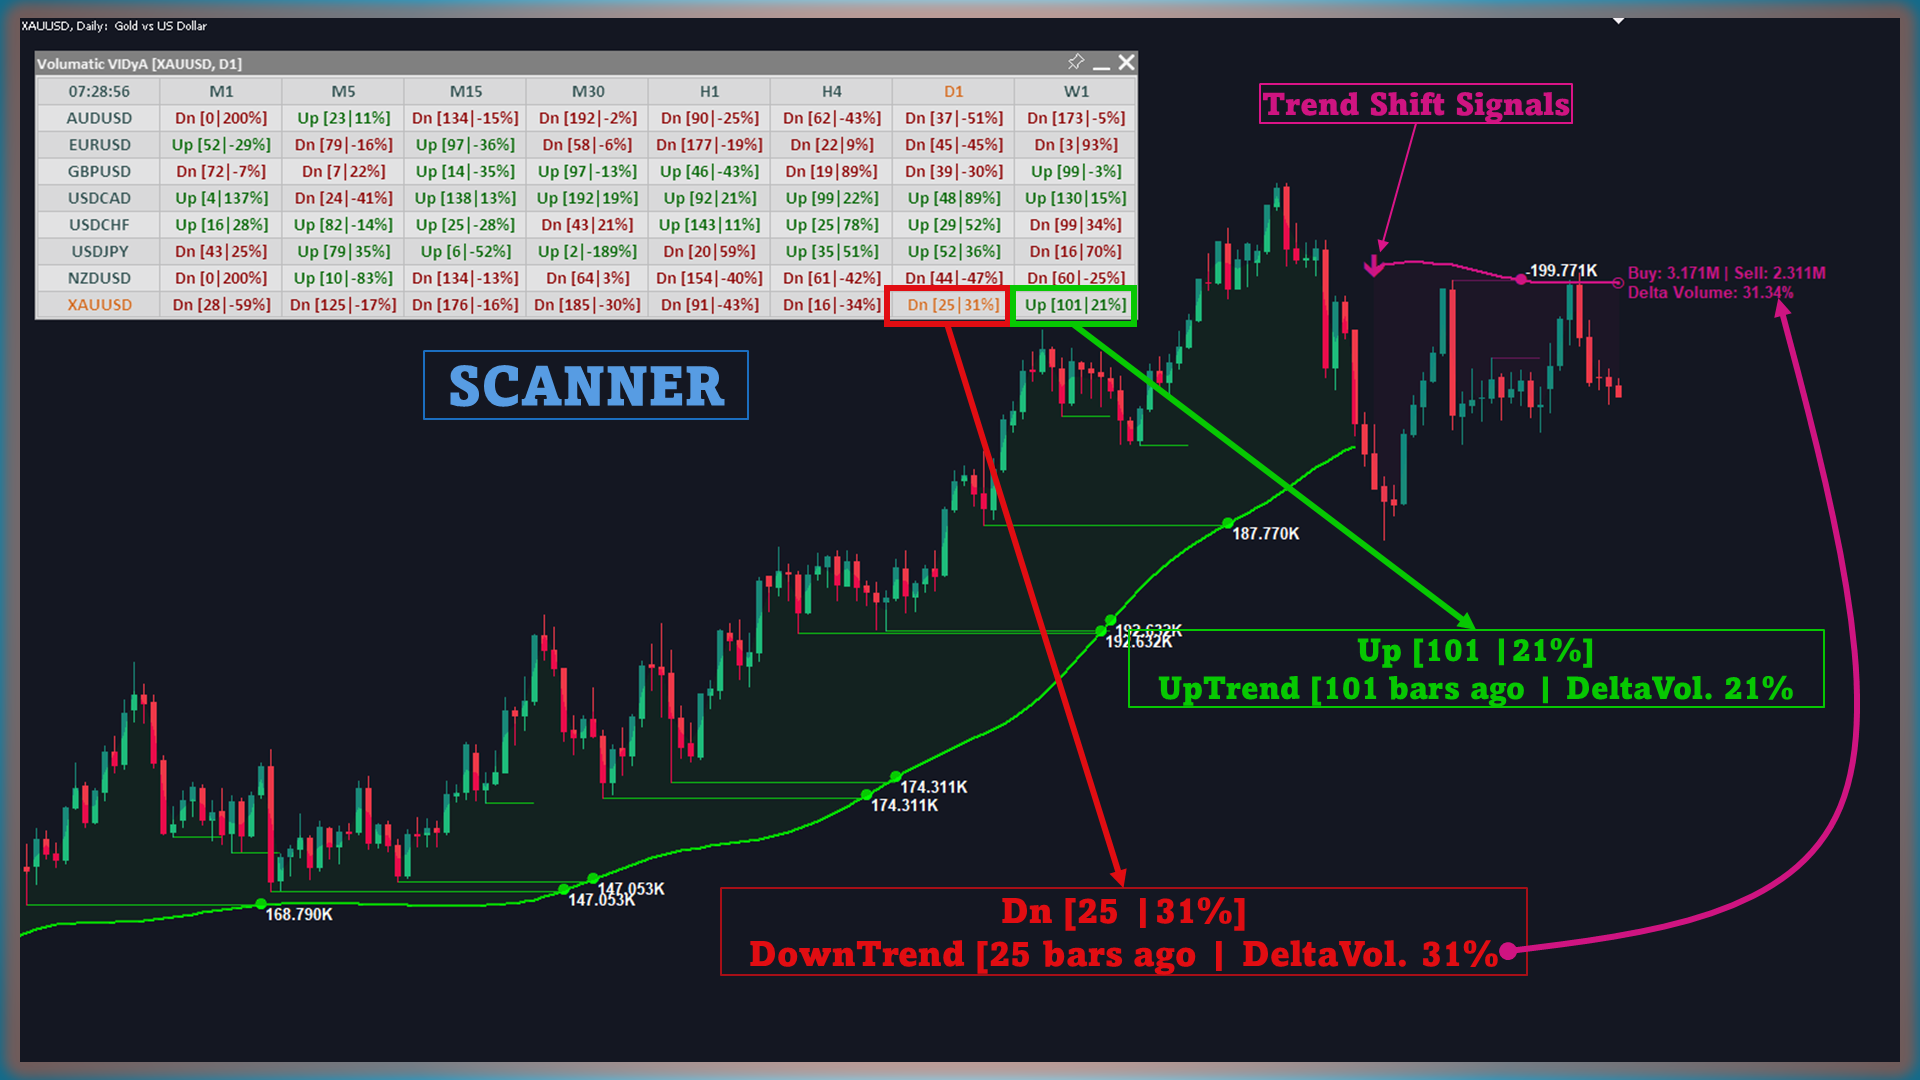
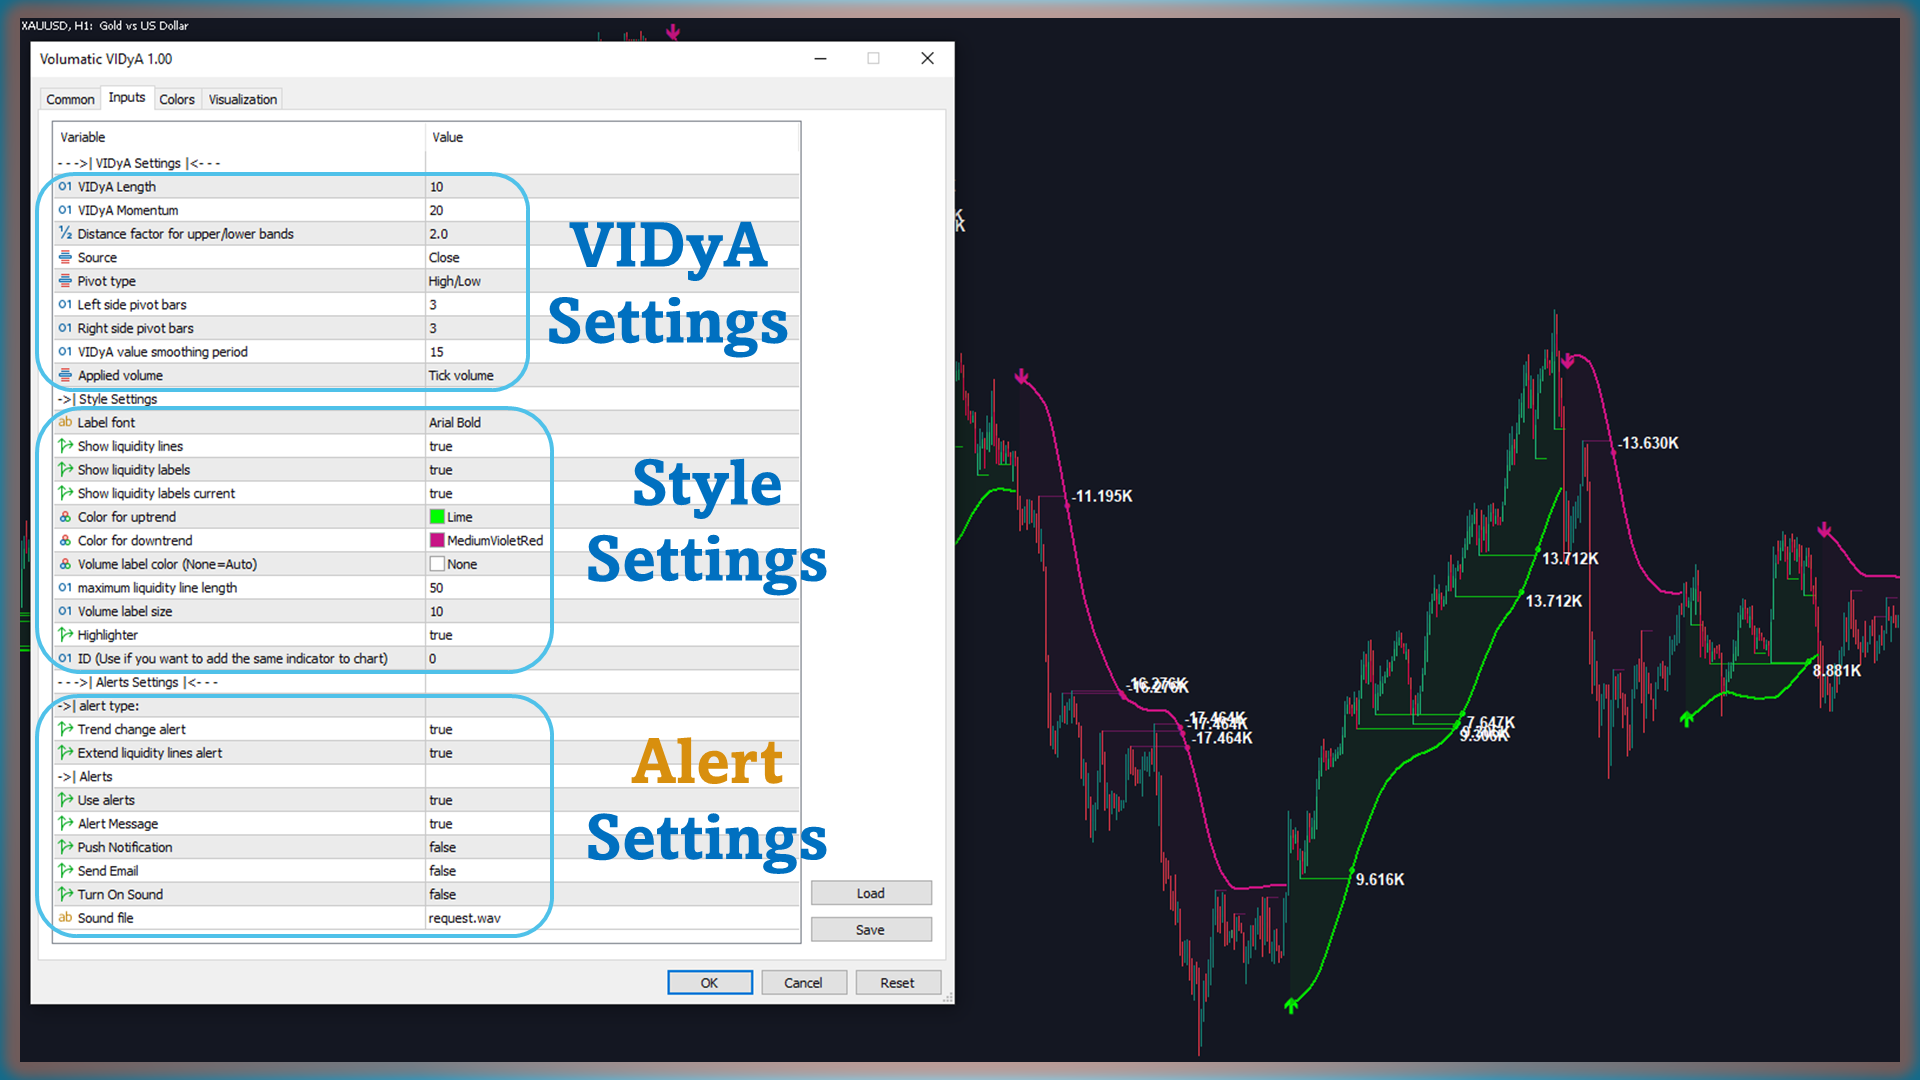
3. ボリュームラベル付きの市場構造ピボットライン

サポートとレジスタンスのレベルは、市場構造のピボットポイントから描かれた水平線で定義されます:

  • 水平流動性ライン: 価格の高値と安値から引かれ、破られるまで延長される。
  • ボリュームラベル: これらのレベルで、直近6本のバーの平均ボリュームを表示し、市場の強さを明確にする。

拡張流動性ラインアラートは、これらの重要なレベルが破られたときにトレーダーに通知します。この機能は、特に以下に役立ちます:

  • 潜在的なブレイクアウトまたはブレイクダウンを特定する。
  • 重要な関心レベル付近での価格動向を予測する。
  • ストップロスまたは利益確定レベルを動的に調整する。
4. 主要な市場イベントのアラート

Volumatic VIDYAは、効率的な取引を向上させるために、強力なアラートシステムを統合しています:

  • トレンド変更アラート: 価格がVIDYAラインを横切るとトリガーされ、強気または弱気の反転の可能性を示します。
  • 拡張流動性ラインアラート: 価格が重要なピボットレベルを上回るまたは下回るときに通知し、潜在的なブレイクアウトやブレイクダウンのシナリオを示します。

これらのアラートはカスタマイズ可能で、メール、プッシュ通知、または音声で通知されるため、チャートを常時監視する必要がなくても状況を把握できます。

カスタマイズオプション

Volumatic VIDYAは、さまざまな取引スタイルに適合するオプションを提供し、高い柔軟性を備えています:

  • VIDYA設定: トレンドの応答性を個別に調整するために、長さやモメンタムを調整します。
  • ピボット検出感度: ピボットポイントを計算するために使用されるバーの数を定義します。
  • アラートの優先設定: 不必要な干渉を減らすために、特定の市場イベントに焦点を合わせるよう通知を調整します。
Volumatic VIDYAを効果的に使用する方法
  1. トレンドを監視: VIDYAラインを使用して市場の方向を追跡し、戦略を調整します。
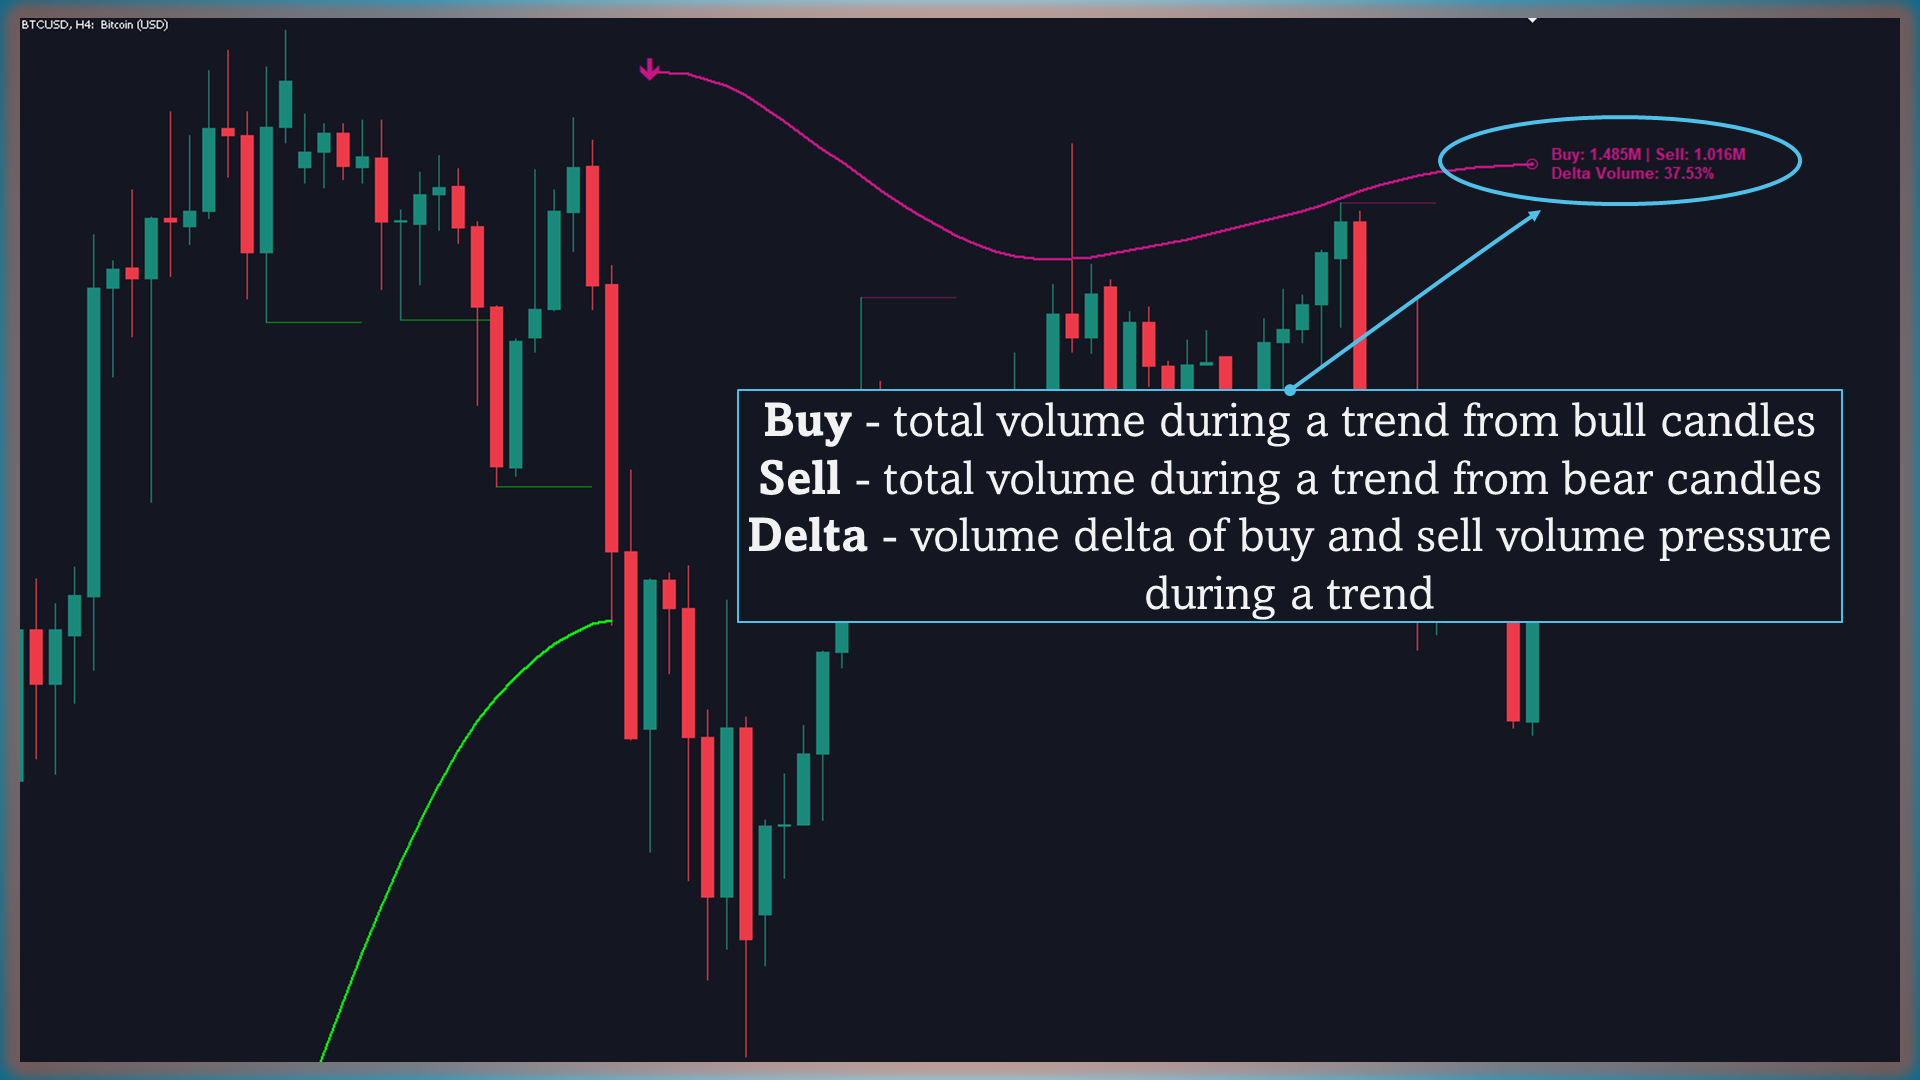
  2. ボリューム圧力を分析: トレンドの強さを確認したり、反転を特定するためにデルタボリュームを活用します。
  3. 流動性ラインを中心に計画: ピボットレベルと関連するアラートを使用して、ブレイクアウトやサポート領域を特定します。
  4. アラートを有効化: 監視を自動化して時間を節約し、重要な変化について最新情報を得ます。
なぜVolumatic VIDYAを選ぶべきか?

動的なトレンド追跡、ボリューム分析、積極的なアラートを組み合わせることで、Volumatic VIDYAは包括的な取引ツールとして際立っています。スキャルピング、スイングトレード、または長期保有のいずれであっても、このインジケーターは次のものを提供します:

  • 動的適応性: 変動の多い市場で効果的にトレンドを捉える。
  • ボリュームインサイト: 価格変動に文脈を追加し、より良い意思決定を可能にします。
  • リアルタイムアラート: チャートを常時監視しなくても重要なイベントを把握できます。

Volumatic VIDYAを使って市場をリードしましょう! トレンド、ボリューム、積極的な取引を習得する究極のパートナーです。


レビュー 4
jabautista
3986
jabautista 2025.03.24 19:48 
 

Solid indicator. Developer is very open suggestions and has great customer service!

Nikodem Dobrzynski
278
Nikodem Dobrzynski 2025.01.24 18:22 
 

Volumatic VIDyA is a very useful indicator that combines both trend and volume indications. When combined with other technical analysis indicators, it can be a great tool in your strategy. Niko.

XANKEEZ
788
XANKEEZ 2025.01.03 09:42 
 

VIDYA is a unique indicator that combines trend and volume analysis. for best results, use it with other indicators like RSI or ADX. the author keeps updating and making it better each time.

おすすめのプロダクト
Special offer : ALL TOOLS , just $35 each! New tools   will be   $30   for the   first week   or the   first 3 purchases !  Trading Tools Channel on MQL5 : Join my MQL5 channel to update the latest news from me トレンドレベル (Trend Levels) インジケーターは、相場の動きにおける重要なトレンドレベル(高値、中値、安値)を特定するために綿密に作られています。カスタマイズ可能な過去期間の最高値、最安値、および中値に基づくリアルタイム計算により、トレーダーにトレンドの動向と強さについて構造化された視点を提供し、精密かつ情報に基づいた取引判断を支援します。 MT5バージョンはこちら:   Trend Levels MT5 他の製品を見るには:   全製品 トレンドレベルインジケーターの主な特徴と使用方法 トレンド変化シグナル インジケーターは、選択した入力期間内の最高値と
スペシャルオファー : ALL TOOLS 、1つあたり $35 のみ! New tools   will be   $30   for the   first week   or the   first 3 purchases !  Trading Tools Channel on MQL5 : Join my MQL5 channel to update the latest news from me ボラティリティの高いトレード環境では、パワフルで直感的な分析ツールがあれば、チャンスを素早く捉えることができます。Fibonacci Trend Scanner は従来のFibonacciインジケーター機能とSuperTrendを統合しただけでなく、通貨ペアのスキャン、マルチタイムフレームのモニタリング、そしてトレンドが強気から弱気へ(またはその逆)転換する際にインテリジェントアラートを出す機能など、機能を拡張しています。 See more MT5 version at:   Fibonacci Trend MT5 Scanner See more products at:   A
Fibonacci Progression with Breaks Indicator MT4 Fibonacci Progression with Breaks Indicator MT4 interprets market price shifts incrementally, following the principles of the Fibonacci sequence. This technical indicator initiates from a key pivot and plots Fibonacci-based price zones aligned with the prevailing trend direction. Additionally, it highlights trade opportunities by displaying green and red arrows to indicate potential buy or sell setups. «Indicator Installation & User Guide» MT4 Indi
FREE
Special offer : ALL TOOLS , just $35 each! New tools   will be   $30   for the   first week   or the   first 3 purchases !  Trading Tools Channel on MQL5 : Join my MQL5 channel to update the latest news from me SMC は、流動性ゾーン、機関注文の配置、そして市場の主要な転換点を特定するためのトレーディングアプローチです。SMCの原則を活用することで、トレーダーは市場をより効果的にナビゲートし、最適なエントリーとエグジットを見つけることができます。 SMC System  インジケーターはこれらの概念を自動化し、以下のような重要なプライスアクション要素でチャートをすばやくマークすることを可能にします: リアルタイムの市場構造  (内部構造およびスイング構造のBOS / CHoCH) オーダーブロック  (強気および弱気) プレミアムゾーンとディスカウントゾーン イコールハイとイ
Classic Bat Harmonic Pattern Indicator for MT4 The Classic Bat Harmonic Pattern Indicator is one of the most well-known harmonic patterns in technical analysis. Formed based on precise Fibonacci ratios, this pattern signals a strong price correction. This MT4 candlestick-based indicator displays bullish Bat patterns in pink and bearish Bat patterns in blue. It helps traders identify optimal entry and exit points. «Indicator Installation & User Guide» MT4 Indicator Installation  | Classic Bat H
FREE
Nen Star Harmonic Pattern Indicator for MetaTrader 4 The Nen Star Harmonic Pattern Indicator is an advanced tool in technical analysis that relies on Fibonacci ratios to identify potential price reversal zones. This pattern is used by traders to spot precise turning points in the market. The structure consists of five key points: X, A, B, C, and D, and can appear in both bullish and bearish trends. In bullish formations, it resembles the letter "M", while in bearish setups, the pattern forms a
FREE
Overview Harmonic Patterns MT4 is a technical analysis indicator designed for the MetaTrader 5 platform. It identifies and displays harmonic price patterns, such as Butterfly, Cypher, Crab, Bat, Shark, and Gartley, in both bullish and bearish directions. The indicator calculates key price levels, including entry, stop loss, and three take-profit levels, to assist traders in analyzing market movements. Visual elements and customizable alerts enhance usability on the chart. Features Detects six ha
Leonardo Harmonic Pattern Indicator MetaTrader 4 The Leonardo Harmonic Pattern Indicator is recognized as one of the most accurate tools for identifying price reversal zones using Fibonacci ratios in technical analysis. Designed for MetaTrader 4, this classic chart pattern indicator is similar to the Bat Pattern but differs significantly in its Fibonacci levels. By clearly identifying the XA to CD wave sequences, traders can pinpoint precise entry or exit points. Key Fibonacci levels like 50%,
FREE
Special offer : ALL TOOLS , just $35 each! New tools   will be   $30   for the   first week   or the   first 3 purchases !  Trading Tools Channel on MQL5 : Join my MQL5 channel to update the latest news from me 概要 OA SnR Powerは、サポートおよびレジスタンスレベルの強度を識別して評価するために設計された強力なツールです。取引量、反発頻度、再テスト回数などの重要な要素を組み込むことで、このインジケーターは市場の重要な価格ゾーンを包括的に可視化します。 その他の製品を見る:   すべての 製品 OA SnR Powerの仕組み 高値と安値の特定 このインジケーターは、ローカル高値と安値を計算するための高度なアルゴリズムを使用します。 ユーザーはゾーン幅の設定を調整でき、サポートおよびレジスタンスの潜在的なレベルを正確に検出します。 主要レベルのフィルタリングと統合
FREE
Voenix
Lorentzos Roussos
4.58 (12)
高調波パターン スキャナーとトレーダー。いくつかのチャートパターンも 含まれているパターン: ABCDパターン ガートレーパターン バットパターン 暗号パターン 3ドライブパターン ブラックスワンパターン ホワイトスワンパターン カジモドパターンまたはオーバーアンダーパターン Altバットパターン 蝶のパターン 深いカニ柄 カニ柄 サメ柄 FiveOパターン 頭と肩のパターン 昇順の三角形のパターン ワンツースリーパターン そして8つのカスタムパターン Voenixは、マルチタイムフレームおよびマルチペアのハーモニックパターンスキャナーであり、25のチャートおよびフィボナッチパターンをサポートします。カスタムブロック光学アルゴリズムを利用し、再描画なしで、確認ステップに依存せずに可能なパターンを迅速に発見できます(ジグザグ計算とは異なります)。 )。 選択したパターンを自動的に交換したり、通知を送信したり、テーブルに収集して簡単にアクセスして評価したりできます。 取引には最大3つの利益目標があり、各目標で成約された注文のパーセンテージに関して分散があります。 簡単なステップトレーリン
Fibonacci calculator is used with Elliot Waves, it can generate remarkable results. A trader could use these levels or ratios to find high probability trades with very small stop loss. You may also use these ratios to find Elliott Waves extensions and to book profit near those levels. For Elliot Wave experts, Fibonacci calculator is a highly useful tool that can assist them in calculating Fibonacci extension and retracement levels for the market price. The indicator proves itself as a useful one
Fibonacci SR Indicator This indicator creates support and resistance lines. This indicator is based on Fibonacci Retracement and Extension levels. It will consider many combinations of the Fibonacci levels and draw support/resistance lines based on these. This indicator uses tops and bottoms drawn by the ZigZag indicator in its calculations. The ZigZag can also be drawn on the chart, if necessary. The indicator considers many combinations of past reversal points and Fibonacci ratio levels, and w
FREE
Ratio market
Aleksandr Krokhalev
4.33 (15)
Volatility under control. The indicator shows the optimal depth for setting goals within the day and on the average trend. It also builds pivot zones for the estimated correction depth. As an accompaniment, the key levels of the structure are displayed for several timeframes. Classical volatility indicators ATR & ADX on fixed timeframes are used for calculation. The calculation takes into account the spread, and if the market is slightly volatile, you will see a warning about the risk. You can c
FREE
NO REPAINT ADVANCED CHART PATTERN INDICATOR By definition, a price ( chart)  pattern is a recognizable configuration of price movement that is identified using a series of  trendlines  and/or curves. When a price pattern signals a change in trend direction, it is known as a reversal pattern; a continuation pattern occurs when the trend continues in its existing direction following a brief pause. Advanced Chart Pattern Tracker is designed to find the MOST ACCURATE patterns. A special script is a
This indicators automatically draws the Support and resistances levels for you once you've dropped it on a chart.  It reduces the hustle of drawing and redrawing these levels every time you analysis prices on a chart. With it, all you have to do is dropped it on a chart, adjust the settings to your liking and let the indicator do the rest.  But wait, it gets better; the indicator is absolutely free!  Get the new and improved version here:  https://youtu.be/rTxbPOBu3nY Parameters Time-frame  -> T
FREE
Introduction to X3 Chart Pattern Scanner X3 Cherart Pattern Scanner is the non-repainting and non-lagging indicator detecting X3 chart patterns including Harmonic pattern, Elliott Wave pattern, X3 patterns, and Japanese Candlestick patterns. Historical patterns match with signal patterns. Hence, you can readily develop the solid trading strategy in your chart. More importantly, this superb pattern scanner can detect the optimal pattern of its kind. In addition, you can switch on and off individu
Special offer : ALL TOOLS , just $35 each! New tools   will be   $30   for the   first week   or the   first 3 purchases !  Trading Tools Channel on MQL5 : Join my MQL5 channel to update the latest news from me Follow Line とスキャナーを使って、ボラティリティに基づいた高度なインジケーターでトレーディングエッジを最大限に活用しましょう。このツールは、カスタマイズ可能な設定とともに、ボリンジャーバンドの力を組み合わせ、価格の動きについて正確な洞察を提供します。 See more MT5 version at:   Follow Line MT5 with Scanner See more products at:   https://www.mql5.com/en/users/ndhsfy/seller Follow Line の鍵は、価格が 1 標準偏差に設定された
FREE
Introduction Harmonic Patterns are best used to predict potential turning point. Traditionally, Harmonic Pattern was identified manually connecting peaks and troughs points in the chart. Manual harmonic pattern detection is painfully tedious and not suitable for everyone. You are often exposed under subjective pattern identification with manual pattern detection. To avoid these limitations, Harmonic Pattern Plus was designed to automate your harmonic pattern detection process. The functionality
This indicator filters the Zigzag indicator to calculate the main support and resistance levels. Variables minimum gap between peaks : is the distance (GAP) between the peaks of the Zigzag peaks sensitivity : Minimum number of nearby peaks look back: it means that it has to test the last 50 peaks in the Zigzag object name perfix: a prefix for level’s line name on chart
FREE
Auto Fibonacci Retracement Indicator — Flexible and Reliable This is not just another Auto Fibonacci Retracement indicator — it’s one of the most flexible and dependable tools available . If you find it useful, please leave a review or comment to support the project. Check out my other helpful tools below: Timeframes Trend Scanner    - Scan the trend of assets in difference timeframes with multiple indicators Market Trend Scanner   - Scan the trend of multiple-assets in with multiple indicators
FREE
Description: The indicator measures, through the zigzag indicator, the levels of trend or correction. It shows in the chart the levels of each low or high detected. KEY LINKS:   How to Install  –  Frequent Questions  -  All Products  How is this indicator useful? This indicator determines, depending on Zigzag parameter if a trend is beginning, developing, or ending This indicator determines the direction of the trend Components Levels as positive or negative numbers, depending on the direction
FREE
ATR Trailing Stop TSL Indicator MT4 The ATR Trailing Stop Indicator (ATR TSL) is a practical solution for risk management in MetaTrader 4. It generates a dynamic stop-loss level based on the market’s Average True Range (ATR), automatically adapting to price volatility. As market conditions shift, the ATR Trailing Stop continuously adjusts stop-loss levels in the direction of the trade. In an uptrend, the stop-loss is displayed in green, while in a downtrend, it is shown in red, visually distingu
FREE
このインジケーターは、手動および自動的な方法で描かれる調和パターンを検出します。 ご自身のレビューを追加してください。 注意事項: インジケーターにはコントロールパネルがあり、各(チャートとタイムフレーム)の設定を保存します。スペースを確保するために最小化することができ、他の分析ツールと一緒に作業する際にインジケーターデータをすべて非表示にするために閉じるボタンを押すこともできます。 このインジケーターを使用して設定を変更し、移動平均線やボリンジャーバンドなどのインジケーターを追加する場合、このインジケーターは自動的に編集したテンプレートを保存し、必要なときにロードすることができます。 Windows 10を使用している場合は、MetaTraderアイコンを右クリックして > 互換性 > 高DPI設定の変更 > システム(強化)を選択して、最適な画面設定にしてください(これはHDデバイスで行う必要があります)。 このインジケーターは、チャート上で調和トレーディング理論を解釈したもので、チャート上の調和パターンを検出します。詳しく学びたい場合は、Scott Carneyの「ハーモニックト
Read Elliott wave principle automatically. With the Swing Reader, you can easily read the Elliott Wave Principle through an automatic system. With swing, we mean a ZigZag market that is created by a breakout of its standard deviation. You can set the deviation manually, or you can let the indicator do it automatically (setting the deviation to zero). Advantages you get Never repaints. Points showing a horizontal line, in which statistically a long wave ends. Candles showing a vertical line in
Auto Andrews Pitchfork indicator MT4 The Auto Andrews Pitchfork indicator MT4 is a technical analysis utility developed for MetaTrader 4 that identifies dynamic support and resistance zones based on price swings. This tool integrates well with MACD and determines three recent pivot points to draw a trio of parallel lines forming a pitchfork shape. The central median line of the pitchfork is a crucial level—acting as either a potential reversal points or confirming a trend continuation when breac
FREE
All Harmonic Patterns Scanner for MT4 The All Harmonic Patterns Scanner for MT4 is a comprehensive tool developed to detect and illustrate a wide range of harmonic chart patterns on the MetaTrader 4 trading terminal. This indicator evaluates pivot formations and price movement behavior to automatically map out formations such as the Gartley, Bat, Butterfly, along with numerous standard and nonstandard harmonic setups on the chart. Beyond the traditional patterns, the scanner is also capable of i
Special offer : ALL TOOLS , just $35 each! New tools   will be   $30   for the   first week   or the   first 3 purchases !  Trading Tools Channel on MQL5 : Join my MQL5 channel to update the latest news from me Trendlines with Breaks Scanner は、トレーダーが重要なトレンドを特定し、リアルタイムでブレイクアウトを検出するのを支援するために設計された最先端の取引ツールです。ピボットポイントに基づいて自動生成されたトレンドラインを使用することで、このインジケーターはトレーダーが精度と自信を持って取引の機会を活用できるようにします。 MT5バージョンを見る:  Trendlines with Breaks Scanner MT5 他の製品を見る:   All Products 主な機能 1. リアルタイムのブレイクアウト検出 ブレイクアウトアラート: 価
This indicator Super Channel Pro indicator.Indicator displays trend movement. Indicator calculates automatically line. Features FiltPer - displays indicator channel period. deviation - displays indicator channel deviation. deviation2 - displays indicator channel deviation. How to understand the status: If the arrow is green, trend is up. If the arrow is red, trend is down. ///////////////////////////////////////////////////////////////////////////////////////////////////////////////////////////
Special offer : ALL TOOLS , just $35 each! New tools   will be   $30   for the   first week   or the   first 3 purchases !  Trading Tools Channel on MQL5 : Join my MQL5 channel to update the latest news from me Liquidity Pools インジケーターは、チャート上の潜在的な流動性ゾーンを、高頻度でウィックが触れる高安領域と、それぞれのゾーンでの再訪回数および取引量を分析することによって特定し、マークする高度なツールです。このツールは、流動性が集積される市場のダイナミクスをトレーダーに提供し、潜在的な転換点を予測し、重要なサポートおよびレジスタンスレベルを特定するのに役立ちます。 MT5バージョンはこちら:   Liquidity Pools MT5 他の製品はこちら:   全製品 主な機能と利点 1. 正確な流動性ゾーンの特定 高影響ゾーンのハイライト: Liquidi
Parabolic SAR Color Alert Indicator MT4 The Parabolic SAR Color Alert Indicator MT4 applies dynamic-colored dots to visually represent the direction of the market trend. In this indicator, the dots appear either above or beneath the candlesticks to signal momentum shifts. Specifically, blue dots below the candles highlight bullish movement, while pink dots above the candles confirm bearish momentum. «Indicator Installation & User Guide» MT4 Indicator Installation  |  Parabolic SAR Color Alert In
FREE
このプロダクトを購入した人は以下も購入しています
Trend indicator AI
Ramil Minniakhmetov
5 (55)
Trend Ai indicatorは、トレンドの識別と実用的なエントリポイントと反転アラートを組み合わせることで、トレーダーの市場分析を強化する優れたツールです。 この指標は、ユーザーが自信と正確さで外国為替市場の複雑さをナビゲートすることを可能にします トレンドAiインジケーターは、主要なシグナル以外にも、プルバックやリトレースメント中に発生するセカンダリエントリポイントを識別し、トレーダーが確立されたトレンド内の価格修正を活用できるようにします。 重要な利点: *MT4およびMT5の仕事 *明確な買いまたは売りシグナル *再描画しません ·すべての資産で動作します 私はeaやセットをtelegram it詐欺で販売しないように注意してください。 すべての設定はここでブログで無料です。  重要! 指示とボーナスを得るために購入後すぐに私に連絡してください! 私の他のプロダクトと同様、実質操作の監視はここに見つけることができます: https://www.mql5.com/en/users/mechanic/seller&nbsp ; 設定および入力: すべての
M1 Sniper
Oleg Rodin
4.73 (15)
M1 SNIPER は使いやすいトレーディングインジケーターシステムです。M1時間足向けに設計された矢印インジケーターです。M1時間足でのスキャルピングのためのスタンドアロンシステムとして、また既存のトレーディングシステムの一部としても使用できます。このトレーディングシステムはM1時間足での取引に特化して設計されていますが、他の時間足でも使用できます。元々、この手法はXAUUSDとBTCUSDの取引用に設計しましたが、他の市場においても役立つと考えています。 インジケーターのシグナルは、トレンドの方向と逆方向に取引できます。インジケーターのシグナルを利用して両方向に取引するのに役立つ特別な取引テクニックをご紹介します。この手法は、特別な動的なサポートとレジスタンスの価格帯を利用することに基づいています。 ご購入後、M1 SNIPER矢印インジケーターをすぐにダウンロードできます。さらに、M1 SNIPERツールのすべてのユーザーに、以下のスクリーンショットに表示されているApollo Dynamic SRインジケーターを無料で提供しています。この2つのインジケーターを組み合わせることで
To celebrate the official release, $65 is the new PROMO price for the first 50 copies (2 left)! After that, the price increases to $120. SMC Easy Signal was built to remove the confusion around the smart money concept by turning structural shifts like BOS (Break of Structure) and CHoCH (Change of Character) into simple buy and sell trading signals. It simplifies market structure trading by automatically identifying breakouts and reversals as they happen, allowing traders to focus on execution
Gann Made Easy は、ミスター・ギャンの理論を使用した取引の最良の原則に基づいた、プロフェッショナルで使いやすい外国為替取引システムです。 W・D・ガン。このインジケーターは、ストップロスとテイクプロフィットレベルを含む正確な買いと売りのシグナルを提供します。 PUSH通知を利用して外出先でも取引可能です。 購入後はご連絡ください!私の取引のヒントと素晴らしいボーナスインジケーターを無料で共有します! おそらく、ギャンの取引手法についてはすでに何度も聞いたことがあるでしょう。通常、ギャンの理論は初心者のトレーダーだけでなく、すでにある程度の取引経験がある人にとっても非常に複雑なものです。なぜなら、ギャンの取引手法は理論的にはそれほど簡単に適用できるものではないからです。私はその知識を磨き、最良の原則を私の外国為替インジケーターに組み込むために数年を費やしました。 このインジケーターは非常に簡単に適用できます。必要なのは、それをチャートに添付し、簡単な取引推奨事項に従うだけです。このインジケーターは常に市場分析の仕事を行い、取引の機会を探します。適切なエントリーポイントを検出
An exclusive indicator that utilizes an innovative algorithm to swiftly and accurately determine the market trend. The indicator automatically calculates opening, closing, and profit levels, providing detailed trading statistics. With these features, you can choose the most appropriate trading instrument for the current market conditions. Additionally, you can easily integrate your own arrow indicators into Scalper Inside Pro to quickly evaluate their statistics and profitability. Scalper Inside
Dynamic Forex28 Navigator - 次世代の Forex 取引ツール。 現在 49% オフ。 Dynamic Forex28 Navigator は、長年人気のインジケーターを進化させたもので、3 つの機能を 1 つにまとめています。 Advanced Currency Strength28 インジケーター (レビュー 695 件)  + Advanced Currency IMPULSE with ALERT (レビュー 520 件) + CS28 コンボ シグナル (ボーナス)。 インジケーターの詳細 https://www.mql5.com/en/blogs/post/758844 次世代の Strength インジケーターが提供するもの  オリジナルで気に入っていたすべての機能が、新機能と精度の向上によって強化されました。 主な機能: 独自の通貨強度計算式。 すべての時間枠でスムーズかつ正確な強度ライン。 トレンドの特定と正確なエントリーに最適です。 ダイナミックマーケットフィボナッチレベル (マーケットフィボナッチ)。 このインジケーターに固有
デイトレーダーマスターは、デイトレーダーのための完全なトレーディングシステムです。システムは2つのインジケーターで構成されています。 1つの指標は売買する矢印信号です。それはあなたが得る矢印インジケーターです。 2つ目のインジケーターを無料で提供します。 2番目のインジケーターは、これらの矢印と組み合わせて使用​​するために特別に設計されたトレンドインジケーターです。 インジケーターは繰り返さず、遅れないでください! このシステムの使用は非常に簡単です。 2色の線で表示されている現在のトレンドの方向に矢印信号をたどる必要があります。青は買いの傾向です。赤い色は売りの傾向です。青い矢印は買いシグナルです。赤い矢印は売りの合図です。トレンドラインの色と一致するように、矢印の色と信号の方向が必要です。 矢印インジケーターは、主に時間間隔M5とM15での日中取引のために作成されました。ただし、技術的には、システムは他の時間間隔で使用できます。 インジケータには、PUSHメッセージ機能を備えたポップアップアラートが装備されています。 購入後、必ず私に書いてください!私はあなたにシステムとの取引の
BUY INDICATOR AND GET NEW EXCLUSIVE EA FOR FREE AS A BONUS! ITALO ARROWS INDICATOR  is the best reversal indicator ever created, and why is that? Using extreme reversal zones on the market to show the arrows and Fibonacci numbers for the Take Profit, also with a panel showing all the information about the signals on the chart, the Indicator works on all time-frames and assets, indicator built after 8 years of experience on forex and many other markets. You know many reversal indicators around t
Trend Screener
STE S.S.COMPANY
4.79 (95)
トレンドインジケーター、1つのツールに組み込まれたすべての重要なトレンド機能を備えたトレンドトレーディングとフィルタリングのための画期的なユニークなソリューション! これは、すべてのシンボル/商品(外国為替、商品、暗号通貨、インデックス、株式)で使用できる100%再描画されていないマルチタイムフレームおよびマルチ通貨インジケーターです。 期間限定オファー: サポートおよびレジスタンス スクリーナー インジケーターは、たった 50 ドルで永久的にご利用いただけます。(元の価格 250 ドル) (オファー延長) トレンドスクリーナーは、チャート内のドットで矢印トレンドシグナルを提供するインジケーターに続く効率的なインジケーターです。 トレンド分析インジケーターで使用できる機能: 1.トレンドスキャナー。 2.最大利益分析を備えたトレンドライン。 3.トレンド通貨強度メーター。 4.アラート付きのトレンド反転ドット。 5.アラート付きの強いトレンドドット。 6.トレンド矢印 毎日の分析例、毎日のシグナルパフォーマンス...など、トレンドスクリーナーインジケーターを使用して、ここで見つけること
現在20%OFF! 初心者やエキスパートトレーダーに最適なソリューションです。 このインディケータは、エキゾチックペア・コモディティ・インデックス・先物など、あらゆるシンボルの通貨の強さを表示することに特化したインディケータです。金、銀、原油、DAX、US30、MXN、TRY、CNHなどの通貨の強さを表示するために、9行目にどのシンボルでも追加することができます。独自の機能を多数搭載し、新しい計算式を採用したため、ユニークで高品質、かつ手頃な価格のトレーディングツールとなっています。新しいトレンドやスキャルピングチャンスのトリガーポイントを正確に把握することができるため、あなたのトレードがどのように改善されるか想像してみてください。 ユーザーマニュアル:ここをクリック   https://www.mql5.com/en/blogs/post/708876 すべての時間枠に対応します。あなたはすぐにトレンドを見ることができるようになります! 新しいアルゴリズムに基づいて設計されているため、潜在的な取引の特定と確認がより簡単になります。これは、8つの主要通貨と1つのシンボルの強弱
素晴らしいバックテスト 、驚異的な数字を伴う ライブ口座実績の証明 、そして あらゆる場所での統計結果 を備えたトレーディングインジケーターを購入したにもかかわらず、使用後に 口座を破綻させてしまった 経験は何度ありますか? シグナルを単独で信用すべきではありません。なぜそのシグナルが最初に現れたのかを知る必要があります。そして、それがRelicusRoad Proが最も得意とすることです! ユーザーマニュアル + 戦略 + トレーニングビデオ + VIPアクセス付きプライベートグループ + モバイル版利用可能 市場を見る新しい方法 RelicusRoadは、FX、先物、暗号通貨、株式、指数向けの「 世界で最も強力で最高の取引インジケーター 」であり、トレーダーが 口座を成長させる ために必要なすべての情報とツールを提供します。「 テクニカル分析 」と「 取引計画 」を提供し、「 初心者 」から「 上級者 」まで、「 すべてのトレーダーの成功 」を支援します。 これは、将来の市場を「 予測 」するのに十分な情報を提供する「 主要な取引インジケーター 」です。意味をなさない複数の異な
Volatility Trend System - a trading system that gives signals for entries. The volatility system gives linear and point signals in the direction of the trend, as well as signals to exit it, without redrawing and delays. The trend indicator monitors the direction of the medium-term trend, shows the direction and its change. The signal indicator is based on changes in volatility and shows market entries. The indicator is equipped with several types of alerts. Can be applied to various trading ins
現在31%オフ! 初心者やエキスパートトレーダーに最適なソリューション! このインジケータは、独自の機能と秘密の数式を組み込んだ、ユニークで高品質かつ手頃な価格のトレーディングツールです。たった1枚のチャートで28の通貨ペアのアラートを表示します。新しいトレンドやスキャルピングチャンスの引き金となるポイントを正確に把握することができるので、あなたのトレードがどのように改善されるか想像してみてください! 新しい基本的なアルゴリズムに基づいて構築されているため、潜在的な取引の特定と確認がより簡単になります。これは、通貨の強さや弱さが加速しているかどうかをグラフィカルに表示し、その加速のスピードを測定するためです。加速すると物事は明らかに速く進みますが、これはFX市場でも同じです。つまり、反対方向に加速している通貨をペアにすれば、利益を生む可能性のある取引を特定することができるのです。 通貨の勢いを示す縦の線と矢印は、あなたの取引の指針となるでしょう。 ダイナミックマーケットフィボナッチ23レベルはアラートトリガーとして使用され、市場の動きに適応します。もしインパルスが黄色のトリガ
これはほぼ間違いなく、MetaTraderプラットフォームで見つけることができる最も完全な調和価格形成自動認識インジケーターです。 19種類のパターンを検出し、フィボナッチプロジェクションをあなたと同じように真剣に受け止め、潜在的逆転ゾーン(PRZ)を表示し、適切なストップロスとテイクプロフィットレベルを見つけます。 [ インストールガイド | 更新ガイド | トラブルシューティング | よくある質問 | すべての製品 ] 19の異なる調和価格形成を検出します プライマリ、派生および補完フィボナッチ投影(PRZ)をプロットします 過去の価格行動を評価し、過去のすべてのパターンを表示します この指標は、独自の品質とパフォーマンスを分析します 適切なストップロスとテイクプロフィットのレベルを表示します ブレイクアウトを使用して適切な取引を通知します すべてのパターン比をグラフにプロットします 電子メール/音声/視覚アラートを実装します スコット・M・カーニーの本に着想を得て、この指標は最も純粋で急を要するトレーダーのニーズを満たすように設計されています。ただし、トレードを容易にする
反転ゾーン - レベル / 主要プレーヤーのアクティブゾーン 説明書(ロシア語)   /   説明書 (英語)   /   バージョン MT5 このインジケーターを購入したすべての   さらに 無料で 入手: 3ヶ月アクセス   サービスからの取引シグナル   スーパーシグナル     — TPSproSYSTEM アルゴリズムに従った既製のエントリ ポイント。 3ヶ月アクセス   定期的に更新されるトレーニング資料 - 戦略と専門的な成長に没頭できます。 平日は24時間365日サポート、非公開のトレーダーチャットへのアクセス(コミュニケーション、サポート、市場状況の分析)。 主な機能: 売り手と買い手のアクティブなゾーンを表示します。 このインジケーターは、買いと売りの適切な最初のインパルスレベル/ゾーンをすべて表示します。これらのレベル/ゾーンがアクティブになると、エントリーポイントの探索が始まり、レベルの色が変わり、特定の色で塗りつぶされます。状況をより直感的に把握できるように、矢印も表示されます。 LOGIC AI - テンプレートをアクティブ化するときにエントリポイントを検
GOLD Impulse with Alert
Bernhard Schweigert
4.64 (11)
このインディケータは、当社の2つの製品 Advanced Currency IMPULSE with ALERT  +   Currency Strength Exotics . のスーパーコンビネーションです。 このインジケーターは全ての時間枠で作動し、8つの主要通貨と1つのシンボルの強弱のインパルスをグラフで表示します。 このインジケータは、金、エキゾチックペア、商品、インデックス、先物など、あらゆるシンボルの通貨強度の加速度を表示することに特化されています。金、銀、原油、DAX、US30、MXN、TRY、CNHなどの通貨強度の加速度(インパルスまたは速度)を表示するために、任意のシンボルを9行目に追加できる、この種の最初のものです。 新しいアルゴリズムに基づいて構築され、潜在的な取引の特定と確認がさらに容易になりました。これは、通貨の強さや弱さが加速しているかどうかをグラフィカルに表示し、その加速の速度を測定するためです。加速すると物事は明らかに速く進みますが、これはFX市場でも同じです。つまり、反対方向に加速している通貨をペアリングすれば、潜在的に利益を生む取引を特定
通貨強さウィザードは、取引を成功させるためのオールインワン ソリューションを提供する非常に強力な指標です。このインジケーターは、複数の時間枠のすべての通貨のデータを使用して、このまたはその外国為替ペアのパワーを計算します。このデータは、使いやすい通貨インデックスと通貨パワーラインの形式で表され、特定の通貨のパワーを確認するために使用できます。 必要なのは、取引したいチャートにインジケーターを接続することだけです。インジケーターは、取引する通貨の実際の強さを示します。このインジケーターは、トレンドに合わせて取引するときに有利に利用できる売買高の圧力の極値も示します。このインジケーターには、フィボナッチに基づく可能なターゲットも表示されます。 このインジケーターは、PUSH 通知を含むあらゆるタイプのアラートを提供します。 購入後ご連絡下さい。私の取引のヒントをあなたと共有し、素晴らしいボーナスインジケーターを無料で提供します! 幸せで有益な取引をお祈りします。
** All Symbols x All Timeframes scan just by pressing scanner button ** After 18 years of experience in the markets and programming, Winner indicator is ready. I would like to share with you! *** Contact me  to send you instruction  and add you in "123 scanner group" for sharing or seeing experiences with other users. Introduction The 123 Pattern Scanner indicator with a special enhanced algorithm is a very repetitive common pattern finder with a high success rate . Interestingly, this Winner in
BinaryUniversal is a signal indicator for binary options and Forex. In its work, the indicator uses a complex algorithm for generating signals. Before forming a signal, the indicator analyzes volatility, candlestick patterns, important support and resistance levels. The indicator has the ability to adjust the accuracy of the signals, which makes it possible to apply this indicator for both aggressive and conservative trading. The indicator is set in the usual way, it works on any time period and
市場の2つの基本原則に基づく日中戦略。 このアルゴリズムは、追加のフィルターを使用したボリュームと価格の波の分析に基づいています。インディケータのインテリジェントアルゴリズムは、2つの市場要因が1つに結合した場合にのみシグナルを出します。インディケータは、より高い時間枠のデータを使用して、M1チャート上の特定の範囲の波を計算します。そして波を確認するために、インジケーターはボリュームによる分析を使用します。 このインディケータはレディトレーディングシステムです。トレーダーが必要とするのは、信号に従うことだけです。また、インジケーターはあなた自身の取引システムの基礎になることができます。取引はミニッツチャートでのみ行われます。 インジケーターがMTFの原則を使用しているという事実にもかかわらず、インジケーターのアルゴリズムは可能な限り安定しています。 購入後、必ず私に書いてください!私の取引設定と推奨事項をあなたと共有します!
これはMT4のインジケーターで、再描画なしで取引に参入するための正確なシグナルを提供します。 外国為替、暗号通貨、金属、株式、インデックスなど、あらゆる金融資産に適用できます。かなり正確な見積もりを提供し、取引を開始して終了するのに最適な時期を教えてくれます。1つのシグナルを処理しただけでインジケーターの元が取れた例の 動画 (6:22)をご覧ください。Entry PointsPro インジケーターの助けを借りたほとんどのトレーダーの最初の1週間の結果が改善しています。 Telegramグループ に登録してください。Entry Points Proインジケーターのメリットは次の通りです。 再描画のないエントリーシグナル 再描画されるインジケーターでは一度表示されたシグナルが削除されて大きな金銭的損失につながることがありますが、これと異なり、表示されて確認されたシグナルは消えることがありません。 エラーなしの取引開始 インジケーターアルゴリズムによって取引を開始する(資産を売買する)理想的な瞬間を見つけることができます。それを使用するすべてのトレーダーの成功率が向上します。 あら
サポートとレジスタンススクリーナーは、1つのインジケーター内に複数のツールを提供するMetaTraderの1つのレベルインジケーターにあります。 利用可能なツールは次のとおりです。 1.市場構造スクリーナー。 2.強気のプルバックゾーン。 3.弱気プルバックゾーン。 4.デイリーピボットポイント 5.毎週のピボットポイント 6.毎月のピボットポイント 7.ハーモニックパターンとボリュームに基づく強力なサポートとレジスタンス。 8.銀行レベルのゾーン。 期間限定オファー:HVサポートおよびレジスタンスインジケーターは、50ドルと生涯でのみご利用いただけます。 (元の価格125 $) Metatrader Backtesterの制限なしでインジケーターを試してみませんか? デモ版をダウンロードするには、ここをクリックしてください。 主な機能     ハーモニックおよびボリュームアルゴリズムに基づく強力なサポートおよびレジスタンスゾーン。     ハーモニックおよびボリュームアルゴリズムに基づく強気および弱気のプルバックゾーン。     市場構造スクリーナー     毎日、毎週、毎月の
Apollo Secret Trend は、任意のペアと時間枠でトレンドを見つけるために使用できるプロのトレンド インジケーターです。インジケーターは、取引するペアや時間枠に関係なく、市場のトレンドを検出するために使用できる主要な取引インジケーターになることができます。インジケーターで特別なパラメーターを使用することにより、シグナルを個人の取引スタイルに適応させることができます。 このインジケーターは、PUSH 通知を含むすべてのタイプのアラートを提供します。インジケータの信号は再描画しないでください!提供されたスクリーンショットでは、アポロ シークレット トレンド インジケーターと買われ過ぎ/売られ過ぎのオシレーター インジケーターを組み合わせて見ることができます。これは完全に無料で提供されます。 購入後、2 番目の買われすぎおよび売られすぎのオシレーター インジケーターを無料で入手するために私に連絡してください!また、システムの使用方法についても説明します。お得な特典もご用意しております!
現在26%オフ 初心者やエキスパートトレーダーに最適なソリューション! このインジケーターは、独自の機能と新しい計算式を取り入れた、ユニークで高品質、かつ手頃な価格のトレーディングツールです。たった1枚のチャートで28の為替ペアの通貨強度を読み取ることができます。新しいトレンドやスキャルピングチャンスの引き金となるポイントを正確に特定することができるので、あなたのトレードがどのように改善されるか想像してみてください。 ユーザーマニュアルはこちら  https://www.mql5.com/en/blogs/post/697384 これが最初の1本、オリジナルだ! 価値のないクローンを買わないでください。 特別な サブウィンドウの矢印で強い通貨の勢いを表示 GAPがあなたのトレードを導く! 基準通貨や気配値が売られすぎ・買われすぎのゾーン(外相フィボナッチレベル)にあるとき、個別チャートのメインウィンドウに警告表示。 通貨がレンジの外側から反落した場合、プルバック/リバーサルのアラート。 クロスパターンの特別なアラート 複数の時間枠を選択可能で、トレンドを素早く確認できます
Advanced Supply Demand
Bernhard Schweigert
4.91 (296)
現在33%オフ 初心者にもエキスパートトレーダーにも最適なソリューション このインジケーターは独自の機能と新しい公式を多数内蔵しており、ユニークで高品質かつ手頃な取引ツールです。このアップデートでは、2つの時間枠ゾーンを表示できるようになります。より長いTFだけでなく、チャートTFとより長いTF(ネストゾーンを表示)の両方を表示できます。すべてのSupply Demandトレーダーの皆さんのお気に召すはずです。:) 重要情報の公開 Advanced Supply Demandの可能性を最大化するには、 https://www.mql5.com/ja/blogs/post/720245 にアクセスしてください。   エントリーまたはターゲットの正確なトリガーポイントを正確に特定できれば取引がどのように改善されるか想像してみてください。新しい基盤となるアルゴリズムに基づいて構築されているため、買い手と売り手の間の潜在的な不均衡をさらに簡単に特定できます。これは、最も強い需要と供給のゾーンと、過去のパフォーマンス(古いゾーンを表示)がグラフィカルに表現されるためです。これらの機能は、最適な
M1 Easy Scalper
Martin Alejandro Bamonte
4 (3)
M1 EASY SCALPER is a scalping indicator specifically designed for the 1-minute (M1) timeframe, compatible with any currency pair or instrument available on your MT4 terminal. Of course, it can also be used on any other timeframe, but it works exceptionally well on M1 (which is challenging!) for scalping. Note: if you're going to scalp, make sure you have an account suitable for it. Do not use Cent or Standard accounts as they have too much spread! (use ECN, RAW, or Zero Spread accounts) Robustn
Gold Pro Scalper
Aleksandr Makarov
4.8 (5)
Gold Pro Scalper Precise entry points for currencies, crypto, metals, stocks, indices! Indicator 100% does not repaint!!! If a signal appeared, it does not disappear! Unlike indicators with redrawing, which lead to loss of deposit, because they can show a signal, and then remove it. Trading with this indicator is very easy. Wait for a signal from the indicator and enter the deal, according to the arrow  (Blue arrow - Buy, Red - Sell). I recommend using it with the Trend Filter (downloa
Volume Profile Order Blocks -  A smarter way to visualize liquidity, volume, and key levels. Volume Profile Order Blocks   is a cutting-edge indicator that enhances traditional order block strategies by embedding a   detailed volume profile   directly within each zone. This provides traders with a clear, data-driven view of where institutional interest may lie — not just in price, but in volume distribution. MT5 Version -  https://www.mql5.com/en/market/product/146215/ Join To Learn Market Depth
現在20%OFF! 初心者やエキスパートトレーダーのためのベストソリューション! このダッシュボードソフトウェアは、28の通貨ペアで動作しています。それは私達の主要な指標(高度な通貨の強さ28と高度な通貨インパルス)の2に基づいています。それは全体の外国為替市場の大きい概観を与えます。それは、すべての(9)時間枠で28の外国為替ペアのための高度な通貨の強さの値、通貨の動きの速度と信号を示しています。チャート上で1つのインディケータを使用して市場全体を観察し、トレンドやスキャルピングの機会をピンポイントで見つけることができたら、あなたのトレードがどのように改善されるか想像してみてください。 このインディケータには、強い通貨と弱い通貨の識別、潜在的な取引の識別と確認がより簡単になるような機能が搭載されています。このインディケータは、通貨の強さや弱さが増加しているか減少しているか、また、すべての時間枠でどのように機能しているかをグラフィカルに表示します。 新機能として、現在の市場環境の変化に適応するダイナミックなマーケットフィボナッチレベルが追加され、すでに当社のAdvanced
Gold Stuff
Vasiliy Strukov
4.85 (263)
Gold Stuff は、金専用に設計されたトレンド指標であり、あらゆる金融商品にも使用できます。 インジケーターは再描画せず、遅れません。 推奨時間枠 H1. それインディケータでフルオートExpert Advisor EA Gold Stuffが動作します。 あなたは私のプロフィールでそれを見つけることができます. 設定と個人的なボーナスを得るために、購入後すぐに私に連絡してください! トレンド スキャナーの強力なサポートを利用して、無料のインジケーターを入手し、プライバシーを守ります。あーみー!   設定 矢印を描く - オンオフ。 チャートに矢印を描く。 アラート - 可聴アラートのオンオフ。 メール通知 - オンオフ。 電子メール通知。 プチ通知 - オンオフ。 プッシュ通知。 次に、色域を調整します。 Gold Stuff は、金専用に設計されたトレンド指標であり、あらゆる金融商品にも使用できます。 インジケーターは再描画せず、遅れません。 推奨時間枠 H1. それインディケータでフルオートExpert Advisor EA Gold Stuffが動作します。
作者のその他のプロダクト
Special offer : ALL TOOLS , just $35 each! New tools   will be   $30   for the   first week   or the   first 3 purchases !  Trading Tools Channel on MQL5 : Join my MQL5 channel to update the latest news from me Trendlines with Breaks Scanner は、トレーダーが重要なトレンドを特定し、リアルタイムでブレイクアウトを検出するのを支援するために設計された最先端の取引ツールです。ピボットポイントに基づいて自動生成されたトレンドラインを使用することで、このインジケーターはトレーダーが精度と自信を持って取引の機会を活用できるようにします。 MT4バージョンを見る:  Trendlines with Breaks Scanner MT4 他の製品を見る:   All Products 主な機能 1. リアルタイムのブレイクアウト検出 ブレイクアウトアラート: 価
Special offer : ALL TOOLS , just $35 each! New tools   will be   $30   for the   first week   or the   first 3 purchases !  Trading Tools Channel on MQL5 : Join my MQL5 channel to update the latest news from me ボリュメトリックオーダーブロック多時間枠 インジケーターは、主要な市場参加者が注文を蓄積する重要な価格エリアを特定することで、より深い市場の洞察を求めるトレーダー向けに設計された強力なツールです。これらのエリアはボリュメトリックオーダーブロックとして知られており、サポートやレジスタンスの潜在的ゾーンとして機能し、取引の意思決定において重要な優位性を提供します。 MT4バージョンを見る:   Volumetric Order Blocks MT4 Multi Timeframe See more products at:   https://www.mql5.com/en
Special offer : ALL TOOLS , just $35 each! New tools   will be   $30   for the   first week   or the   first 3 purchases !  Trading Tools Channel on MQL5 : Join my MQL5 channel to update the latest news from me Supertrend Fakeout インジケーターは、従来の Supertrend インジケーターを改良したバージョンで、より信頼性の高いトレンドシグナルを提供することを目的としています。 Fakeout Index Limit や Fakeout ATR Mult といった高度な機能を取り入れることで、このインジケーターは短期的な価格変動や市場ノイズによって引き起こされる誤ったトレンド反転をフィルタリングするのに役立ちます。 MT4バージョンを見る:  Supertrend Fakeout MT4 その他の製品を見る:   すべての製品 動作の仕組み Supertr
FREE
Special offer : ALL TOOLS , just $35 each! New tools   will be   $30   for the   first week   or the   first 3 purchases !  Trading Tools Channel on MQL5 : Join my MQL5 channel to update the latest news from me Supply Demand Retest and Break Multi Timeframe 、このツールは強いモメンタムキャンドルに基づいて供給と需要のゾーンをプロットし、   timeframe selector   機能を使用して複数の時間枠でこれらのゾーンを識別することを可能にします。再テストおよびブレークのラベルと、カスタマイズ可能な検証およびスタイリングオプションにより、このツールは効果的なトレーディング分析をサポートします。 MT4バージョンの詳細はこちら:  Supply Demand Retest and Break MT4 Multi Timefra
Special offer : ALL TOOLS , just $35 each! New tools   will be   $30   for the   first week   or the   first 3 purchases !  Trading Tools Channel on MQL5 : Join my MQL5 channel to update the latest news from me Liquidity Pools インジケーターは、チャート上の潜在的な流動性ゾーンを、高頻度でウィックが触れる高安領域と、それぞれのゾーンでの再訪回数および取引量を分析することによって特定し、マークする高度なツールです。このツールは、流動性が集積される市場のダイナミクスをトレーダーに提供し、潜在的な転換点を予測し、重要なサポートおよびレジスタンスレベルを特定するのに役立ちます。 MT4バージョンはこちら: Liquidity Pools MT4 他の製品はこちら:   全製品 主な機能と利点 1. 正確な流動性ゾーンの特定 高影響ゾーンのハイライト: Liquidity
Special offer : ALL TOOLS , just $35 each! New tools   will be   $30   for the   first week   or the   first 3 purchases !  Trading Tools Channel on MQL5 : Join my MQL5 channel to update the latest news from me Liquidity Pools インジケーターは、チャート上の潜在的な流動性ゾーンを、高頻度でウィックが触れる高安領域と、それぞれのゾーンでの再訪回数および取引量を分析することによって特定し、マークする高度なツールです。このツールは、流動性が集積される市場のダイナミクスをトレーダーに提供し、潜在的な転換点を予測し、重要なサポートおよびレジスタンスレベルを特定するのに役立ちます。 MT5バージョンはこちら:   Liquidity Pools MT5 他の製品はこちら:   全製品 主な機能と利点 1. 正確な流動性ゾーンの特定 高影響ゾーンのハイライト: Liquidi
Special offer : ALL TOOLS , just $35 each! New tools   will be   $30   for the   first week   or the   first 3 purchases !  Trading Tools Channel on MQL5 : Join my MQL5 channel to update the latest news from me SuperTrend ATR Multiplier with Scanner for MT5 をご紹介します。これは、マーケットトレンドに先んじるための多機能で強力なツールで、カスタマイズ可能な機能とリアルタイムのアラートが備わっています。このインディケーターは、 Kivanc Ozbilgic の信頼できる SuperTrend ロジックを基に、正確なトレンド信号を提供します。 ATR の計算方法は、柔軟に対応するために RMA (相対移動平均)と SMA (単純移動平均)から選べます。デフォルト設定では、 ATR 期間が10、乗数が3に設定されており、 SuperT
FREE
Special offer : ALL TOOLS , just $35 each! New tools   will be   $30   for the   first week   or the   first 3 purchases !  Trading Tools Channel on MQL5 : Join my MQL5 channel to update the latest news from me 近年のボラティリティの高い金融取引市場では、サポートとレジスタンスを正確に見極めることが、トレーダーが的確な判断を下すために非常に重要です。 Predictive Ranges Scanner Multi-TF は、高度なツールであり、複数の通貨ペアと複数時間足にわたって将来のトレードレンジをスキャン・予測することで、市場トレンドを効果的かつ正確に把握できるようサポートします。 See more MT5 version at:  Predictive Ranges MT5 Scanner Multi TF See more products at:   All P ro
Special offer : ALL TOOLS , just $35 each! New tools   will be   $30   for the   first week   or the   first 3 purchases !  Trading Tools Channel on MQL5 : Join my MQL5 channel to update the latest news from me Volumatic VIDYA (Variable Index Dynamic Average) は、トレンドを追跡し、トレンドの各フェーズ内での買い圧力と売り圧力を分析するために設計された高度なインジケーターです。可変インデックス動的平均 (Variable Index Dynamic Average) をコアの動的平滑化技術として利用することで、このツールは、価格とボリュームのダイナミクスに関する重要な洞察を、市場構造の重要なレベルで提供します。 MT4バージョンを見る:  Volumatic VIDyA MT4 他の製品を見る:   全製品 To use iCus
Special offer : ALL TOOLS , just $35 each! New tools   will be   $30   for the   first week   or the   first 3 purchases !  Trading Tools Channel on MQL5 : Join my MQL5 channel to update the latest news from me Trendlines with Breaks Scanner は、トレーダーが重要なトレンドを特定し、リアルタイムでブレイクアウトを検出するのを支援するために設計された最先端の取引ツールです。ピボットポイントに基づいて自動生成されたトレンドラインを使用することで、このインジケーターはトレーダーが精度と自信を持って取引の機会を活用できるようにします。 MT5バージョンを見る:  Trendlines with Breaks Scanner MT5 他の製品を見る:   All Products 主な機能 1. リアルタイムのブレイクアウト検出 ブレイクアウトアラート: 価
Special offer : ALL TOOLS , just $35 each! New tools   will be   $30   for the   first week   or the   first 3 purchases !  Trading Tools Channel on MQL5 : Join my MQL5 channel to update the latest news from me ICTの 反転フェアバリューギャップ (IFVG) の概念を活用した Inversion Fair Value Gaps Indicator でその力を解放しましょう!この最新ツールは、フェアバリューギャップ (FVG) を次のレベルに引き上げ、反転したFVGゾーンを特定して表示します。これらは、価格修正後に形成される重要なサポートおよびレジスタンスエリアです。スキャルパー、スイングトレーダー、長期投資家のいずれであっても、IFVGインジケーターはリアルタイムでの意思決定にとって貴重な洞察を提供します。 MT4バージョンはこちら:  Inversion Fair Val
Special offer : ALL TOOLS , just $35 each! New tools   will be   $30   for the   first week   or the   first 3 purchases !  Trading Tools Channel on MQL5 : Join my MQL5 channel to update the latest news from me Follow Line MT5 とスキャナーを使って、ボラティリティに基づいた高度なインジケーターでトレーディングエッジを最大限に活用しましょう。このツールは、カスタマイズ可能な設定とともに、ボリンジャーバンドの力を組み合わせ、価格の動きについて正確な洞察を提供します。 See more MT4 version at:   Follow Line MT4 with Scanner See more products at:   https://www.mql5.com/en/users/ndhsfy/seller Follow Line の鍵は、価格が 1 標準偏差に設
FREE
Special offer : ALL TOOLS , just $35 each! New tools   will be   $30   for the   first week   or the   first 3 purchases !  Trading Tools Channel on MQL5 : Join my MQL5 channel to update the latest news from me Supply Demand Retest and Break Multi Timeframe 、このツールは強いモメンタムキャンドルに基づいて供給と需要のゾーンをプロットし、   timeframe selector   機能を使用して複数の時間枠でこれらのゾーンを識別することを可能にします。再テストおよびブレークのラベルと、カスタマイズ可能な検証およびスタイリングオプションにより、このツールは効果的なトレーディング分析をサポートします。 MT5バージョンの詳細はこちら:  Supply Demand Retest and Break MT5 Multi Timefra
Special offer : ALL TOOLS , just $35 each! New tools   will be   $30   for the   first week   or the   first 3 purchases !  Trading Tools Channel on MQL5 : Join my MQL5 channel to update the latest news from me Machine Learning Adaptive SuperTrend という先進的なインジケーターを使って、最新の機械学習の力を体験してください。このインジケーターは、変化する市場環境にシームレスに適応するように設計されています。k-meansクラスタリングをSuperTrendメソッドと組み合わせることで、精確なトレンドの識別とボラティリティの評価を実現し、トレーダーにダイナミックな市場での貴重な優位性を提供します。 MT4バージョンはこちら:   Machine Learning Adaptive SuperTrend MT4 他の製品を見るには:   全製品
Special offer : ALL TOOLS , just $35 each! New tools   will be   $30   for the   first week   or the   first 3 purchases !  Trading Tools Channel on MQL5 : Join my MQL5 channel to update the latest news from me ボリュメトリックオーダーブロック多時間枠 インジケーターは、主要な市場参加者が注文を蓄積する重要な価格エリアを特定することで、より深い市場の洞察を求めるトレーダー向けに設計された強力なツールです。これらのエリアはボリュメトリックオーダーブロックとして知られており、サポートやレジスタンスの潜在的ゾーンとして機能し、取引の意思決定において重要な優位性を提供します。 MT5バージョンを見る:   Volumetric Order Blocks MT5 Multi Timeframe See more products at:   https://www.mql5.com/en
Special offer : ALL TOOLS , just $35 each! New tools   will be   $30   for the   first week   or the   first 3 purchases !  Trading Tools Channel on MQL5 : Join my MQL5 channel to update the latest news from me ICTの 反転フェアバリューギャップ (IFVG) の概念を活用した Inversion Fair Value Gaps Indicator でその力を解放しましょう!この最新ツールは、フェアバリューギャップ (FVG) を次のレベルに引き上げ、反転したFVGゾーンを特定して表示します。これらは、価格修正後に形成される重要なサポートおよびレジスタンスエリアです。スキャルパー、スイングトレーダー、長期投資家のいずれであっても、IFVGインジケーターはリアルタイムでの意思決定にとって貴重な洞察を提供します。 MT5バージョンはこちら:   Inversion Fair Va
Special offer : ALL TOOLS , just $35 each! New tools   will be   $30   for the   first week   or the   first 3 purchases !  Trading Tools Channel on MQL5 : Join my MQL5 channel to update the latest news from me 概要 OA SnR Powerは、サポートおよびレジスタンスレベルの強度を識別して評価するために設計された強力なツールです。取引量、反発頻度、再テスト回数などの重要な要素を組み込むことで、このインジケーターは市場の重要な価格ゾーンを包括的に可視化します。 その他の製品を見る:   すべての 製品 OA SnR Powerの仕組み 高値と安値の特定 このインジケーターは、ローカル高値と安値を計算するための高度なアルゴリズムを使用します。 ユーザーはゾーン幅の設定を調整でき、サポートおよびレジスタンスの潜在的なレベルを正確に検出します。 主要レベルのフィルタリングと統合
FREE
Special offer : ALL TOOLS , just $35 each! New tools   will be   $30   for the   first week   or the   first 3 purchases !  Trading Tools Channel on MQL5 : Join my MQL5 channel to update the latest news from me I. はじめに Market Structure Trend Targets Scanner は、市場のトレンドを分析し、ブレイクアウトポイントを特定し、動的なストップロスを通じてリスクを管理するための強力なツールです。過去の高値と安値を追跡してブレイクアウトを特定することで、このツールはトレーダーが直感的に市場のトレンドや潜在的な反転を迅速に認識するのを助けます。 MT4バージョンの詳細はこちら:  Market Structure Trend Targets MT4 Scanner その他の製品についてはこちら:   すべての 製品 II. 主な特徴 順序番号付き
Special offer : ALL TOOLS , just $35 each! New tools   will be   $30   for the   first week   or the   first 3 purchases !  Trading Tools Channel on MQL5 : Join my MQL5 channel to update the latest news from me スリーバーレバーサルパターンインジケーター は、トレーダーに強力なツールを提供し、価格チャート上で三本の反転パターンを自動的に識別して強調表示します。このインジケーターは、潜在的なトレンドの反転を検出するための貴重なリソースであり、統合されたトレンドインジケーターを通じて信号精度を向上させることができます。 MT5バージョンの詳細はこちら: Three Bar Reversal Pattern MT5 その他の製品はこちら:   すべての製品 主な機能 パターンの自動検出: このインジケーターは、三本の反転パターンをスキャンし、視覚的に明確なシグナルで表示し、潜在的なト
Special offer : ALL TOOLS , just $35 each! New tools   will be   $30   for the   first week   or the   first 3 purchases !  Trading Tools Channel on MQL5 : Join my MQL5 channel to update the latest news from me 用の画期的な RSI Kernel Optimized with Scanner をご紹介します。この最先端ツールは、強力なカーネル密度推定 (KDE) アルゴリズムを統合することで、従来の RSI 分析を再定義します。この高度なインジケーターは、リアルタイムでの市場トレンドのインサイトを提供するだけでなく、複数の通貨ペアや時間枠を同時にスキャンできるダッシュボードも備えています。このツールがトレードアーセナルに必須な理由をご紹介します。 See more MT5 version at:   RSI Kernel Optimized with Scanner for M
Special offer : ALL TOOLS , just $35 each! New tools   will be   $30   for the   first week   or the   first 3 purchases !  Trading Tools Channel on MQL5 : Join my MQL5 channel to update the latest news from me まずは優れた機能から始めましょう: EA にはニュース フィルターと RSI フィルターが搭載されています。 低リスク (一部の通貨ペアのドローダウンは 10% 未満、5% の場合もあります)。 この EA はマーチンゲールやグリッド機能を使用しません。 EA は必要に応じて手動取引用のビジュアル ゾーンを表示できます。 まず、EA を完全に理解するには、リンクの詳細な手順をお読みください: スキャルピング EA ブレイクアウト トップとボット MT5 の詳細な紹介 このEAを購入する前に、EAがお手伝いできるかどうかを確認するためにデモをダウンロードしてください。 S
Special offer : ALL TOOLS , just $35 each! New tools   will be   $30   for the   first week   or the   first 3 purchases !  Trading Tools Channel on MQL5 : Join my MQL5 channel to update the latest news from me Supertrend Fakeout インジケーターは、従来の Supertrend インジケーターを改良したバージョンで、より信頼性の高いトレンドシグナルを提供することを目的としています。 Fakeout Index Limit や Fakeout ATR Mult といった高度な機能を取り入れることで、このインジケーターは短期的な価格変動や市場ノイズによって引き起こされる誤ったトレンド反転をフィルタリングするのに役立ちます。 MT5バージョンを見る:  Supertrend Fakeout MT5 その他の製品を見る:   すべての製品 動作の仕組み Supertr
FREE
Special offer : ALL TOOLS , just $35 each! New tools   will be   $30   for the   first week   or the   first 3 purchases !  Trading Tools Channel on MQL5 : Join my MQL5 channel to update the latest news from me SuperTrend AI Clustering MT5 with Scanner でAIの力を発見し、MetaTrader 5 (MT5) 用の革命的な取引ツールです。このインジケーターは、K-means クラスタリングと広く人気のある SuperTrend インジケーターを組み合わせることで市場分析を再定義し、トレーダーがトレンドとシグナルをナビゲートする際に優位性を提供します。 See more MT4 version at:   SuperTrend AI Clustering MT4 with Scanner See more products at:   h
Special offer : ALL TOOLS , just $35 each! New tools   will be   $30   for the   first week   or the   first 3 purchases !  Trading Tools Channel on MQL5 : Join my MQL5 channel to update the latest news from me 線形回帰チャンネル指標 は、価格トレンドや潜在的な反転ポイントを捉えるための強力なテクニカル分析ツールです。線形回帰チャンネル、バンド、将来の予測を計算して表示することで、市場の動態に対する深い洞察を提供します。この指標は、買われ過ぎや売られ過ぎの状態、トレンドの方向を特定し、将来の価格動向に関する明確な視覚的手がかりを提供します。 MT4バージョンは以下で確認:   Linear Regression Channel  MT4 See more products at:   https://www.mql5.com/en/users/ndhsfy/seller 主な
Special offer : ALL TOOLS , just $35 each! New tools   will be   $30   for the   first week   or the   first 3 purchases !  Trading Tools Channel on MQL5 : Join my MQL5 channel to update the latest news from me MT5 用の画期的な RSI Kernel Optimized with Scanner をご紹介します。この最先端ツールは、強力なカーネル密度推定 (KDE) アルゴリズムを統合することで、従来の RSI 分析を再定義します。この高度なインジケーターは、リアルタイムでの市場トレンドのインサイトを提供するだけでなく、複数の通貨ペアや時間枠を同時にスキャンできるダッシュボードも備えています。このツールがトレードアーセナルに必須な理由をご紹介します。 See more MT4 version at:  RSI Kernel Optimized MT4 with Scanne
Special offer : ALL TOOLS , just $35 each! New tools   will be   $30   for the   first week   or the   first 3 purchases !  Trading Tools Channel on MQL5 : Join my MQL5 channel to update the latest news from me Follow Line とスキャナーを使って、ボラティリティに基づいた高度なインジケーターでトレーディングエッジを最大限に活用しましょう。このツールは、カスタマイズ可能な設定とともに、ボリンジャーバンドの力を組み合わせ、価格の動きについて正確な洞察を提供します。 See more MT5 version at:   Follow Line MT5 with Scanner See more products at:   https://www.mql5.com/en/users/ndhsfy/seller Follow Line の鍵は、価格が 1 標準偏差に設定された
FREE
Special offer : ALL TOOLS , just $35 each! New tools   will be   $30   for the   first week   or the   first 3 purchases !  Trading Tools Channel on MQL5 : Join my MQL5 channel to update the latest news from me AI Channels インジケーターは、クラスタリング分析における強力な機械学習技術である ローリングK-平均クラスタリング を使用して、価格の基礎的なトレンドについてリアルタイムの洞察を提供します。このインジケーターは、クラスタ化された価格データに基づいた適応チャネルを作成し、トレーダーがトレンド方向や市場の状況について情報に基づいた判断を下せるようにします。 インジケーターにはリスク管理に柔軟性を持たせるため、 トレーリングストップオプション も設定内に含まれています。 MT5バージョンを見る:   AI Channels MT5 他の製品を見る:     すべて
FREE
Special offer : ALL TOOLS , just $35 each! New tools   will be   $30   for the   first week   or the   first 3 purchases !  Trading Tools Channel on MQL5 : Join my MQL5 channel to update the latest news from me 絶えず変化する金融取引の世界では、サポートとレジスタンスレベルを正確に識別し分析することが、情報に基づいた投資判断を下すために不可欠です。 SnR Retest and Break Multi-Timeframe は、取引分析を強化するために設計されたサポートとレジスタンスのインジケーターです。革新的な Timeframe Selector 機能を利用して、このツールは複数のタイムフレームにわたる市場動向の包括的なビューを提供し、正確な取引選択を支援します。 詳細なMT4バージョンはこちら:  SnR Retest and Break MT4 Multi Timefra
Special offer : ALL TOOLS , just $35 each! New tools   will be   $30   for the   first week   or the   first 3 purchases !  Trading Tools Channel on MQL5 : Join my MQL5 channel to update the latest news from me AI Channels インジケーターは、クラスタリング分析における強力な機械学習技術である ローリングK-平均クラスタリング を使用して、価格の基礎的なトレンドについてリアルタイムの洞察を提供します。このインジケーターは、クラスタ化された価格データに基づいた適応チャネルを作成し、トレーダーがトレンド方向や市場の状況について情報に基づいた判断を下せるようにします。 インジケーターにはリスク管理に柔軟性を持たせるため、 トレーリングストップオプション も設定内に含まれています。 MT4バージョンを見る:   AI Channels MT4 他の製品を見る:     すべて
FREE
特別オファー : ALL TOOLS 、各 $35 のみ! 新しいツール   は   $30   で   最初の 1 週間   または   最初の 3 回の購入 に提供されます!  Trading Tools Channel on MQL5 : 私の MQL5 チャンネルに参加して最新情報を受け取ろう Volumatic Support/Resistance Levels Scanner は、価格構造に出来高の文脈を追加するサポート・レジスタンス系インジケータです。直近のスイングポイント周辺に取引活動がどのように集中しているかを示すことで、買い/売りの関心が最も高まっている箇所を視覚化します。 MT5 版はこちら:  Volumatic Support Resistance Levels MT5 Scanner その他の製品はこちら:   All P roducts 1 · 概要 本インジケータは、直近の高値・安値から価格ゾーンを描き、そのゾーンごとに出来高ヒストグラムを重ねます。ヒストグラムの厚みは現在の出来高に応じて拡大・縮小し、市場がある価格レベルにどれだけ注目しているかを測る
フィルタ:
Wills
54
Wills 2025.06.27 16:28 
 

Unfortunately this indicator re-paints.

Duc Hoan Nguyen
46380
開発者からの返信 Duc Hoan Nguyen 2025.06.27 16:40
Hi Wills, I don't know why you think it re-paints, maybe you have some confusion here, because I can assure you that the indicator does not re-paint. please check your private messages, I can explain in detail for you! Thanks so much!
jabautista
3986
jabautista 2025.03.24 19:48 
 

Solid indicator. Developer is very open suggestions and has great customer service!

Nikodem Dobrzynski
278
Nikodem Dobrzynski 2025.01.24 18:22 
 

Volumatic VIDyA is a very useful indicator that combines both trend and volume indications. When combined with other technical analysis indicators, it can be a great tool in your strategy. Niko.

XANKEEZ
788
XANKEEZ 2025.01.03 09:42 
 

VIDYA is a unique indicator that combines trend and volume analysis. for best results, use it with other indicators like RSI or ADX. the author keeps updating and making it better each time.

Duc Hoan Nguyen
46380
開発者からの返信 Duc Hoan Nguyen 2025.01.03 15:30
Thank you for your review!
Glad to hear the indicator is working well for you when combined with others.
Appreciate your recognition of the updates, and wishing you continued success!
レビューに返信