Zero Lag MA Trend Levels MT4 with Scanner

Special offer: ALL TOOLS, just $35 each!

New tools will be $30 for the first week or the first 3 purchases

Trading Tools Channel on MQL5: Join my MQL5 channel to update the latest news from me

L'indicatore Zero Lag MA Trend Levels con Scanner combina la media mobile senza ritardo (ZLMA) con una media mobile esponenziale (EMA) standard, offrendo ai trader una visione completa del momentum di mercato e dei livelli di prezzo chiave. Inoltre, le funzionalità di scanner e allerta consentono ai trader di monitorare facilmente i segnali su più coppie e timeframe, migliorando la capacità di individuare opportunità di trading.

See more MT5 version at:  Zero Lag MA Trend Levels MT5 with Scanner

See more products at: https://www.mql5.com/en/users/ndhsfy/seller

CARATTERISTICHE PRINCIPALI E COME USARLO

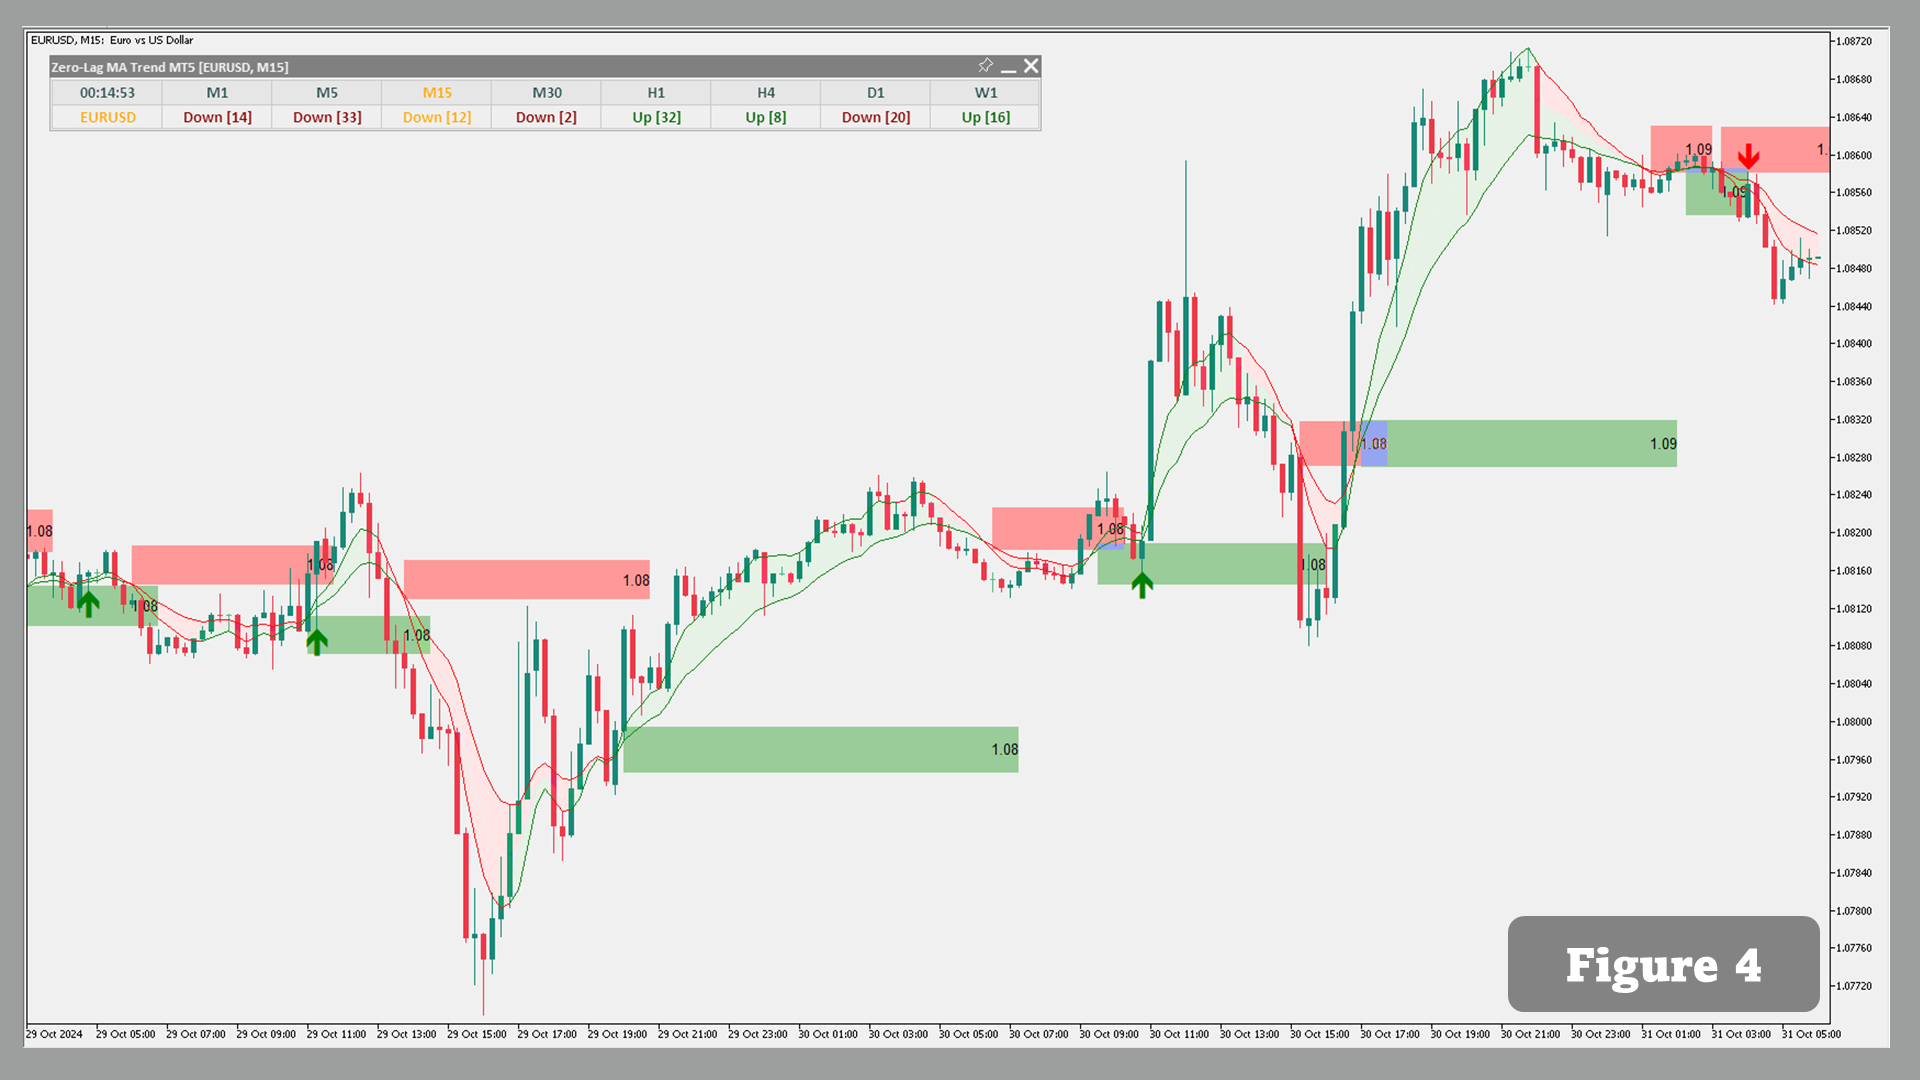
Media mobile senza ritardo (ZLMA) con nuvola EMA
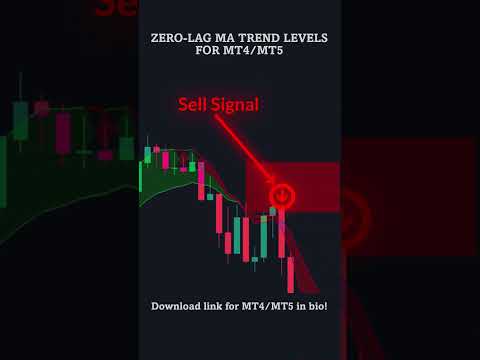
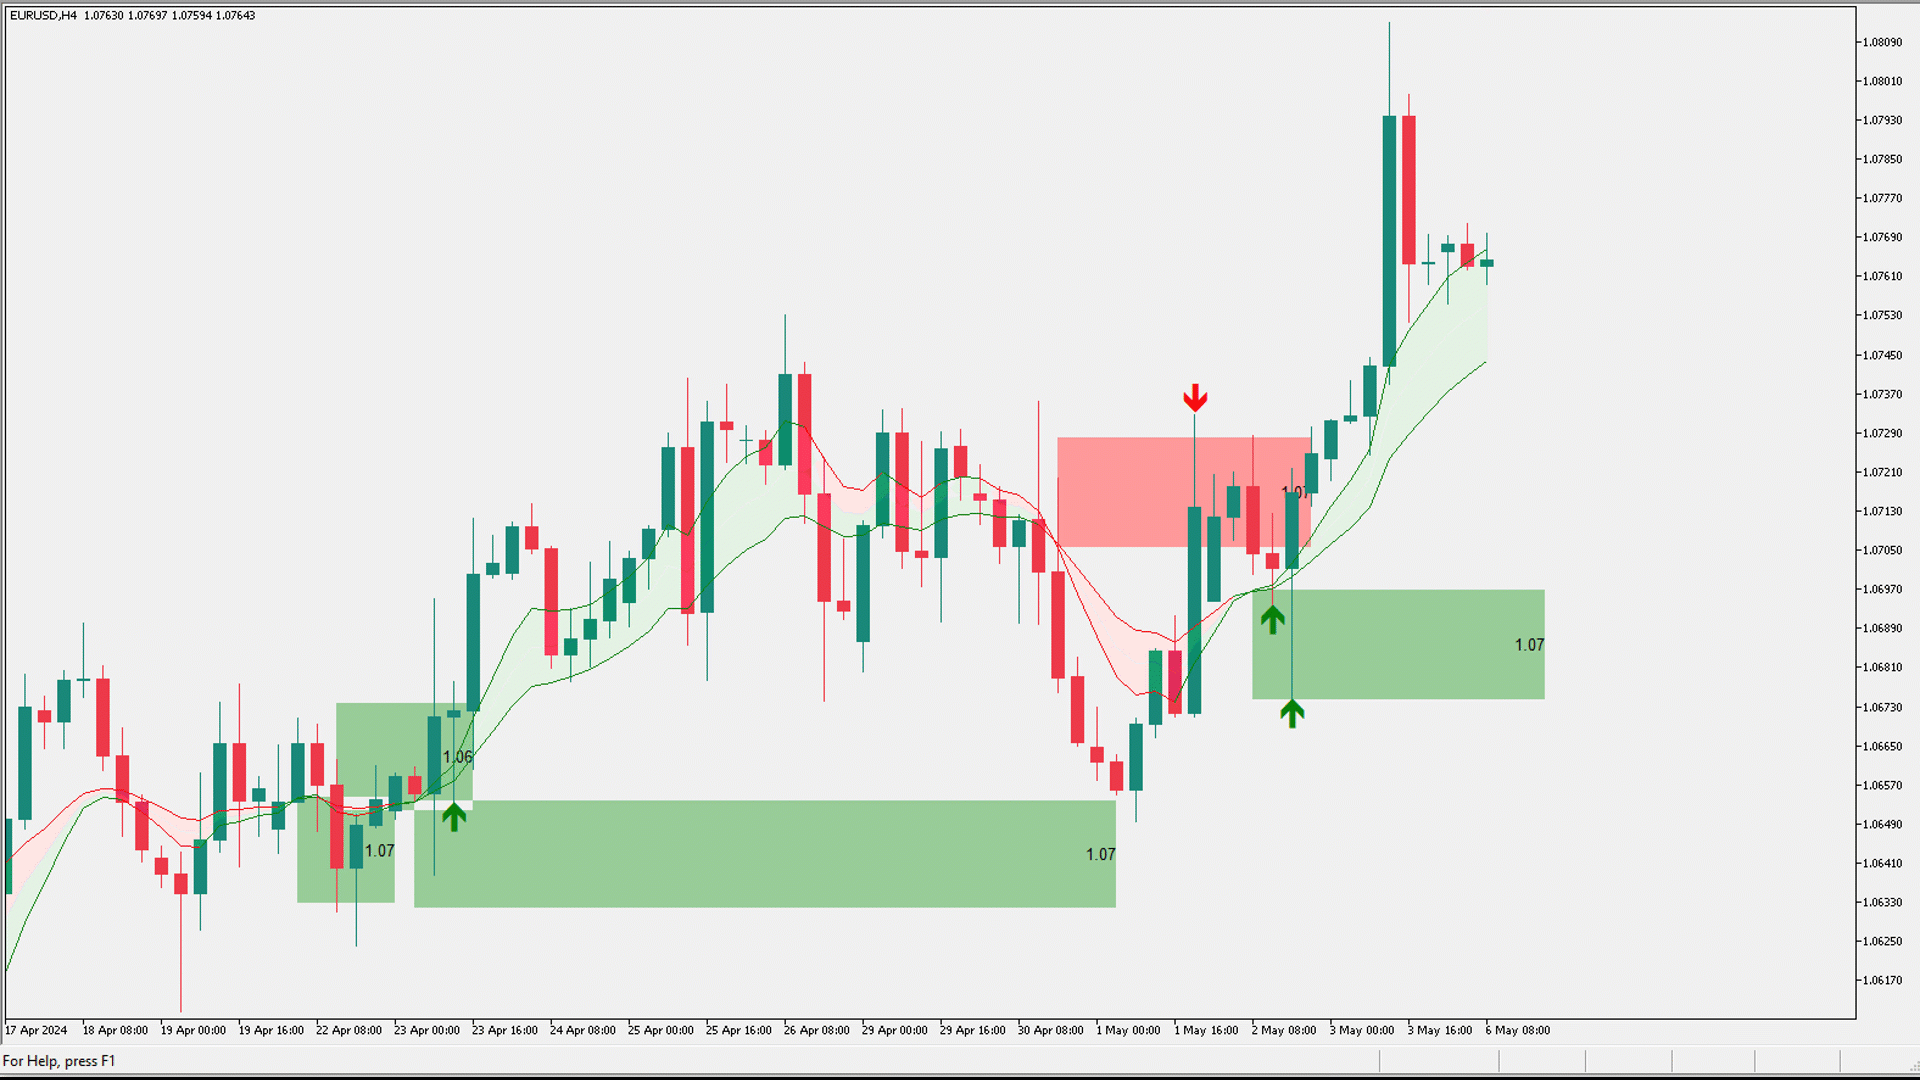
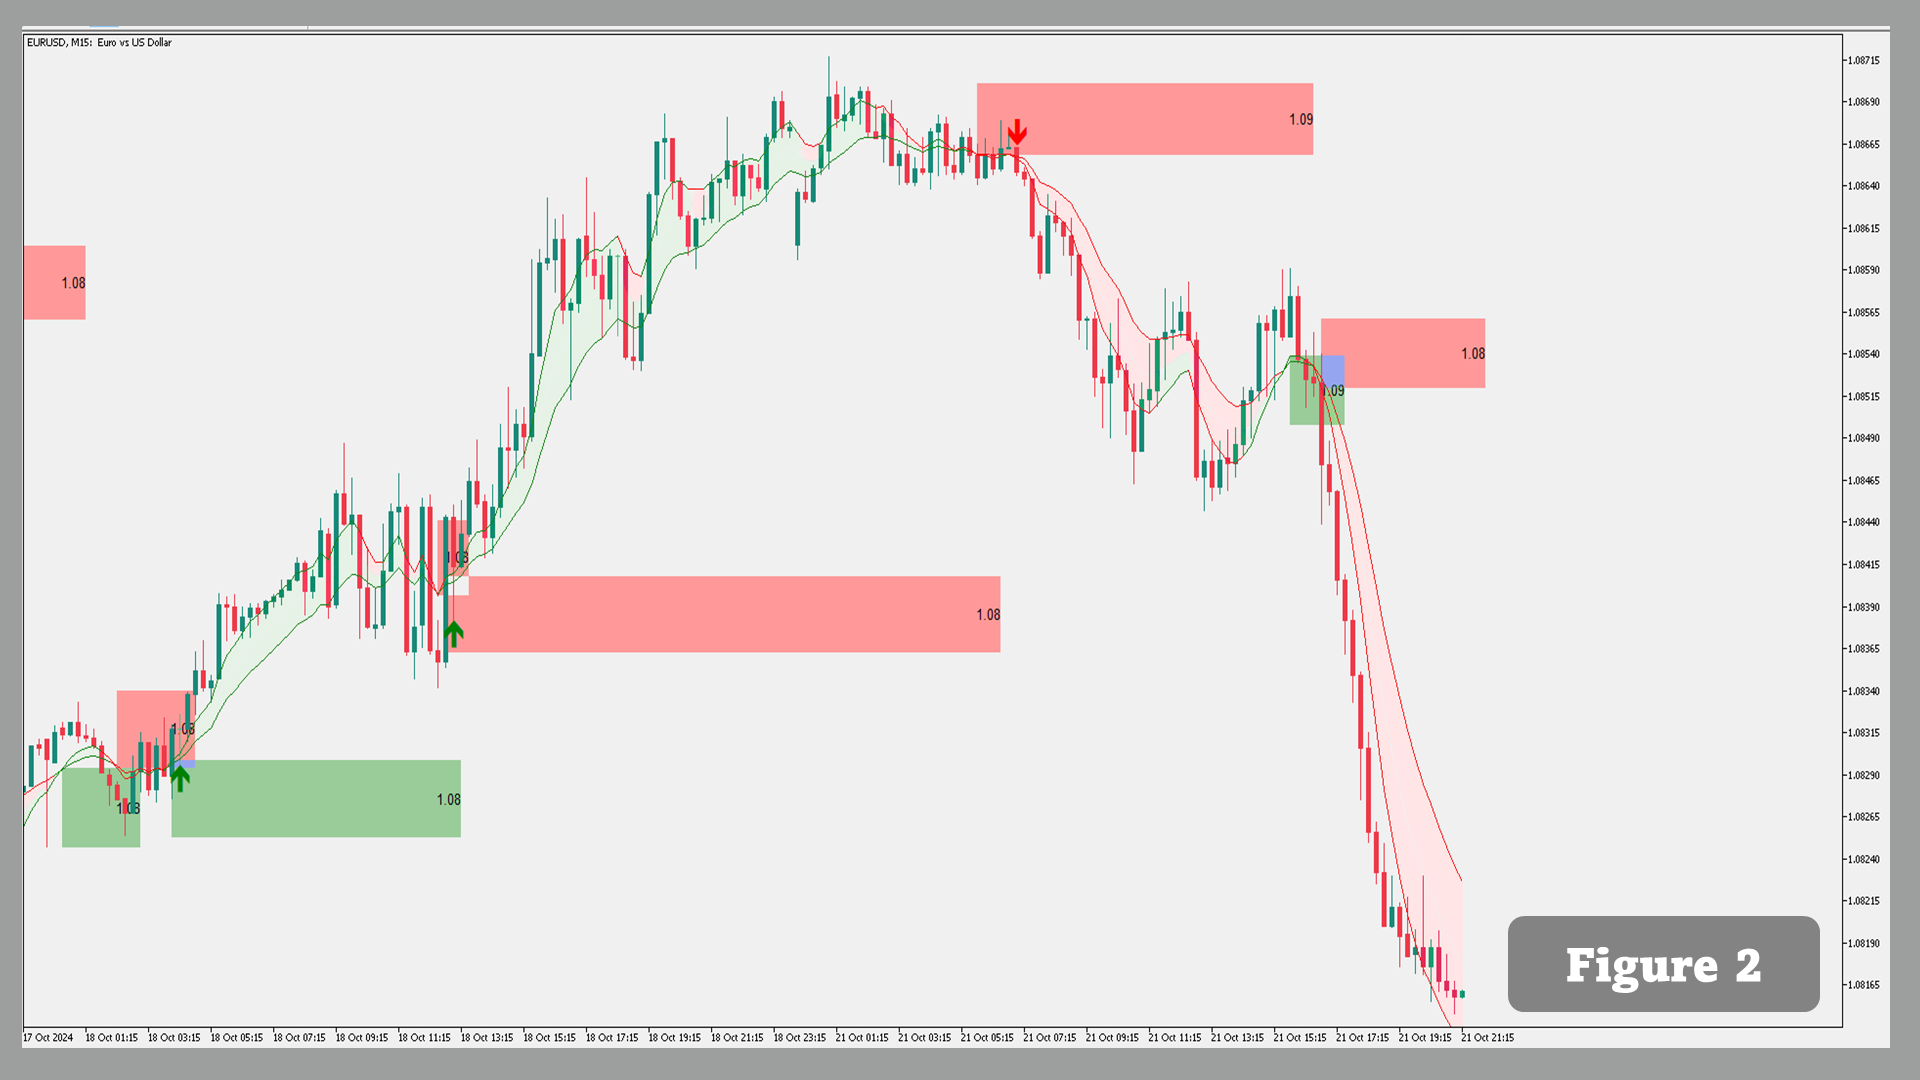
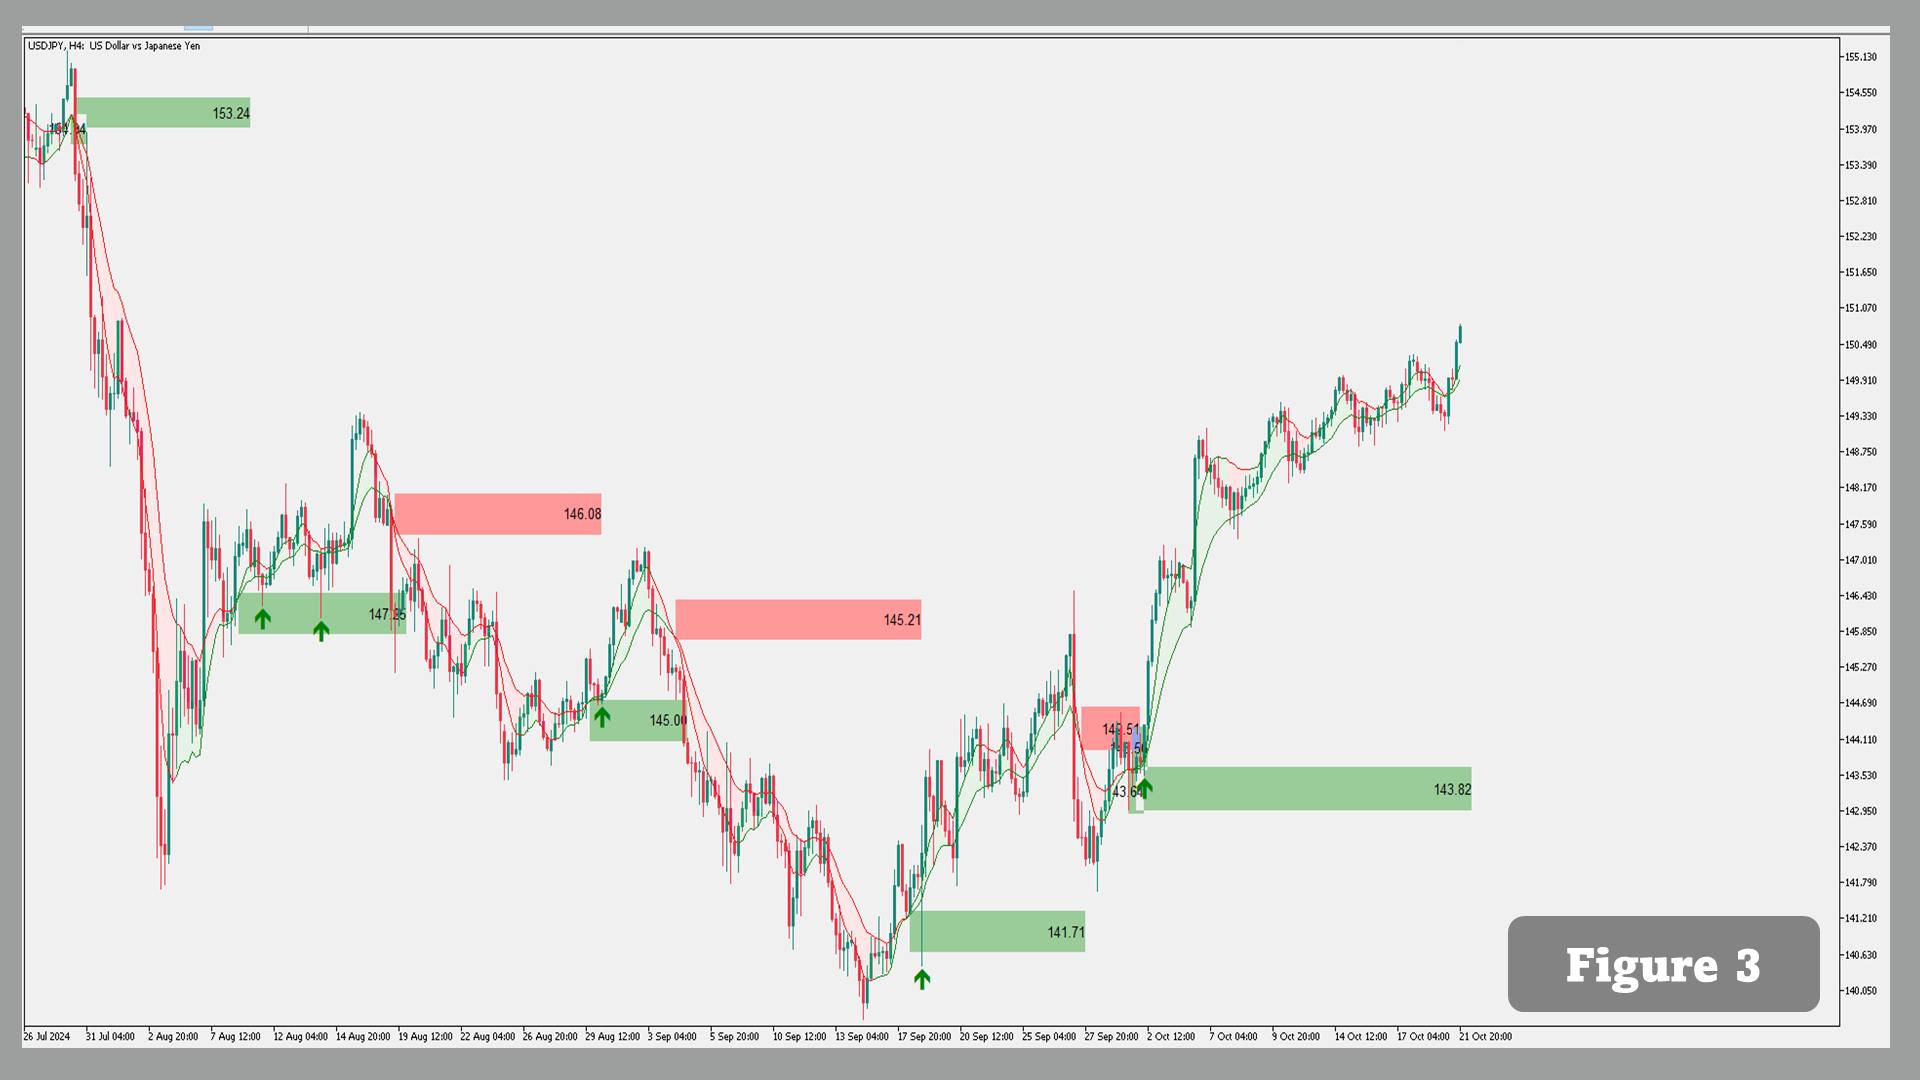
L'indicatore mostra una nuvola che cambia colore tra ZLMA e EMA in base alla direzione del trend. Il verde indica un trend rialzista, mentre il rosso segnala un trend ribassista.

Come usarlo: Monitora i cambiamenti di colore nella nuvola per rilevare potenziali cambiamenti di trend o di momentum.

Box di cambio di trend e livelli
Ogni volta che EMA e ZLMA si incrociano, l'indicatore traccia un box intorno al livello di prezzo in cui si verifica il cambio di trend, segnando importanti zone di supporto e resistenza.

Come usarlo: Usa questi box come potenziali punti di ingresso o uscita quando il prezzo ritorna su questi livelli.

Rilevamento dei retest con frecce
Quando il prezzo retesta un box di livello di trend precedentemente tracciato, l'indicatore lo segnala con una freccia: frecce verso l'alto per retest rialzisti e frecce verso il basso per retest ribassisti.

Come usarlo: Queste frecce aiutano i trader a identificare potenziali punti di continuazione o inversione, confermando le decisioni di trading su livelli di prezzo critici.

Codifica dinamica dei colori
ZLMA e EMA cambiano colore in base al trend attuale, facilitando una valutazione rapida del momentum del mercato e della direzione del trend.
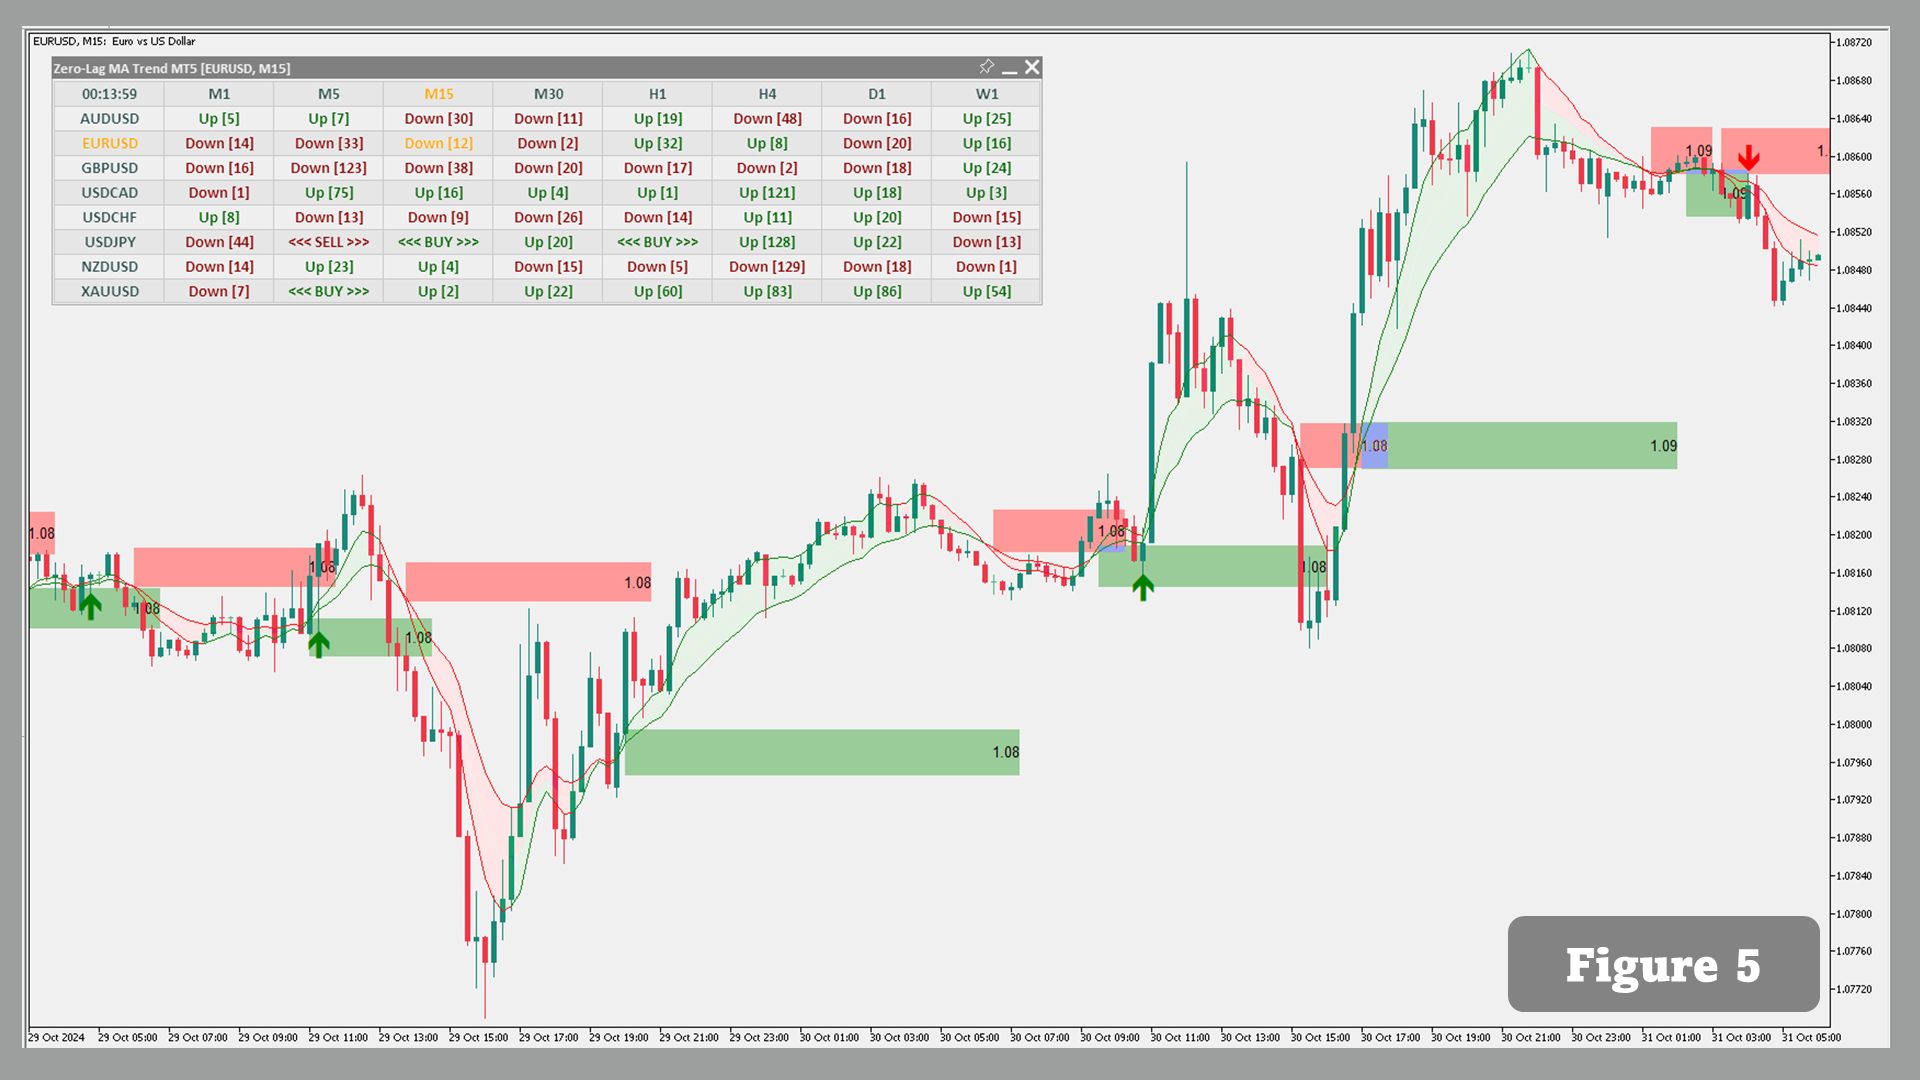
Scanner e allerta
La funzione scanner consente ai trader di monitorare più coppie e timeframe per i segnali con frecce quando il prezzo retesta le zone di trend. Gli avvisi vengono attivati quando appare un nuovo segnale, assicurando che i trader non perdano opportunità di trading importanti.

Nota importante sul repainting:
L'indicatore ridisegna solo la candela precedente. Se il prezzo tocca la zona e rimbalza sulla candela precedente, il segnale apparirà. Tuttavia, se la candela attuale visita nuovamente la zona, il segnale scomparirà. Se la candela attuale chiude al di fuori della zona, il segnale rimane invariato, fornendo una conferma affidabile.

INPUT DELL'UTENTE

  • Lunghezza: Definisce il periodo per i calcoli delle medie mobili.
  • Periodo ATR: Il periodo del True Range medio (ATR) utilizzato per calcolare i livelli di trend.
  • Prezzo applicato: Scegli il prezzo (chiusura, apertura, ecc.) su cui applicare i calcoli.
  • Altre opzioni di visualizzazione: Personalizza i colori, mostra o nascondi i box di livelli di trend e le frecce di retest.

CONCLUSIONE
Lo Zero Lag MA Trend Levels con Scanner fornisce uno strumento potente per la rilevazione dei trend e la gestione del trading. Con le funzionalità di scanner e allerta, i trader possono monitorare i segnali su più mercati, assicurando di essere sempre aggiornati sulle configurazioni di trading importanti. Identificando i livelli di trend e i retest, questo indicatore offre una soluzione altamente efficace per i trader alla ricerca di segnali di trading precisi e tempestivi.


    Prodotti consigliati
    pivot points using by many traders and pivot levels most of the times are very helpfull . this indicator is a custom with internal parameters. it can show two times pivot (weekly and daily). you can choose periods total for each time showing pivots.( 1 week , 2 week ,...1day , 2day ,...) when use weekly and daily pivots , it can show you many support and resistance zones. if have proposal comment too me for upgrading indicator.
    FREE
    UPD1 Fibo Levels
    Vitaliy Kuznetsov
    5 (2)
    L'indicatore analizza il numero di candele specificato e costruisce i livelli di Fibonacci in base al massimo e al minimo. Poiché i livelli vengono ricostruiti, siamo interessati al lato destro dell'intervallo. Il prezzo è magnetico rispetto ai livelli e reagisce a un tocco. Utilizzate questo strumento per trovare un punto di ingresso nel trend dopo una correzione. Se a sinistra vediamo che i livelli sono perfettamente al rialzo, allora possiamo presumere di aver trovato la fine del movimento ne
    FREE
    Dynamic Color Fibonacci Indicator This tool is designed to automate the process of drawing and updating Fibonacci levels on your chart. It automatically adjusts to market trends, providing clear visual cues and alerts to help you analyze price movements. Key Features Adaptive Colors: The Fibonacci lines automatically change color to reflect the current trend. They appear blue during uptrends and red during downtrends, giving you an immediate visual sense of the market direction without manual a
    BeST_ Classic Pivot Points is an MT4 Indicator that is based on the widely known and definitely classic Pivot Point of a market prices activity. A pivot point is calculated as an average of significant prices (high,low,close) from the performance of a market in the prior trading period. If the market in the following period trades above the pivot point it is usually evaluated as a bullish sentiment, whereas trading below the pivot point is seen as bearish. A pivot point and the associated suppo
    FREE
    Pivot Points MT4
    KEENBASE SOFTWARE SOLUTIONS
    KT Pivot Points traccia automaticamente i livelli pivot giornalieri, settimanali e mensili su un grafico utilizzando i dati più recenti. I punti pivot sono indicatori ampiamente utilizzati nell'analisi tecnica, soprattutto nel mercato Forex. Caratteristiche Invia avvisi quando il prezzo tocca un livello pivot.  Offre una personalizzazione completa per ciascun tipo di livello pivot.   Mostra chiaramente i livelli pivot giornalieri, settimanali e mensili. Utilizza poche risorse CPU per calcoli p
    The SFT Fibo Smart Pivot indicator is a powerful trading tool based on the Fibonacci Golden Ratio, designed to identify key support and resistance levels in the forex market. This indicator has the ability to pinpoint significant price levels that can serve as entry and exit points for trades. It enables traders to analyze the market more effectively and make well-informed decisions. The indicator uses the Fibonacci Golden Ratio to accurately determine support and resistance levels. These levels
    FREE
    This indicator is stand alone version from  MP Pivot Levels  (All in one) containing Woodie Pivots. Woodie’s pivot points are made up of multiple key levels, calculated from past price points, in order to frame trades in a simplistic manner. The key levels include the ‘pivot’ itself, and multiple support and resistance levels (usually up to three each). Traders use these levels as a guide for future price movements when setting up trades. The pivot : (Previous high + previous low + 2 x previous
    FREE
    VaviStar è un indicatore basato sui ritracciamenti di trend determinati da segmenti ZigZag. Si teorizza, e le statistiche confermano, che le quotazioni reagiscono a determinati livelli di ritracciamento. Molti usano i livelli di ritracciamento di Fibonacci (23.6%, 38.2%, 61.8%). Si suppone che, una volta che il prezzo vada oltre il 61.8% di ritracciamento, si possa già parlare di inversione di trend. Questo indicatore permette di avere comodamente a grafico un segmento dello ZigZag con i relativ
    The Market Structures Pro indicator finds and displays 5 (five) patterns of the Smart Money Concepts (SMC) system on the chart, namely: Break Of Structures (BoS)       Change of character (CHoCH) Equal Highs & Lows Premium, Equilibrium and Discount zones with Fibo grid High-high, Low-low, High-low and Low-high extremes Patterns are displayed for two modes - Swing and Internal and are easily distinguished by color on the chart. Internal mode features higher contrast colors, finer lines, and smal
    Pivot levels Auto V1
    Hafis Mohamed Yacine
    What Is a Pivot Point? A pivot point is a technical analysis indicator, or calculations, used to determine the overall trend of the market over different time frames. The pivot point itself is simply the average of the intraday high and low, and the closing price from the previous trading day. On the subsequent day, trading above the pivot point is thought to indicate ongoing bullish sentiment, while trading below the pivot point indicates bearish sentimen How to Use Pivot Points The very ess
    The   Pivot Point indicator   automatically calculates and displays the pivot point line and support and resistance levels. Pivot can be calculated according to the Classic, Floor, Fibonacci, Woodie, Camarilla or DeMark formula. It is also possible to select the period for calculating the indicator. A trader can choose from daily, weekly, monthly, or user-defined periods. Types of pivots Classic Floor Fibonacci Woodie Camarilla DeMark Main features The indicator shows the current and historic
    FREE
    Unleash Your Trading Potential with the Golden Fractal Cross Are you tired of second-guessing your trades? Do you wish you had a clear, reliable system to guide your decisions? Introducing the Golden Fractal Cross —a powerful and user-friendly indicator designed to help you spot high-probability trading opportunities. This isn't just another average indicator; it's a complete strategy that combines the precision of fractal patterns with the dynamic power of Exponential Moving Averages (EMAs). Th
    FREE
    FiboZag
    Andriy Sydoruk
    Indicator FiboZag - transfer the indicator to the chart and the Fibonacci levels will be built automatically on the last ZigZag turn. The main advantage lies in the correct construction of Fibonacci levels and markup of price levels. Simple, visual and effective use. The indicator is not redrawn and does not lag. Works on all currency pairs and on all timeframes.
    Wa Candle Timer MT4
    Wachinou Lionnel Pyrrhus Sovi Guidi
    5 (1)
    Wa Candle Timer MT4 è un indicatore potente e intuitivo progettato per mostrare il tempo rimanente prima della formazione della prossima candela sul grafico MT4. Aiuta i trader a tenere sotto controllo i tempi di chiusura delle candele per operazioni più precise. Caratteristiche principali : Visualizza il conto alla rovescia della candela in corso Cambia colore quando il tempo scende sotto una soglia impostata Novità nella versione 3.00: avviso personalizzabile al raggiungimento di una
    FREE
    AC Pivot Panel – Your Ultimate Pivot Trading Tool The   AC Pivot Panel   is a powerful yet user-friendly pivot point indicator designed to help traders identify key support and resistance levels with ease. Whether you’re a beginner or an experienced trader, this indicator simplifies pivot trading and enhances your decision-making process. Key Features : Interactive Selection Panel : Easily adjust pivot settings directly on the chart with a compact and intuitive panel. Multiple Pivot Methods : C
    FREE
    NeoBull Breakout Indicator - Professional Breakout Trading Made Easy The NeoBull Breakout Indicator is a powerful technical indicator for MetaTrader 4 , specifically designed for breakout traders. It combines proven Highest High/Lowest Low levels with the SMA 200 trend filter to identify high-probability breakout setups. Main Features: Stepped Highest High (20) Line - Shows the highest high of the last 20 periods as a clear, horizontal line (like in TradingView) Stepped Lowest Low (20) Line - S
    FREE
    Raymond Cloudy Day Indicator for MT4 – Pivot-Based Reversal and Trend Levels Raymond Cloudy Day Indicator is a pivot-based level indicator for MetaTrader 4 (MT4). It was developed by Ngo The Hung based on Raymond’s original idea and is designed to give a structured view of potential reversal zones, trend extensions and support/resistance levels directly on the chart. The default settings are optimised for XAUUSD on the H1 timeframe, but the indicator can be tested and adjusted for other symbols
    ClickDrag disegna linee e sposta facilmente gli oggetti sul grafico. Fare clic e trascinare per tracciare una linea di tendenza. Spostando il mouse in orizzontale si disegna una linea di prezzo. Spostando il mouse in verticale si disegna una linea di data. Le linee e gli oggetti esistenti possono essere spostati facendo clic e trascinando. Visualizza il prezzo e la differenza di tempo tra il punto iniziale e quello finale. Dopo l'avvio, fare clic e trascinare, Scuotere a sinistra e a d
    FREE
    Parabolic Predictor
    Thushara Dissanayake
    Il   Parabolic Predictor   è un potente indicatore tecnico progettato per identificare tendenze precise e filtrare i segnali parabolici tradizionali per prevedere i livelli di ingresso e uscita dal mercato. Con le sue tecniche avanzate, questo indicatore offre una visualizzazione accurata della direzione del trend, livelli di ingresso ottimali e livelli di take profit direttamente sul grafico. Inoltre, è dotato di un sistema di avviso rapido che invia notifiche tramite dispositivi mobili, e-mail
    Possible Price reversals levels - based on  Fibonacci + Support +  Resistance Levels Auto levels drawn based on input index (Bars Count )  ---->>> Price Over 50% Fibo line ---> UP TREND ---> BUY when price drop near Support Lines  ---->>> Price Down 50% Fibo line ---> DOWN TREND ---> SELL when price goes up  near Resistance Lines  --->>> The more close price levels ----> the more possibility for price reversals --->>> are you a scalper --> try it on M1 charts with big index like 5000 bars  or
    This indicator is based on Mr. Mark Fisher's ACD strategy, based on the book "The Logical Trader." - OR lines - A lines - C lines - Daily pivot range - N days pivot range - Customizable trading session - Drawing OR with the desired time Drawing levels A and C based on daily ATR or constant number - Possibility to display daily and last day pivots in color zone - Displaying the status of daily PMAs (layer 4) in the corner of the chart - Show the order of daily pivot placement with multi-day pi
    FREE
    OrionFX AI Market Scanner - Your Ultimate Signal Dashboard Stop switching between dozens of charts. See the entire forex market from a single, professional interface. OrionFX is a professional-grade market scanner that combines a powerful 24-instrument dashboard with a high-confluence, five-indicator signal strategy. Designed for traders who demand precision and clarity, this indicator scans the market in real-time, identifying the highest-probability trade setups where all strategic components
    Description: The indicator measures, through the zigzag indicator, the levels of trend or correction. It shows in the chart the levels of each low or high detected. KEY LINKS:   How to Install  –  Frequent Questions  -  All Products  How is this indicator useful? This indicator determines, depending on Zigzag parameter if a trend is beginning, developing, or ending This indicator determines the direction of the trend Components Levels as positive or negative numbers, depending on the direction
    FREE
    The indicator draws trend lines based on Thomas Demark algorithm. It draws lines from different timeframes on one chart. The timeframes can be higher than or equal to the timeframe of the chart, on which the indicator is used. The indicator considers breakthrough qualifiers (if the conditions are met, an additional symbol appears in the place of the breakthrough) and draws approximate targets (target line above/below the current prices) according to Demark algorithm. Recommended timeframes for t
    TPSproTREND PrO
    Roman Podpora
    4.69 (26)
    Acquista TREND PRO ora e ricevi gratuitamente un altro indicatore di tendenza avanzato Per riceverlo, scrivi nei messaggi privati. VERSION MT5        —        ИНСТРУКЦИЯ RUS           —        INSTRUCTIONS  ENG Caratteristiche principali: Segnale di ingresso accurato senza rendering! Una volta che il segnale appare, rimane rilevante. Questa è una differenza importante rispetto agli indicatori di ridisegno, che forniscono un segnale e poi lo modificano, con conseguente potenziale perdita dei f
    NO REPAINT ADVANCED CHART PATTERN INDICATOR By definition, a price ( chart)  pattern is a recognizable configuration of price movement that is identified using a series of  trendlines  and/or curves. When a price pattern signals a change in trend direction, it is known as a reversal pattern; a continuation pattern occurs when the trend continues in its existing direction following a brief pause. Advanced Chart Pattern Tracker is designed to find the MOST ACCURATE patterns. A special script is a
    Market Structure Indicator BOS CHOCH MT4 The BOS-CHOCH Market Structure Indicator is an ICT-inspired tool developed for MetaTrader 4 (MT4). It is designed to help traders who follow ICT methodologies identify shifts in both dominant and secondary market trends. By pinpointing structural breaks and changes in market character, this indicator enhances technical analysis and supports more accurate trading decisions. Market Structure Indicator (BOS-CHOCH) Overview Below are the general details and
    Better Moving Average
    Vincent Jose Proenca
    STRUCTURAL TREND LINES - MT4 Indicator Simple indicator that automatically draws trend lines based on market structure. Features: - 3 degrees of structure detection (short, medium, long term) - Configurable swing strength for each degree - Single color per degree for clean visualization - Adjustable number of lines per degree - Customizable colors and line widths How it works: The indicator identifies swing highs and lows based on the strength parameter, then connects these points to create t
    FREE
    Squeeze Indicator
    Federico Quintieri
    The one and only indicator that identifies Volatility Squeeze. A Squeeze is a compression of volatility in the market. If this compression of volatility reaches a certain percentage it means that the market could explode in moments. I highly recommend using the indicator in conjunction with the economic calendar. If there are important news and the indicator shows a  BLUE HISTOGRAM  on the exchange in question, a sign of a powerful compression of volatility. Then get ready to grasp the next
    FREE
    Gli utenti di questo prodotto hanno anche acquistato
    Gann Made Easy
    Oleg Rodin
    4.82 (148)
    Gann Made Easy è un sistema di trading Forex professionale e facile da usare che si basa sui migliori principi del trading utilizzando la teoria di mr. WD Gann. L'indicatore fornisce segnali ACQUISTA e VENDI accurati, inclusi i livelli di Stop Loss e Take Profit. Puoi fare trading anche in movimento utilizzando le notifiche PUSH. CONTATTATEMI DOPO L'ACQUISTO PER RICEVERE CONSIGLI DI TRADING, BONUS E L'ASSISTENTE EA GANN MADE EASY GRATUITAMENTE! Probabilmente hai già sentito parlare molte volte d
    M1 Sniper
    Oleg Rodin
    4.89 (18)
    M1 SNIPER è un sistema di indicatori di trading facile da usare. Si tratta di un indicatore a freccia progettato per l'intervallo temporale M1. L'indicatore può essere utilizzato come sistema autonomo per lo scalping sull'intervallo temporale M1 e come parte del tuo sistema di trading esistente. Sebbene questo sistema di trading sia stato progettato specificamente per il trading sull'intervallo temporale M1, può comunque essere utilizzato anche con altri intervalli temporali. Inizialmente ho pro
    Game Changer Indicator
    Vasiliy Strukov
    5 (7)
    Game Changer è un indicatore di tendenza rivoluzionario, progettato per essere utilizzato su qualsiasi strumento finanziario, per trasformare il tuo Metatrader in un potente analizzatore di trend. L'indicatore non ridisegna e non subisce ritardi. Funziona su qualsiasi intervallo temporale e aiuta a identificare i trend, segnala potenziali inversioni, funge da meccanismo di trailing stop e fornisce avvisi in tempo reale per risposte tempestive del mercato. Che tu sia un trader esperto, un profess
    Meravith
    Ivan Stefanov
    5 (1)
    L'indicatore analizza il volume da ogni punto e calcola i livelli di esaurimento del mercato per quel volume. È composto da tre linee: Linea di esaurimento del volume rialzista Linea di esaurimento del volume ribassista Una linea che indica la tendenza del mercato. Questa linea cambia colore per riflettere se il mercato è rialzista o ribassista. Puoi analizzare il mercato da qualsiasi punto di partenza tu scelga. Una volta che una linea di esaurimento del volume è raggiunta, identifica un nuovo
    Scalper Inside PRO
    Alexey Minkov
    4.74 (69)
    An exclusive indicator that utilizes an innovative algorithm to swiftly and accurately determine the market trend. The indicator automatically calculates opening, closing, and profit levels, providing detailed trading statistics. With these features, you can choose the most appropriate trading instrument for the current market conditions. Additionally, you can easily integrate your own arrow indicators into Scalper Inside Pro to quickly evaluate their statistics and profitability. Scalper Inside
    Attualmente 20% di sconto! La soluzione migliore per ogni principiante o trader esperto! Questo software per cruscotti funziona su 28 coppie di valute. Si basa su 2 dei nostri indicatori principali (Advanced Currency Strength 28 e Advanced Currency Impulse). Offre un'ottima panoramica dell'intero mercato Forex. Mostra i valori di forza delle valute avanzate, la velocità di movimento delle valute e i segnali per 28 coppie Forex in tutti i (9) timeframe. Immaginate come migliorerà il vostro tra
    Currency Strength Exotics
    Bernhard Schweigert
    4.88 (33)
    ATTUALMENTE SCONTATO DEL 20%! La soluzione migliore per qualsiasi principiante o trader esperto! Questo indicatore è specializzato nel mostrare la forza della valuta per qualsiasi simbolo come coppie esotiche, materie prime, indici o futures. È il primo nel suo genere, qualsiasi simbolo può essere aggiunto alla nona riga per mostrare la vera forza della valuta di Oro, Argento, Petrolio, DAX, US30, MXN, TRY, CNH ecc. Si tratta di uno strumento di trading unico, di alta qualità e conveniente pe
    Advanced Supply Demand
    Bernhard Schweigert
    4.91 (296)
    Year-End Trading SALE – Save 50% While It Lasts! Best Solution for any Newbie or Expert Trader! This indicator is a unique, high quality and affordable trading tool because we have incorporated a number of proprietary features and a new formula. With this update, you will be able to show double timeframe zones. You will not only be able to show a higher TF but to show both, the chart TF, PLUS the higher TF: SHOWING NESTED ZONES. All Supply Demand traders will love it. :) Important Information Re
    Trend indicator AI
    Ramil Minniakhmetov
    5 (74)
    Trend Ai indicator è un ottimo strumento che migliorerà l'analisi di mercato di un trader combinando l'identificazione della tendenza con punti di ingresso utilizzabili e avvisi di inversione. Questo indicatore consente agli utenti di navigare nelle complessità del mercato forex con fiducia e precisione Oltre ai segnali primari, l'indicatore Ai di tendenza identifica i punti di ingresso secondari che si presentano durante i pullback o i ritracciamenti, consentendo ai trader di capitalizzare le
    M1 Arrow
    Oleg Rodin
    5 (19)
    Una strategia intraday basata su due principi fondamentali del mercato. L'algoritmo si basa sull'analisi dei volumi e delle onde di prezzo utilizzando filtri aggiuntivi. L'algoritmo intelligente dell'indicatore fornisce un segnale solo quando due fattori di mercato si combinano in uno solo. L'indicatore calcola le onde di un certo intervallo sul grafico M1 utilizzando i dati dell'intervallo di tempo più alto. E per confermare l'onda, l'indicatore utilizza l'analisi per volume. Questo indicatore
    Se acquisti questo indicatore, riceverai il mio Trade Manager Professionale   + EA  GRATUITAMENTE. Innanzitutto è importante sottolineare che questo sistema di trading è un indicatore Non-Repainting, Non-Redrawing e Non-Lagging, il che lo rende ideale sia per il trading manuale che per quello automatico. Corso online, manuale e download di preset. Il "Sistema di Trading Smart Trend MT5" è una soluzione completa pensata sia per i trader principianti che per quelli esperti. Combina oltre 10 indic
    Questo indicatore è un indicatore per l'analisi automatica delle onde perfetto per il trading pratico! Caso... Nota:   non sono abituato a usare nomi occidentali per la classificazione delle onde a causa dell'influenza della convenzione di denominazione di Tang Lun (Tang Zhong Shuo Zen), ho chiamato l'onda base come   penna   e la banda dell'onda secondaria come   segmento   At allo stesso tempo, il segmento ha la direzione del trend. La denominazione   è principalmente segmento di trend   (que
    PRO Renko System
    Oleg Rodin
    5 (29)
    PRO Renko System è un sistema di trading altamente accurato appositamente progettato per il trading di grafici RENKO. Questo è un sistema universale che può essere applicato a vari strumenti di trading. Il sistema neutralizza efficacemente il cosiddetto rumore di mercato che consente di accedere a segnali di inversione accurati. L'indicatore è molto facile da usare e ha un solo parametro responsabile della generazione del segnale. Puoi facilmente adattare lo strumento a qualsiasi strumento di
    FX Power MT4 NG
    Daniel Stein
    4.95 (20)
    FX Power: Analizza la Forza delle Valute per Decisioni di Trading Più Intelligenti Panoramica FX Power è lo strumento essenziale per comprendere la reale forza delle principali valute e dell'oro in qualsiasi condizione di mercato. Identificando le valute forti da comprare e quelle deboli da vendere, FX Power semplifica le decisioni di trading e rivela opportunità ad alta probabilità. Che tu segua le tendenze o anticipi inversioni utilizzando valori estremi di Delta, questo strumento si adatta
    SMC Easy Signal
    Mohamed Hassan
    4.73 (15)
    3 copies left at $65, next price is $120 SMC Easy Signal was built to remove the confusion around the smart money concept by turning structural shifts like BOS (Break of Structure) and CHoCH (Change of Character) into simple buy and sell trading signals. It simplifies market structure trading by automatically identifying breakouts and reversals as they happen, allowing traders to focus on execution rather than analysis. Whether the market is continuing its trend or preparing to reverse, the i
    Looking for a powerful yet lightweight swing detector that accurately identifies market structure turning points? Want clear, reliable buy and sell signals that work across any timeframe and any instrument? Buy Sell Arrow MT Swing is built exactly for that — precision swing detection made simple and effective. This indicator identifies Higher Highs (HH) , Higher Lows (HL) , Lower Highs (LH) , and Lower Lows (LL) with remarkable clarity. It is designed to help traders easily visualize market str
    Dynamic Forex28 Navigator
    Bernhard Schweigert
    4.43 (7)
    Dynamic Forex28 Navigator - Lo strumento di trading Forex di nuova generazione. ATTUALMENTE SCONTATO DEL 49%. Dynamic Forex28 Navigator è l'evoluzione dei nostri indicatori popolari di lunga data, che combinano la potenza di tre in uno: Advanced Currency Strength28 Indicator (695 recensioni) + Advanced Currency IMPULSE con ALERT (520 recensioni) + CS28 Combo Signals (Bonus). Dettagli sull'indicatore https://www.mql5.com/en/blogs/post/758844 Cosa offre l'indicatore di forza di nuova generazione?
    ACB Breakout Arrows
    KEENBASE SOFTWARE SOLUTIONS
    4.15 (34)
    L’indicatore ACB Breakout Arrows fornisce un segnale di ingresso cruciale rilevando uno specifico pattern di breakout. Monitora costantemente il grafico alla ricerca di un momentum stabile in una direzione e segnala con precisione l’ingresso poco prima del movimento principale.  Ottieni lo scanner multi-simbolo e multi-timeframe qui - Scanner per ACB Breakout Arrows MT4 Caratteristiche principali Lo Stop Loss e il Take Profit sono calcolati automaticamente dall'indicatore. Include una dashboard
    Currency Strength Wizard è un indicatore molto potente che ti fornisce una soluzione all-in-one per un trading di successo. L'indicatore calcola la potenza di questa o quella coppia forex utilizzando i dati di tutte le valute su più intervalli di tempo. Questi dati sono rappresentati in una forma di indice di valuta facile da usare e linee elettriche di valuta che puoi utilizzare per vedere il potere di questa o quella valuta. Tutto ciò di cui hai bisogno è collegare l'indicatore al grafico che
    ATTUALMENTE SCONTATO DEL 26% La soluzione migliore per ogni principiante o trader esperto! Questo indicatore è uno strumento di trading unico, di alta qualità e conveniente perché abbiamo incorporato una serie di caratteristiche proprietarie e una nuova formula. Con un solo grafico è possibile leggere la forza delle valute per 28 coppie Forex! Immaginate come migliorerà il vostro trading perché sarete in grado di individuare l'esatto punto di innesco di una nuova tendenza o di un'opportunità
    Trend Screener
    STE S.S.COMPANY
    4.79 (95)
    Indicatore di tendenza, soluzione unica rivoluzionaria per il trading di tendenze e il filtraggio con tutte le importanti funzionalità di tendenza integrate in un unico strumento! È un indicatore multi-timeframe e multi-valuta al 100% non ridipingibile che può essere utilizzato su tutti i simboli/strumenti: forex, materie prime, criptovalute, indici e azioni. OFFERTA A TEMPO LIMITATO: l'indicatore di screening di supporto e resistenza è disponibile a soli 50$ e a vita. (Prezzo originale 250$) (o
    SMC Blast Signal with FVG, BOS and trend Breakout The SMC Blast Signal  is a  Precise trading system for Meta Trader 4 that uses Smart Money Concepts (SMC) , including Fair Value Gaps (FVG) and Break of Structure (BOS) , to identify high-probability trades. It incorporates a Trend Filter using a higher timeframe moving average, ensuring trades align with the prevailing market trend. TREND SIGNAL-FVG DETECTION-BOS DETECTION-TRADE CONFIRMED-Precise Signal entries on m15  Best TF-M15 AND ABOVE Be
    Day Trader Master è un sistema di trading completo per i day trader. Le systeme se compose de due indicatori. Un indicar est un signal fléché pour acheter et vendre. C'est l'indicateur de fleche que vous obtenez. Je vous fournirai le deuxième indicaur gratuitement. Le deuxième indicaur è un indicaur de tendance spécialement conçu pour être utilisé conjointement avec ces flèches. GLI INDICATORI NON SI RIPETONO E NON RITARDANO! Usare questo sistema è molto semplice. Devi solo seguire i segnali del
    Market Structure Break Out
    Ashkan Hazegh Nikrou
    5 (8)
    Il Market Structure Break Out (MSB) è uno strumento avanzato progettato per MT4 e MT5 che aiuta i trader a osservare i movimenti del mercato come strutture ordinate. L’indicatore fornisce segnali di trading tramite frecce e avvisi , sia nella direzione del trend che in quella inversa. Una delle caratteristiche più importanti di questo prodotto è il disegno di zone di offerta e domanda che non vengono rimosse . Inoltre, la funzionalità di backtest in tempo reale permette ai trader di valutare le
    Entry Points Pro
    Yury Orlov
    4.62 (172)
    Indicatore top per MT5 che fornisce segnali accurati per entrare in un trade senza riverniciare! Può essere applicato a qualsiasi attività finanziaria: forex, criptovalute, metalli, azioni, indici.  La versione MT5 è qui Fornirà segnali di trading piuttosto precisi e ti dirà quando è meglio aprire un trade e chiuderlo. Guarda il video (6:22) con un esempio di elaborazione di un solo segnale che ha ripagato l'indicatore! La maggior parte dei trader migliora i propri risultati di trading dura
    Hidden Cycles
    Lev Vladimirovic Marushkin
    5 (1)
    Black Friday Sale – Limited Time! Grab Hidden Cycles for only $129 (regular price $179 ). This is your chance to boost your strategy with a powerful, easy-to-use cycle-based trading tool. Offer ends soon — don’t miss it! Based on Universal Laws — NOT Some Guy’s Algorithm: Let the market adjust to the Hidden Cycles Geometry — not the other way around. Most indicators are based on a man-made formula. They often lag, fail over time, or need constant re-optimization.  Hidden Cycles is different.
    Adaptive Volatility Range [AVR] is a powerful tool for identifying key trend reversal points. AVR accurately reflects the Average True Range (ATR) of volatility, taking into account the Volume-Weighted Average Price (VWAP). The indicator adapts to any market volatility by calculating the average volatility over a specific period, ensuring a stable rate of profitable trades. You receive not just an indicator but a professional automated trading system , AVR-EA . Advantages: Automated Trading Sys
    Advanced Currency IMPULSE with ALERT
    Bernhard Schweigert
    4.91 (489)
    ATTUALMENTE SCONTATO DEL 31%! La soluzione migliore per ogni principiante o trader esperto! Questo indicatore è uno strumento di trading unico, di alta qualità e conveniente perché abbiamo incorporato una serie di caratteristiche proprietarie e una formula segreta. Con un solo grafico fornisce avvisi per tutte le 28 coppie di valute. Immaginate come migliorerà il vostro trading perché sarete in grado di individuare l'esatto punto di innesco di una nuova tendenza o opportunità di scalping! Co
    Binary Trader Master è un indicatore basato su frecce che prevede la chiusura della candela. Fa la sua analisi all'interno di una sola candela. Quando la candela si apre sono necessari alcuni istanti per fare l'analisi e prevedere la chiusura della candela. Quindi genera un segnale. L'indicatore ti consente anche di applicare limiti di tempo che può utilizzare per l'analisi, il che significa che puoi effettivamente dire all'indicatore quanto tempo è consentito per l'analisi all'interno della can
    Royal Wave Pro M4
    Vahidreza Heidar Gholami
    5 (3)
    Royal Wave is a Trend-Power oscillator which has been programmed to locate and signal low-risk entry and exit zones. Its core algorithm statistically analyzes the market and generates trading signals for overbought, oversold and low volatile areas. By using a well-designed alerting system, this indicator makes it easier to make proper decisions regarding where to enter and where to exit trades. Features Trend-Power Algorithm Low risk Entry Zones and Exit Zones Predictions for Overbought and Over
    Altri dall’autore
    Offerta speciale : ALL TOOLS , solo $35 ciascuno! Nuovi strumenti   saranno   $30   per la   prima settimana   o per   i primi 3 acquisti !  Trading Tools Channel on MQL5 : Unisciti al mio canale MQL5 per ricevere le ultime novità Volumatic Support/Resistance Levels Scanner è un indicatore di supporto e resistenza che aggiunge il contesto del volume alla struttura dei prezzi. Mostrando come l’attività di trading si raggruppa attorno ai pivot recenti, aiuta gli utenti a vedere dove l’interesse d
    Special offer : ALL TOOLS , just $35 each! New tools   will be   $30   for the   first week   or the   first 3 purchases !  Trading Tools Channel on MQL5 : Join my MQL5 channel to update the latest news from me Scopri la potenza del concetto di Inversion Fair Value Gap (IFVG) di ICT con l’ Indicatore Inversion Fair Value Gaps ! Questo strumento all’avanguardia porta i Fair Value Gaps (FVG) a un livello successivo, identificando e visualizzando le zone di FVG invertite – aree chiave di supporto
    Special offer : ALL TOOLS , just $35 each! New tools   will be   $30   for the   first week   or the   first 3 purchases !  Trading Tools Channel on MQL5 : Join my MQL5 channel to update the latest news from me Presentiamo il SuperTrend ATR Multiplier with Scanner for MT5 – uno strumento versatile e potente progettato per aiutarti a essere sempre un passo avanti alle tendenze di mercato, con funzionalità personalizzabili e avvisi in tempo reale. Basato sulla logica comprovata del SuperTrend di
    FREE
    Supertrend Fakeout MT5
    Duc Hoan Nguyen
    5 (3)
    Special offer : ALL TOOLS , just $35 each! New tools   will be   $30   for the   first week   or the   first 3 purchases !  Trading Tools Channel on MQL5 : Join my MQL5 channel to update the latest news from me L'indicatore Supertrend Fakeout è una versione migliorata del classico indicatore Supertrend , progettata per fornire segnali di tendenza più affidabili. Integrando funzionalità avanzate come Fakeout Index Limit e Fakeout ATR Mult , questo indicatore aiuta a filtrare i falsi segnali di i
    FREE
    Special offer : ALL TOOLS , just $35 each! New tools   will be   $30   for the   first week   or the   first 3 purchases !  Trading Tools Channel on MQL5 : Join my MQL5 channel to update the latest news from me Presentiamo il rivoluzionario RSI Kernel Optimized with Scanner per MT5, uno strumento all'avanguardia che ridefinisce l'analisi RSI tradizionale integrando il potente algoritmo di stima della densità del nucleo (KDE). Questo indicatore avanzato non solo fornisce informazioni in tempo re
    Offerta speciale : ALL TOOLS , solo $35 ciascuno! New tools   will be   $30   for the   first week   or the   first 3 purchases !  Trading Tools Channel on MQL5 : Join my MQL5 channel to update the latest news from me In un ambiente di trading volatile, uno strumento di analisi potente e intuitivo può aiutarti a cogliere rapidamente le opportunità. Fibonacci Trend Scanner non solo integra le funzioni tradizionali dell’indicatore Fibonacci e SuperTrend, ma amplia anche le funzionalità con la sca
    Special offer : ALL TOOLS , just $35 each! New tools   will be   $30   for the   first week   or the   first 3 purchases !  Trading Tools Channel on MQL5 : Join my MQL5 channel to update the latest news from me Scopri la potenza dell'IA con il SuperTrend AI Clustering con Scanner , uno strumento di trading rivoluzionario per MetaTrader4 (MT4). Questo indicatore ridefinisce l'analisi del mercato combinando il clustering K-means con l'ampio indicatore SuperTrend, dando ai trader un vantaggio nell
    Special offer : ALL TOOLS , just $35 each! New tools   will be   $30   for the   first week   or the   first 3 purchases !  Trading Tools Channel on MQL5 : Join my MQL5 channel to update the latest news from me Massimizza il tuo vantaggio nel trading con Follow Line MT5 con Scanner, un indicatore avanzato basato sulla volatilità progettato per trader seri. Questo strumento combina la potenza delle Bande di Bollinger con impostazioni personalizzabili, offrendo intuizioni precise sui movimenti de
    FREE
    Special offer : ALL TOOLS , just $35 each! New tools   will be   $30   for the   first week   or the   first 3 purchases !  Trading Tools Channel on MQL5 : Join my MQL5 channel to update the latest news from me Nell'ambiente in continua evoluzione del trading finanziario, identificare e analizzare accuratamente i livelli di supporto e resistenza è essenziale per prendere decisioni di investimento informate. SnR Retest and Break Multi-Timeframe è un indicatore di supporto e resistenza progettato
    Special offer : ALL TOOLS , just $35 each! New tools   will be   $30   for the   first week   or the   first 3 purchases !  Trading Tools Channel on MQL5 : Join my MQL5 channel to update the latest news from me Il Fibonacci Confluence Toolkit Multi-Timeframe è uno strumento avanzato di analisi tecnica progettato per trader professionisti, che aiuta a identificare potenziali zone di inversione del prezzo combinando segnali e modelli chiave del mercato. Con capacità di visualizzazione multi-timef
    Special offer : ALL TOOLS , just $35 each! New tools   will be   $30   for the   first week   or the   first 3 purchases !  Trading Tools Channel on MQL5 : Join my MQL5 channel to update the latest news from me Scopri la potenza del concetto di Inversion Fair Value Gap (IFVG) di ICT con l’ Indicatore Inversion Fair Value Gaps ! Questo strumento all’avanguardia porta i Fair Value Gaps (FVG) a un livello successivo, identificando e visualizzando le zone di FVG invertite – aree chiave di supporto
    Special offer : ALL TOOLS , just $35 each! New tools   will be   $30   for the   first week   or the   first 3 purchases !  Trading Tools Channel on MQL5 : Join my MQL5 channel to update the latest news from me L'indicatore Volumetric Order Blocks Multi Timeframe è uno strumento potente progettato per i trader che cercano approfondimenti sul comportamento del mercato identificando le aree di prezzo chiave dove i partecipanti significativi accumulano ordini. Queste aree, note come blocchi d'ordi
    OA SnR Power MT5
    Duc Hoan Nguyen
    5 (2)
    Special offer : ALL TOOLS , just $35 each! New tools   will be   $30   for the   first week   or the   first 3 purchases !  Trading Tools Channel on MQL5 : Join my MQL5 channel to update the latest news from me Panoramica OA SnR Power è uno strumento potente progettato per aiutare i trader a identificare e valutare la forza dei livelli di supporto e resistenza. Integrando fattori chiave come il volume di trading, la frequenza dei rimbalzi e il numero di test, questo indicatore offre una vision
    FREE
    Special offer : ALL TOOLS , just $35 each! New tools   will be   $30   for the   first week   or the   first 3 purchases !  Trading Tools Channel on MQL5 : Join my MQL5 channel to update the latest news from me L'indicatore Liquidity Pools è uno strumento avanzato che identifica e segna potenziali zone di liquidità sul grafico analizzando aree di massimo e minimo con frequenti tocchi di stoppino, insieme al numero di rivisitazioni e al volume scambiato all'interno di ciascuna zona. Questo strum
    Special offer : ALL TOOLS , just $35 each! New tools   will be   $30   for the   first week   or the   first 3 purchases !  Trading Tools Channel on MQL5 : Join my MQL5 channel to update the latest news from me I. Introduzione Market Structure Trend Targets Scanner è uno strumento potente per analizzare le tendenze di mercato, identificare i punti di breakout e gestire il rischio tramite uno stop loss dinamico. Tracciando i massimi e i minimi precedenti per individuare i breakout, questo strum
    Special offer : ALL TOOLS , just $35 each! New tools   will be   $30   for the   first week   or the   first 3 purchases !  Trading Tools Channel on MQL5 : Join my MQL5 channel to update the latest news from me L'indicatore Volumetric Order Blocks Multi Timeframe è uno strumento potente progettato per i trader che cercano approfondimenti sul comportamento del mercato identificando le aree di prezzo chiave dove i partecipanti significativi accumulano ordini. Queste aree, note come blocchi d'ordi
    Volumatic VIDyA MT4
    Duc Hoan Nguyen
    4.5 (4)
    Special offer : ALL TOOLS , just $35 each! New tools   will be   $30   for the   first week   or the   first 3 purchases !  Trading Tools Channel on MQL5 : Join my MQL5 channel to update the latest news from me Volumatic VIDYA (Variable Index Dynamic Average) è un indicatore avanzato progettato per monitorare le tendenze e analizzare la pressione di acquisto e vendita in ogni fase di una tendenza. Utilizzando il Variable Index Dynamic Average come tecnica principale di smorzamento dinamico, que
    Special offer : ALL TOOLS , just $35 each! New tools   will be   $30   for the   first week   or the   first 3 purchases !  Trading Tools Channel on MQL5 : Join my MQL5 channel to update the latest news from me Trendlines with Breaks Scanner è uno strumento di trading all’avanguardia progettato per aiutare i trader a identificare tendenze critiche e rilevare rotture in tempo reale. Con linee di tendenza generate automaticamente basate su punti pivot, questo indicatore consente ai trader di cogl
    Liquidity Pools MT4
    Duc Hoan Nguyen
    5 (1)
    Special offer : ALL TOOLS , just $35 each! New tools   will be   $30   for the   first week   or the   first 3 purchases !  Trading Tools Channel on MQL5 : Join my MQL5 channel to update the latest news from me L'indicatore Liquidity Pools è uno strumento avanzato che identifica e segna potenziali zone di liquidità sul grafico analizzando aree di massimo e minimo con frequenti tocchi di stoppino, insieme al numero di rivisitazioni e al volume scambiato all'interno di ciascuna zona. Questo strum
    Supertrend Fakeout MT4
    Duc Hoan Nguyen
    4.25 (4)
    Special offer : ALL TOOLS , just $35 each! New tools   will be   $30   for the   first week   or the   first 3 purchases !  Trading Tools Channel on MQL5 : Join my MQL5 channel to update the latest news from me L'indicatore Supertrend Fakeout è una versione migliorata del classico indicatore Supertrend , progettata per fornire segnali di tendenza più affidabili. Integrando funzionalità avanzate come Fakeout Index Limit e Fakeout ATR Mult , questo indicatore aiuta a filtrare i falsi segnali di i
    FREE
    Special offer : ALL TOOLS , just $35 each! New tools   will be   $30   for the   first week   or the   first 3 purchases !  Trading Tools Channel on MQL5 : Join my MQL5 channel to update the latest news from me Trendlines with Breaks Scanner è uno strumento di trading all’avanguardia progettato per aiutare i trader a identificare tendenze critiche e rilevare rotture in tempo reale. Con linee di tendenza generate automaticamente basate su punti pivot, questo indicatore consente ai trader di cogl
    Special offer : ALL TOOLS , just $35 each! New tools   will be   $30   for the   first week   or the   first 3 purchases !  Trading Tools Channel on MQL5 : Join my MQL5 channel to update the latest news from me Supply Demand Retest and Break Multi Timeframe , questo strumento traccia le zone di offerta e domanda basate su candele a forte momentum, permettendoti di identificare queste zone su più timeframe utilizzando la funzione   timeframe selector   . Con etichette di retest e break, insieme
    Special offer : ALL TOOLS , just $35 each! New tools   will be   $30   for the   first week   or the   first 3 purchases !  Trading Tools Channel on MQL5 : Join my MQL5 channel to update the latest news from me Scopri la potenza dell'IA con il SuperTrend AI Clustering MT5 con Scanner , uno strumento di trading rivoluzionario per MetaTrader 5 (MT5). Questo indicatore ridefinisce l'analisi del mercato combinando il clustering K-means con l'ampio indicatore SuperTrend, dando ai trader un vantaggio
    Special offer : ALL TOOLS , just $35 each! New tools   will be   $30   for the   first week   or the   first 3 purchases !  Trading Tools Channel on MQL5 : Join my MQL5 channel to update the latest news from me Supply Demand Retest and Break Multi Timeframe , questo strumento traccia le zone di offerta e domanda basate su candele a forte momentum, permettendoti di identificare queste zone su più timeframe utilizzando la funzione   timeframe selector   . Con etichette di retest e break, insieme
    Special offer : ALL TOOLS , just $35 each! New tools   will be   $30   for the   first week   or the   first 3 purchases !  Trading Tools Channel on MQL5 : Join my MQL5 channel to update the latest news from me L'indicatore del modello di inversione a tre barre offre uno strumento potente per i trader, identificando e evidenziando automaticamente i modelli di inversione a tre barre direttamente sul grafico dei prezzi. Questo indicatore è una risorsa preziosa per individuare potenziali inversion
    Volumatic VIDyA MT5
    Duc Hoan Nguyen
    5 (2)
    Special offer : ALL TOOLS , just $35 each! New tools   will be   $30   for the   first week   or the   first 3 purchases !  Trading Tools Channel on MQL5 : Join my MQL5 channel to update the latest news from me Volumatic VIDYA (Variable Index Dynamic Average) è un indicatore avanzato progettato per monitorare le tendenze e analizzare la pressione di acquisto e vendita in ogni fase di una tendenza. Utilizzando il Variable Index Dynamic Average come tecnica principale di smorzamento dinamico, que
    Special offer : ALL TOOLS , just $35 each! New tools   will be   $30   for the   first week   or the   first 3 purchases !  Trading Tools Channel on MQL5 : Join my MQL5 channel to update the latest news from me L'indicatore Trend Levels è meticolosamente progettato per individuare livelli di trend critici — Alto, Medio e Basso — durante i movimenti di mercato. Con calcoli in tempo reale basati sui valori più alti, più bassi e medi su un periodo di lookback personalizzabile, questo strumento for
    AI Channels MT4
    Duc Hoan Nguyen
    5 (1)
    Special offer : ALL TOOLS , just $35 each! New tools   will be   $30   for the   first week   or the   first 3 purchases !  Trading Tools Channel on MQL5 : Join my MQL5 channel to update the latest news from me L'indicatore AI Channels utilizza il clustering K-means mobile —una potente tecnica di apprendimento automatico nell'analisi dei cluster—per fornire intuizioni in tempo reale sulle tendenze di prezzo sottostanti. Questo indicatore crea canali adattivi basati su dati di prezzo raggruppati
    FREE
    Special offer : ALL TOOLS , just $35 each! New tools   will be   $30   for the   first week   or the   first 3 purchases !  Trading Tools Channel on MQL5 : Join my MQL5 channel to update the latest news from me Presentiamo il SuperTrend by Kivanc Ozbilgic with Scanner – uno strumento versatile e potente progettato per aiutarti a essere sempre un passo avanti alle tendenze di mercato, con funzionalità personalizzabili e avvisi in tempo reale.  Puoi regolare il metodo di calcolo dell' ATR tra RMA
    FREE
    AI Channels MT5
    Duc Hoan Nguyen
    5 (1)
    Special offer : ALL TOOLS , just $35 each! New tools   will be   $30   for the   first week   or the   first 3 purchases !  Trading Tools Channel on MQL5 : Join my MQL5 channel to update the latest news from me L'indicatore AI Channels utilizza il clustering K-means mobile —una potente tecnica di apprendimento automatico nell'analisi dei cluster—per fornire intuizioni in tempo reale sulle tendenze di prezzo sottostanti. Questo indicatore crea canali adattivi basati su dati di prezzo raggruppati
    FREE
    Filtro:
    Nessuna recensione
    Rispondi alla recensione