MetaTrader 5용 기술 지표 - 28
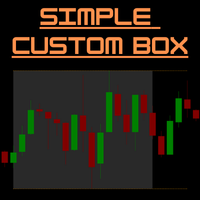
SimpleCustomBox – MT5 세션 박스 및 고가/저가 라인 표시기 개요:
SimpleCustomBox는 MetaTrader 5용으로 설계된 강력하고 사용하기 쉬운 트레이딩 인디케이터입니다.
차트에서 특정 거래 세션을 시각적으로 강조 표시할 수 있으며, 사용자가 원하는 시간대를 설정하고 해당 세션의 고가와 저가를 즉시 확인할 수 있습니다.
명확한 시각적 경계선을 통해 더 스마트한 거래 결정을 내릴 수 있습니다.
데이 트레이더, 스캘퍼 및 단기 가격 패턴을 중시하는 모든 트레이더에게 적합합니다. 주요 기능: 사용자 지정 세션 시간: 차트에서 임의의 시간대(예: 02:00 – 06:00)를 색상 직사각형으로 강조 표시. 동적 세션 박스: 매일 자동으로 업데이트되며, 과거 여러 거래일을 표시하여 히스토리 분석 가능. 고가/저가 라인: 세션 범위의 상단과 하단 라인을 그리며, 사용자 지정 시간(예: 14:00)까지 연장 가능. 시각적 사용자화: 박스 색상, 라인 색상, 두께, 스
Mean Reversion Probability – 통계적 반전 지표 간략 설명
기관급 수준의 지표로, 과거 초과 확장 데이터를 기반으로 200 이동평균선(MA200)으로의 회귀 확률을 통계적으로 계산합니다. 시장 피로 구간을 정량적으로 탐지합니다. 주요 기능
고급 통계 분석 – 500개 이상의 과거 확장 데이터를 사용하여 실제 확률 계산
확률 점수 (0–99%) – 평균 회귀 가능성을 정밀 수치화
피로 탐지 – 초과 확장의 지속 시간 및 강도 측정
다중 자산 표준화 – Forex, 지수, 금, 암호화폐, CFD 자동 적용
스마트 알림 – 드물지만 매우 신뢰성 높은 신호 (확률 >80%, 기간 >15봉)
기관형 인터페이스 – 깔끔하고 계층적인 구조로 빠른 판독 가능 방법론
실시간 분석 항목: 가격/MA200 표준화 거리 (ATR 기준) 마지막 회귀 이후의 확장 기간 최대 확장까지의 시간 과거 평균값과 비교 확률 계산: 거리 점수 (최대 60%): 현재 값 vs 과거 비율 기간
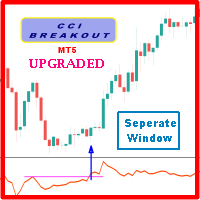
Probability emerges to record higher prices when Commodity Channel Index breaks out oscillator historical resistance level when exhibit overbought values. Since, oscillator breakout of support and resistance have similar effect as price breaks support and resistance levels, therefore, its highly advised to confirm price breakout with oscillator breakout; certainly, will have the same output in short trades. Concept is based on find swing levels which based on number of bars by each side of peak
FREE
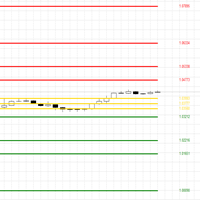
The CPR (Central Pivot Range) Indicator is a powerful technical analysis tool designed to identify key support and resistance levels on your MetaTrader 5 charts. It calculates the Central Pivot (CP) as the average of the previous day's high, low, and close prices, providing a central reference point. Calculates and plots 11 pivot levels (CP, BC, TC, S1-S4, R1-R4) Adjustable lookback period (default: 5 days) Option to show or hide price labels with customizable size and offset Fully customizable
FREE
Pip Movement Alert MT5로 시장 모멘텀을 앞서 나가세요. 이 다목적 다중 통화 인디케이터는 여러 심볼에서 정확한 핍 움직임을 추적하고 트레이더에게 알리기 위해 설계되었으며, 외환, 주식, 암호화폐, 상품 거래에 이상적입니다. Forex Factory와 Reddit의 r/Forex와 같은 거래 커뮤니티에서 찬사를 받고 있으며, Investopedia와 TradingView의 논의에서도 갑작스러운 시장 변화를 감지하는 능력으로 주목받고 있어, 빠른 가격 움직임을 활용하려는 트레이더에게 필수적인 도구입니다. 사용자들은 핍 기반의 중요한 움직임(예: 10핍 단위)을 최대 95%의 신뢰도로 식별하며, 실시간 알림을 활용하여 변동성 급등을 포착함으로써 거래 타이밍이 20-30% 개선되었다고 보고합니다. 주요 이점에는 다중 통화 모니터링, 사용자 정의 가능한 핍 임계값, 지속적인 차트 분석 없이 추적을 단순화하는 경량 디자인이 포함되어 스캘퍼, 데이 트레이더, 스윙 트레이더에게
FREE
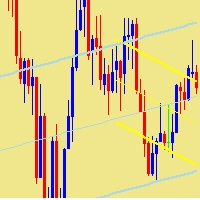
This indicator plots two linear regression channels on the chart for any currency pair or financial instrument, supporting the use of two different timeframes. The first channel uses a shorter period to identify local trends. The second channel uses a longer period to identify overall trends. Each channel displays a main regression line and two lines representing the deviation range. Users can adjust the period of each channel and select the desired timeframe. The indicator helps monitor price m
FREE

Advanced Indicator Scanner is a multi-symbol multi-timeframe scanner that works with hundreds of custom indicators available across the web including mql5 website market and codebase indicators.
Advanced Indicator Scanner features:
Scans your indicator in 28 customizable instruments and 9 timeframes. Monitors up to 2 lines(buffers) of an indicator. Showing of indicator value on buttons. You can choose between 3 alert modes: Single symbol and timeframe Multiple timeframes of a symbol Multiple

Highly configurable Bollinger Bands indicator. Features: Highly customizable alert functions (at levels, crosses, direction changes via email, push, sound, popup) Multi timeframe ability Color customization (at levels, crosses, direction changes) Linear interpolation option Works on strategy tester in multi timeframe mode (at weekend without ticks also) Parameters:
Bollinger Bands Timeframe: You can set the lower/higher timeframes for Bollinger Bands. Bollinger Bands Bar Shift: Y ou can set th
FREE

Weis Waves(와이스 웨이브) 는 데이비드 와이스(David Weis)가 개발하고 리차드 와이코프(Richard Wyckoff)의 원리에 기반한 기술적 지표입니다.
전통적인 거래량이 캔들마다 표시되는 것과 달리, Weis Waves는 거래량을 상승 또는 하락 “파동”으로 누적하며, 가격 방향이 바뀔 때마다 계산을 새로 시작합니다. 이 방법은 트레이더가 시장 움직임의 실제 힘 을 명확하게 파악할 수 있게 해줍니다. 각 파동은 일련의 캔들을 지탱하는 거래량의 강도를 보여줍니다. 주요 특징: 거래량을 매수 및 매도 파동으로 그룹화. 지배적인 압력(매수세 또는 매도세)을 강조. 추세 지속 또는 잠재적 반전 을 식별하는 데 도움. 와이코프 방법론에 기반하며, 거래량 및 흐름 분석에 널리 사용됨. Weis Waves는 가격과 거래량의 균형을 평가하기 위해 많은 전문 트레이더들이 활용하며, 시장 역학에 대한 더 깊은 통찰을 제공합니다.
FREE

We at Minions Labs love to study, challenge and discover new facts about Price Behavior in current markets. We would NOT call it Price Action because today this is a word totally overused and means, thanks to the False Prophets out there, absolutely NOTHING.
The study hypothesis we propose is this: Some Assets, in certain Timeframes, present a behavior of Price continuity when the candlesticks close without a Wick on them... So the purpose of this indicator is to "color" those candlesticks who
FREE

XE Forex Strengh Indicator MT5 displays visual information about direction and strength of a signal for current pair and chosen timeframes (M5, M15, M30 and H1). Calculations are based on multiple factors and results are shown as a colored panel with scale bar, numerical values and arrows. There are also displayed values of current price and spread on the pair. There can be activated an alert (as a mail or pop-up window with sound) for each available timeframes which send a message when the dir
FREE

Indicator Overview Latest Updates: Update 02-23-2025: This version includes further optimizations for improved signal accuracy. Update 01-13-2025: Now compatible with the upcoming Web Request App, which will replace the AutoSignal_Connection bot. Purpose
This MT5 indicator is designed for analyzing 3-minute Heiken Ashi candles, generating buy and sell signals based on moving average (MA) crossovers. It provides visual signals and alerts, making it a valuable tool for traders. Heiken Ashi Candl
The Zero Lag Least Squares Moving Average (ZLSMA) is an advanced moving average indicator designed to provide fast and smooth trend analysis while eliminating lag. It is based on the Least Squares Moving Average (LSMA) but incorporates a zero-lag calculation, making it highly responsive to price changes. This indicator helps traders identify trend direction with minimal delay, making it ideal for both short-term and long-term trading strategies.
Key Features: • Zero-Lag Calculation – Red
FREE

This indicator extracts a trend from a price series and forecasts its further development. Algorithm is based on modern technique of Singular Spectral Analysis ( SSA ). SSA is used for extracting the main components (trend, seasonal and wave fluctuations), smoothing and eliminating noise. It does not require the series to be stationary, as well as the information on presence of periodic components and their periods. It can be applied both for trend and for another indicators.
Features of the me
FREE

Taking orders, now on MT5 the TPX Dash Needle is everything you need to find the famous Didi Needles on several timeframes and in several pairs at the same time. These are the simultaneous meeting of the 3, 8 and 20 averages that, aligned with the ADX indicator, are synonymous with large and strong movements in the market. Now with the new Heiken Aish filter, the name of the pair shows the direction of the Heiken Aish you choose, it can be weekly or daily, all signals will appear on the screen,

The Breakout Box for MT5 is a (opening) range breakout Indicator with freely adjustable: - time ranges - end of drawing time - take profit levels by percent of the range size - colors - font sizes It can not only display the range of the current day, but also for any number of days past. It can be used for any instrument. It displays the range size and by request the range levels and the levels of the take profit niveaus too. By request it shows a countdown with time to finish range. The indic

TickFlow is a tool for tick-data analysis and visual highlighting of significant zones on the chart. The utility aggregates current and historical ticks, shows the buy/sell balance, and helps to identify support/resistance levels and cluster zones. This is the MetaTrader 4 version. How it works (brief) TickFlow collects tick data and aggregates it by price steps and candles. Based on the collected data the indicator builds visual layers: up/down tick counters, buy/sell ratio, historical levels

Super Strike — The Ultimate Trend Precision System
Super Strike is an advanced trend-following system that combines the proven accuracy of the SuperTrend algorithm with the filtering power of a dynamic Moving Average . Built for traders who demand precision and confidence, this indicator transforms raw price action into a clean, intuitive, and highly informative visual system — a complete framework for making smarter trading decisions.
At the heart of Super Strike lies a dynamic calculation o
FREE

This MT5 chart trend checker cuts through the noise of market volatility to provide a clearer picture of trends and price movements. It includes the following features that can provide more clarity during market assessments: 1 customizable multi-period moving average Optional Heikin-Ashi candles 3 switchable focus modes Distinct colors for easy analysis
Link to MT4 version: https://www.mql5.com/en/market/product/106708/
This indicator shows your preferred moving average from multiple time fram
FREE
Engulfing Zone Sniper MT5 — Multi-Timeframe Signal & Zone Indicator The Engulfing Zone Sniper MT5 is a technical analysis tool designed to highlight engulfing candlestick patterns in combination with adaptive support/resistance zones. It provides visual markers and optional alerts to assist traders in identifying market structure reactions across multiple timeframes. Key Features Multi-Timeframe Detection – Option to scan higher timeframe engulfing setups with lower timeframe confirmation. Su

A comprehensive tool for determining the levels of support, resistance, reversals in relation to trading sessions. The indicator's thesis can be expressed as follows: "Support and resistance levels are undoubtedly formed by the psychological barriers of market participants, and influence the further behavior of the price. But these barriers are different for different groups of traders ( One man's meat is another man's poison ) and can be grouped by territory or by the trading time ". Follo
FREE

BITCOIN DAILY TOP BOTTOM ENGINE (V1)
This is not a simple indicator. This is a professional-grade market observation and decision engine designed for serious Bitcoin traders who demand clarity, structure, and precision.
The Bitcoin Daily Top Bottom Engine is built to identify high-probability daily extremes using adaptive range logic, sweep behavior analysis, and market condition filtering. Instead of reacting late, this engine prepares you in advance by defining where the market is most like
FREE

The MP Andean Oscillator is used to estimate the direction and also the degree of variations of trends. It contains 3 components: Bull component, Bear component and Signal component. A rising Bull component indicates that the market is up-trending while a rising Bear component indicates the presence of down-trending market. Settings: Oscillator period: Specifies the importance of the trends degree of variations measured by the indicator. Signal line per: Moving average period of the Signal line
FREE

************************HI! Please note that this the trail version of this indicator, it will expire after one week********************** This is a 1-week trial version of Margin Monitor. For the unlimited full version, click : https://www.mql5.com/en/market/product/163835?source=Site +Market+MT5+Indicator+Search+Rating006%3amargin+monitor
Are you frustrated with the lack of a dedicated Margin Column in MT4? Well fret no more! This Margin Monitor is exactly what you have been waiting for
FREE

Highly configurable RSI indicator. Features: Highly customizable alert functions (at levels, crosses, direction changes via email, push, sound, popup) Multi timeframe ability Color customization (at levels, crosses, direction changes) Linear interpolation and histogram mode options Works on strategy tester in multi timeframe mode (at weekend without ticks also) Adjustable Levels Parameters:
RSI Timeframe: You can set the current or a higher timeframes for RSI. RSI Bar Shift: you can set the
FREE

AI SuperTrend Final – Adaptive Intelligence for Smarter Trading
The AI SuperTrend Final is not just another trend indicator—it is a next‑generation trading tool powered by adaptive intelligence. Designed for MetaTrader, this indicator combines the proven logic of SuperTrend with advanced filters such as Moving Average (MA), Average Directional Index (ADX), and a unique self‑learning mechanism. The result is a smart, evolving system that adapts to market conditions and continuously improves its
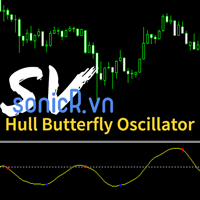
The Hull Butterfly Oscillator (HBO) is an oscillator constructed from the difference between a regular Hull Moving Average ( HMA ) and another with coefficients flipped horizontally . Levels are obtained from cumulative means of the absolute value of the oscillator. These are used to return dots indicating potential reversal points . This indicator draw line in separate window, plus blue dot (for buy signal) when hull oscillator is peak and red when sell signal. It also includes integrate

알림 시스템(팝업, 소리, 이메일, 텔레그램, 왓츠앱)을 추가하려면 댓글에 요청해 주세요.
TrendPicoeur — 표시기 설명 및 사용법 TrendPicoeur 표시기 — Parabolic SAR(포물선 SAR) 알고리즘을 구현한 표시기이며, 재그리지 않음(Non-Repainting)입니다. 조건: SuperTrend(슈퍼트렌드) 알고리즘과 변동성 알고리즘을 결합하였습니다. 이 표시기는 트레일링 스탑, 신호 발생기 또는 추세 지표로 사용할 수 있습니다. 버퍼를 통해 전문가 어드바이저(EA)에 연결됩니다. 이 표시기에는 두 개의 버퍼가 있습니다: SetIndexBuffer(0, sarBuffer, INDICATOR_DATA); — 버퍼 (0): 차트 화살표의 가격 위치를 포함합니다. SetIndexBuffer(1, colorBuffer, INDICATOR_COLOR_INDEX); — 버퍼 (1): 화살표 색상을 정의합니다. 색상 버퍼 (1)는 다음 신호를 제공합니다:
FREE

A simple volume indicator according to the color of the candle!
- Custom background!
- Supports Volume by Ticks or Real Volume.
The original Metatrader Volume indicator does not show the colors of the bar according to the color of the Candle, it only changes color when the volume of a candle is greater than the previous one, this sometimes creates confusion for beginners and does not know the real reason for the color change.
Free indicator, support may take a while to respond!
FREE

Mostra a média móvel quando ADX > 20 e pinta de verde ou vermelho quando os valores de ADX estão subindo indicando tendência. Quando o ADX é menor que 20 indica movimento lateral consolidado. O indicador não define pontos de entrada, somente mostra a média colorida quando a tendência está se fortalecendo. Faz parte do grupo de indicadores do Indicador Tavim.
FREE
The Strat Dashboard - Rob Smith의 Strat 전략용 다중 심볼 패턴 스캐너 실시간 다중 심볼 Strat 분석으로 트레이딩을 혁신하세요 The Strat Dashboard는 Rob Smith의 유명한 “Strat” 트레이딩 방법론을 사용하는 트레이더를 위해 특별히 설계된 강력하고 전문적인 인디케이터입니다.
여러 종목을 여러 타임프레임에서 동시에 모니터링하고, 고확률 패턴을 즉시 식별하며, 중요한 매매 기회를 놓치지 마세요. MT4 Version :- https://www.mql5.com/en/market/product/153375/
“The Strat”이란 무엇인가? The Strat은 Rob Smith가 개발한 혁신적인 프라이스 액션 기반 트레이딩 전략으로, 캔들스틱 패턴과 타임프레임 간의 관계를 분석합니다.
각 캔들은 이전 캔들과의 관계에 따라 번호로 분류되어, 모든 시장, 모든 시간대 에 적용 가능한 보편적인 가격 해석 언어를 제공합니다.

FRONTIER PIVOTS - Geometric Levels Indicator This indicator plots support and resistance levels/ranges on the chart using mathematical calculations. It helps traders identify potential price reaction zones based on geometric patterns. Main Features: Automatically calculates and displays key price levels Plots both support and resistance lines Uses daily price data for level calculation Clean visual presentation with different colors for different level types No repainting - levels remain static

Golden Sniper Indicator 를 소개합니다. 이는 트레이더들이 거래 경험을 향상시키고자 하는 강력한 MQL5 도구입니다. 6년 이상의 경험을 가진 팀에 의해 개발되었으며, 이 인디케이터는 뛰어난 정확성으로 거래 기회를 식별하는 신뢰할 수 있는 방법을 제공합니다. 주요 기능 : 알림 및 시그널 화살표 : Golden Sniper Indicator는 적시에 알림과 시각적인 시그널 화살표를 제공하여 트렌드 반전을 식별하는 데 도움이 됩니다. 리스크 관리 : Risk-Reward Ratio (RRR)를 기반으로 적절한 이익 실현 및 손실 제한 수준을 제안합니다. 적응성 : 초보자든 전문 트레이더든 이 인디케이터는 스윙 트레이딩과 스캘핑을 포함한 다양한 거래 스타일에 적응됩니다. 사용자 정의 가능한 설정 : 인디케이터를 사용자의 선호에 맞게 조정할 수 있습니다. 추천 사항 : 타임프레임 : Golden Sniper Indicator는 모든 타임프레임에서 잘 작동합니다. 스캘핑

Mouse Calculation은 마우스로 가리킨 가격에서 청산한다고 가정했을 때, 각 주문의 손익을 빠르게 계산해 줍니다. 그리드, 마틴, 분할 진입 등 다수 주문 운용 시 빠른 의사결정에 적합합니다. 손익분기 가격과 목표 가격을 한눈에 확인할 수 있습니다. 핵심 기능 Mouse PnL (M) : 주문별/총 손익 미리보기(스왑 swap 포함). Break even Price (B) : 전체 포지션의 손익분기 가격/라인 표시. Time_Sync_Lines (T) : 최근 N일의 동일한 시각을 맞춰 비교; 드래그로 핵심 구간 복기. Panel (P) : 패널 표시/숨김. About (A) : 사용 안내 및 정보. 차트 표시 안내 B / S : 주문의 현재 손익 M : 마우스 가격 기준 “해당 가격 청산 시 손익” 추정 T : 총 손익 추천 사용 시나리오 그리드 : 바스켓 익절 구간을 빠르게 결정. 마틴 : 손익분기/플러스 전환에 필요한 반등 범위를 빠르게 확인. 다수 주문 : 부분 청
FREE
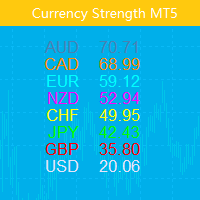
이 지표는 8개 주요 통화(USD, EUR, GBP, AUD, NZD, CAD, CHF, JPY)의 상대적 강세를 보여줍니다. 힘 값은 0~100 범위에서 정규화됩니다. 60 이상의 값은 강함을 의미합니다. 40 미만의 수치는 약점을 나타냅니다.
티켓 Only Show Current Pair - true인 경우 현재 차트 쌍만 표시됩니다. 그렇지 않으면 8개의 곡선이 모두 표시됩니다. Bars To Show – 힘 곡선을 표시할 막대 수입니다. Ma Periods To Smooth Curves : 강도 곡선을 평활화하는 이동 평균 기간 Suffix - 문자 접미사. 지금은 설치가 필요하지 않습니다. Font Size - 이미지 글꼴 크기, 기본값은 13입니다. Row Space - 그려진 선 사이의 거리, 기본값은 17입니다. 두 곡선이 교차할 때 이를 알리는 데 사용할 수 있는 세 가지 입력이 있습니다. Sele

If you love this indicator, please leave a positive rating and comment, it will be a source of motivation to help me create more products <3 Key Takeaways StochRSI is an oscillator that measures the RSI level relative to its high-low range over a period of time. It is more sensitive than the traditional RSI and can highlight overbought or oversold conditions in the market. StochRSI is typically used to generate more frequent and timely trading signals compared with the traditional RSI. StochRSI
FREE
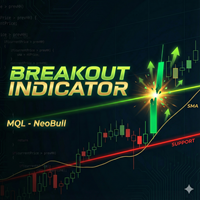
NeoBull Breakout Indicator - 전문적인 돌파 거래를 쉽게 NeoBull Breakout Indicator는 돌파 트레이더를 위해 특별히 설계된 MetaTrader 5용 강력한 기술 지표입니다. 검증된 최고가/최저가 수준과 SMA 200 추세 필터를 결합하여 높은 확률의 돌파 설정을 식별합니다. 주요 기능: * 계단식 최고가(20) 라인 - 지난 20주기의 최고가를 명확한 수평선으로 표시 (TradingView처럼) * 계단식 최저가(20) 라인 - 지난 20주기의 최저가를 명확한 수평선으로 표시 * SMA 200 추세 필터 - 더 정확한 신호를 위해 주요 추세 식별 * 지능형 돌파 알림: HH 돌파 알림 : 가격이 최고가를 돌파하고 SMA 200 위에 있을 때 발동 (상승 추세) LL 붕괴 알림 : 가격이 최저가를 붕괴하고 SMA 200 아래에 있을 때 발동 (하락 추세) * 모바일 푸시 알림 - 기회를 놓치지 마세요! 어디에 있든 스마트폰으로 직접 알림 수신
FREE

The MultiTimeframe Volume Zones Indicator is a powerful tool designed to provide traders with comprehensive insights into market dynamics. It combines several essential features, including volume analysis, Dow Zones, buy and sell arrows, candle timer, and market movement across different time frames. This all-in-one indicator equips traders with valuable information to make informed trading decisions. Key Features: Volume Analysis: Gain a deep understanding of market sentiment and strength by an
FREE

Ratio X Trend Watcher – Advanced Trendline Breakout Indicator
Ratio X Trend Watcher is a professional indicator designed to analyze price action, draw trendlines on the current chart timeframe, and detect meaningful breakouts. Built for traders who rely on support and resistance levels, this tool offers clear visual cues and optional automated actions to help improve your trading decisions. Developed by Mauricio Vellasquez, it is part of the Ratio X suite of trading systems. Key Features Real‑t
FREE

Developed by Charles Le Beau and featured in Alexander Elder's books, the Chandelier Exit sets a trailing stop-loss based on the Average True Range (ATR). The indicator is designed to keep traders in a trend and prevent an early exit as long as the trend extends. Typically, the Chandelier Exit will be above prices during a downtrend and below prices during an uptrend.
Calculation
The original Chandelier Exit formula consists of three parts: a period high or period low, the Average True Rang
FREE

SMC Precision AI Unlock the edge of institutional trading with SMC Precision AI – an advanced AI-powered Smart Money Concept (SMC) based FIBO Retrenchment indicator built for serious traders who want precision, clarity, and high-probability trade setups.
Key Features It Plots Fibo Retrenchment Zones.
AI-Powered Signals – Enhanced by real-time AI logic to adapt to changing market conditions with Reasonable accuracy
Signal Clarity – It Draws Fibo Bands- When the Lower Line Is drawn it indicat

super trend version is to help you to have real time view of market move it will help you to get a live view of current market buy signal line and arrow to help you understand batter the direction sell signal line and arrow to help you understand batter the direction trade what you see not what you think this is an simple and best trading tool for our traders of any market crypto gold
FREE

Santa Trend Indicator is an efficient way to forecast and detect the trend in any market. Advantages Generates instant buy and sell signals. Provides an alternate exit strategy to your existing trading system. Never repaints, never backpaints, never recalculates. Works in all symbols and all timeframes. Perfect trend filter for any strategy or expert advisor. Fully compatible with Expert Advisor (EA) development. Does not lag.
FREE

The purpose of Impulse Release is to prevent trading in the wrong direction. While the Impulse System operates in a single timeframe, Impulse Release is based on two timeframes. It tracks both the longer and the shorter timeframes to find when the Impulse points in the same direction on both. Its color bar flashes several signals: If one timeframe is in a buy mode and the other in a sell mode, the signal is "No Trade Allowed", a black bar. If both are neutral, then any trades are allowed, showi

Fundamentação teórica A VWAP é uma média móvel ajustada pelo volume, ou seja o peso de cada preço corresponde ao volume de ações negociadas no período, dando mais importância ao período em que se tenha mais negociações. [1] VWAP = sum(price[i]*volume[i]) / sum(volume[i]) Metodologia É possível configurar o período que será utilizado para o calculo da VWAP, a cor, a espessura e o estilo da linha. A linha é desenhada desde a o começo da série disponível apenas uma vez para economizar recursos com
FREE

Moving average indicator to work with the F12 Replay simulation and replay tool.
In this way, the F12 Replay tool now supports the moving average indicator.
F12 Replay: https://www.mql5.com/pt/market/product/38313
This is a product developed by Renato Fiche Junior and available to all MetaTrader 5 users!
Partners: "Águia Traders" team ( Eagle Traders ) by Larissa Sihle #aguiatraders #larissasihle
Input Parameters
Period Shift Method
FREE

Elliott Wave X kNN is a market structure and Elliott Wave indicator designed for traders who want clarity. Whether just starting and don’t know where to begin, or already trade and want a cleaner, more objective view of the market, this indicator focuses on one goal: making price action readable and structured . It does not promise profits.
Instead, it provides a transparent framework to understand market movement, risk, and probabilities.
A Clear Process, Step by Step The indicator follows a f
FREE

Utazima 001 Indicator AI Professional Market Structure & Opening Range System STOP GUESSING. START TRADING WITH STRUCTURE. Utazima 001 Indicator AI is a next-generation Market Structure & Opening Range Intelligence System , built for traders who want clarity, precision, and consistency . This is not a repainting signal tool.
This is institutional-grade logic , simplified and automated for retail traders. Designed by Utazima MentorCreate , this indicator reveals the most important price zo
FREE
The Vix_Fix indicator, or "Vix Fix," is a tool designed to identify potential market bottoms. It operates on the principle of measuring extreme fear or pessimism among the crowd, which are moments when the market often has a high probability of reversing to the upside. Main Purpose: To help traders find high-probability BUY (Long) entry points by identifying when the market is "oversold." How it Works In simple terms, the Vix Fix measures the distance between the current bar's Low and the Highes
FREE

When trading price action or using price action triggers such as Pbars, Inside Bars, Shaved Bars, etc. it is important to always wait for the bar/candle to close more than anything else.It is often the case (whether it’s the 4H, hourly, etc) that price action will be dominant in one direction for the majority of the candle only to reverse strongly at the end of the candle. Institutional traders know retail traders are less disciplined than they are. They know a good trading candle pattern coul
FREE

Ratio Indicator - User Guide
Special Deal! Leave a review and get the indicator Long & Short Cointegration Analyzer for free — just send me a message!
This Ratio indicator between assets allows you to monitor and trade the price relationship between two assets selected by the user. It calculates the ratio between the prices of two assets, referred to as Asset1 and Asset2 (e.g., "GBPUSD" and "EURUSD"), and plots a moving average of the ratio along with Bollinger Bands . These bands are used to
FREE

MACD Pro – MACD Indicator for MetaTrader 5 Description
MACD Pro is a Moving Average Convergence Divergence (MACD) indicator for MetaTrader 5. It follows the standard MACD calculation method and displays trend direction and momentum in a separate indicator window. Indicator Elements MACD line based on the difference between fast and slow exponential moving averages Signal line calculated as an exponential moving average of the MACD line Histogram showing the difference between the MACD and signa
FREE

Wizard Poverty Sanitizer is a moving average based indicator, using three EMA'S being 2OO EMA which is the slow EMA, the 21 EMA which is the median and the 10 EMA which is the fast. When the median and the fast EMA cross a signal is given, when the fast EMA goes above the Median EMA a buying signal is given and when the fast cross below the median a selling is given. Note that you can change the moving averages to you own choices of moving averages, allowing you to set your own MA strategy. an
FREE
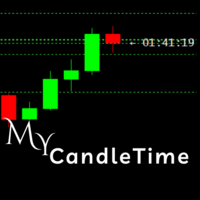
My CandleTime
This indicator displays the remaining time until the current candle closes directly on the chart.
It is designed to help traders keep track of candle formation without constantly checking the platform’s status bar. Main Features Shows countdown timer for the active candle. Works on any symbol and timeframe. Lightweight, does not overload the terminal. Adjustable font size and name. How to Use
Simply attach the indicator to a chart.
You can customize font size, color, and font to
FREE

Multi-timeframe trend indicator based on the ADX / ADXWilder indicator with Fibonacci levels
The indicator shows trend areas using ADX or ADXWilder indicator data from multiple timeframes. The impulse mode of the indicator allows you to catch the beginning of a trend, and several "Screens" with different timeframes allow you to filter out market noise. Fibonacci levels are added to the price chart, which have flexible settings.
How the indicator works: if PDI is greater than NDI, then it`s
FREE

The ADX Histogram is a modern and visual upgrade of the classic Average Directional Index (ADX) .
It transforms the standard ADX and DI+ / DI– values into a color-coded histogram , making trend analysis much clearer and faster. Key Features: Histogram with four states : Blue = Normal Buy Trend Green = Strong Buy Trend Orange = Normal Sell Trend Red = Strong Sell Trend Automatic strength detection : uses the ADX line to separate “normal” vs. “strong” signals. Fully customizable: ADX
FREE

LogVar 지표는 가격의 로그 수익률(Logarithmic Return) 을 계산하고 시각적으로 표시하는 고급 분석 도구입니다.
이는 단순한 백분율 변화보다 훨씬 정밀하게 시장의 실제 움직임을 보여 주며, 특히 변동성이 큰 시장이나 장기 추세 분석에서 뛰어난 안정성과 신뢰성을 제공합니다. 이 지표는 현재 종가와 n 기간 전 종가( iPeriod )를 비교하여 그 비율의 로그 값을 계산하고, 결과를 확대된 로그 스케일로 차트에 표시합니다.
이를 통해 미세한 가격 변화도 쉽게 파악할 수 있으며, 상승과 하락의 흐름이 명확하게 드러납니다. 라인 색상은 자동으로 변합니다: 녹색: 상승 추세 (현재 가격이 기준보다 높음) 빨강: 하락 추세 (현재 가격이 기준보다 낮음) 가운데의 0선 은 중립선 역할을 하며, 양의 변동과 음의 변동을 직관적으로 구분합니다. 주요 특징: 실제 로그 변화율 계산 (단순 백분율 아님) 자동 시각 스케일 조정 및 선명한 표시 상승/하락에 따른 동적 색상 변화
FREE

Apply to the 5 minute timeframe against the major USD forex pairs. AUDUSD EURUSD GBPUSD USDCAD USDCHF USDJPY Highlights the PropSense Book Levels Turn on/off for Sydney, Asia, London and New York Sessions Shows the Tokyo and London Fixes Turn on/off for Tokyo and London Configure how many historical fixes to show Shows the Sessions Turn on/off visible indication for sessions (supports 4 sessions) Visibly shows the sessions (out of the box configuration for Sydney, Tokyo, London and New York) Hig
FREE

**Experience Smarter Trading with FVG Super Signal**
Unlock simpler, more decisive trading with **FVG Super Signal**, an advanced MT5 indicator from the WinWiFi Robot Series. This powerful tool uniquely combines the Fair Value Gap (FVG) technique with robust trend-following logic.
* **Clear Signals:** Delivers intuitive Buy/Sell alerts, simplifying your trading decisions. * **Universal Compatibility:** Works seamlessly across all assets and timeframes. * **Highly Versatile:** Ideal for all tr
FREE

New Candle Alert is a simple indicator that notify you when a new candle is formed. Func tions : Alert type - option to choose between message with sound or only sound. Message - alert message. Push notifications - enable push notifications. Show timeframe - show the symbol timeframe. Show hour - show the alarm time. Test message - if you don't want to wait a new candle formed to see the message. MT4 version: https://www.mql5.com/pt/market/product/37988 Hope you enjoy it. Any doubt or su
FREE

The indicator shows your profit and loss (PnL) for the current day right on your trading chart. Anchored at the top-right corner, it displays "PnL: [amount]"—green if you’re up, red if you’re down, white if it’s zero. Every time you close a trade, it updates instantly, adding up your profits, commissions, and swaps from all buys and sells trades since midnight. No fuss, no extra charts—just real-time feedback on how your day’s going.
FREE
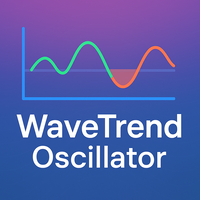
The WaveTrend Oscillator indicator is an enhanced version of the classic WaveTrend Oscillator, a momentum indicator. It is designed to identify overbought/oversold conditions and provide potential trend reversal signals. The core difference in this version is the application of a data "normalization" algorithm. This ensures the indicator's oscillation lines remain balanced around the zero line, causing the indicator window to always stay naturally centered. This is especially useful when trading
FREE
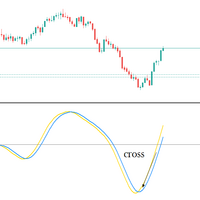
Big promotion on the Robos, Get yours now Robos Indicator The ROBOS indicator is a multi timeframe oscillator that targets the overbought and oversold regions of a price chart, a signal is indicated by the two lines crossing, compatible with all tradable instruments
Latest Release
The latest release is the version 4.0
#What's new in version 4.0 ?
Features
Extreme oversold and overbought levels
ROBOS version 4.0 comes with cool new feature , the ability to target only extrem

Description This is an indicator for MT5 which has enhanced the "Fractals" indicator. "Fractals" indicator is included in MT5 by default but the draw line period is fixed at "5" and it cannot be modified. Thus I have reinvented the Fractals indicator with some useful function added. This tool will be useful especially for those who are learning how to draw good horizontal lines and wants to get some reference. Of course, those who are considering Fractals as an important horizontal line wil
FREE

DailyHiLo Indicator
Master the daily range like a pro. This indicator automatically plots the previous day’s high and low levels —a core element in the (Beat The Market Maker) trading approach—directly on your chart. These levels act as natural boundaries for intraday price action, helping traders identify potential reversal zones, breakout points, and liquidity targets. Key Features Accurate plotting of yesterday’s high and low for any symbol and timeframe. Works seamlessly with BTMM-inspired
FREE

FX Correlation Matrix is a powerful multi-timeframe dashboard that helps traders analyze real-time currency correlations of up to 28 symbols at a glance. With customizable settings, sleek design, and manual symbol selection option, it enhances trade accuracy, reduces risk, and identifies profitable correlation-based opportunities. Setup & Guide: Download MT4 Version here. Follow our MQL5 channel for daily market insights, chart, indicator updates and offers! Join here.
Read the product des

Alligator Window Indicator : Potencialize suas análises no MetaTrader com o Alligator Window. Este indicador coloca o clássico Alligator de Bill Williams em uma janela separada, permitindo uma visualização mais clara e organizada. Ideal para traders que buscam precisão e eficiência em suas operações, o Alligator Window proporciona insights nítidos e facilita a identificação de tendências sem poluir o gráfico principal. Experimente agora e leve suas estratégias de trading a um novo patamar!
FREE
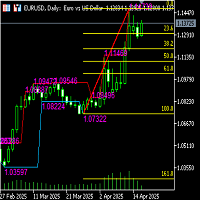
Functional description of automatic Fibonacci line indicator (including high and low channel lines) Indicator name Automatic Fibonacci retracement line + high and low channel auxiliary
Functional introduction This indicator combines the automatically identified high and low points of the band, automatically draws the Fibonacci retracement/extension line, and draws the highest and lowest price channel lines of the current analysis interval to provide traders with clearer support/resistance refe
FREE

Tick Velocity Pro — The Real-Time Market Pulse Indicator Tick Velocity Pro is a next-generation tick-based momentum analyzer that converts raw tick data into a live market energy visualization.
It tracks the speed and direction of every price tick — showing whether buyers or sellers dominate — and transforms this into a clean, easy-to-read histogram. ️ Core Concept Each incoming tick is analyzed in real time: Upward ticks → Buyer momentum Downward ticks → Seller momentum
These are accu
FREE

AI Adaptive Market Holographic System Indicator Based on Microstructure and Field Theory Abstract: This paper aims to explore the construction principles and implementation mechanism of a novel financial market analysis tool—the Micro gravity regression AIselfregulation system. This system fuses Market Microstructure theory, classical mechanics (elasticity and gravity models), information entropy theory, and adaptive AI algorithms. By aggregating Tick-level data in real-time, physically modeling
MetaTrader 플랫폼 어플리케이션 스토어에서 MetaTrader 마켓에서 트레이딩 로봇을 구매하는 방법에 대해 알아 보십시오.
MQL5.community 결제 시스템은 페이팔, 은행 카드 및 인기 결제 시스템을 통한 거래를 지원합니다. 더 나은 고객 경험을 위해 구입하시기 전에 거래 로봇을 테스트하시는 것을 권장합니다.
트레이딩 기회를 놓치고 있어요:
- 무료 트레이딩 앱
- 복사용 8,000 이상의 시그널
- 금융 시장 개척을 위한 경제 뉴스
등록
로그인
계정이 없으시면, 가입하십시오
MQL5.com 웹사이트에 로그인을 하기 위해 쿠키를 허용하십시오.
브라우저에서 필요한 설정을 활성화하시지 않으면, 로그인할 수 없습니다.