Technische Indikatoren für den MetaTrader 5 - 28

Einführung
Der SuperBands-Indikator ist ein hochentwickeltes technisches Analyseinstrument, das Händlern eine klare visuelle Darstellung von Kursbewegungen innerhalb genau definierter Bänder bietet. Dieser Indikator wurde speziell entwickelt, um geringfügige Kursschwankungen und Marktgeräusche herauszufiltern, und bietet Händlern eine genauere und zuverlässigere Sicht auf Kurstrends und potenzielle Umkehrpunkte.
Signal
Kaufen, wenn der Kurs unter das "extrem überverkaufte" Band (dunklere r
FREE
Scalping Timer – Echtzeitpräzision für anspruchsvolle Scalper Der Scalping Timer ist ein kompaktes visuelles Tool, das speziell für Scalper und Daytrader entwickelt wurde, die auf perfektes Timing und minimale Transaktionskosten angewiesen sind. Dieses Echtzeit-Panel zeigt zwei wesentliche Metriken für das Scalping an: Exakter Countdown der verbleibenden Zeit bis zum Schluss der im Chart eingestellten Kerze. Sofortige Visualisierung des aktuellen Spreads des Symbols. Mit diesen entscheidenden In
FREE
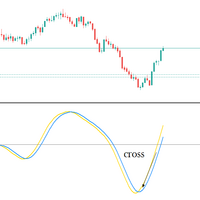
Großes Angebot für die Robos, Holen Sie sich Ihre jetzt Robos Indikator Der ROBOS-Indikator ist ein Multi-Zeitrahmen-Oszillator, der auf die überkauften und überverkauften Regionen eines Preisdiagramms abzielt. Ein Signal wird angezeigt, wenn sich die beiden Linien kreuzen, kompatibel mit allen handelbaren Instrumenten
Letzte Veröffentlichung
Das neueste Release ist die Version 4.0
# Was ist neu in Version 4.0?
Funktionen
Extreme überverkaufte und überkaufte Niveaus
ROBOS Version 4.0 ko

Hervorragende Tracking-Leistung und minimales Rauschen! Dieser Trenderkennungsindikator vermeidet "Whipsaws" und unsichere Marktgeräusche und ist außerdem agil genug, um auf Trendänderungen zu reagieren.
Er wurde auch entwickelt, um sich an dynamische Märkte anzupassen.
Funktioniert hauptsächlich als Filter, um Ihnen zu helfen, in Richtung des Trends zu handeln .
Merkmale.
Einfach und leicht zu bedienen. Geringe Belastung und leicht auszuprobieren Hervorragende Tracking-Performance und glatte L
FREE
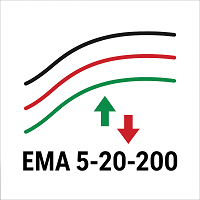
Beschreibung (Englisch) EMA 5-20-200 Cross Alerts (Feste Alerts, kein Repaint) Dieser Indikator kombiniert drei beliebte EMAs (5, 20 und 200), um Händlern zu helfen, kurz-, mittel- und langfristige Trends zu erkennen.
Mit visuellen Pfeilen auf dem Chart und automatischen Alarmen (Popup- und Push-Benachrichtigung) ermöglicht er Händlern, Einstiege und Trendbestätigungen zu erkennen, ohne ständig den Bildschirm beobachten zu müssen. Hauptmerkmale: Stellt EMA 5, EMA 20 und EMA 200 direkt auf
FREE

FX Correlation Matrix ist ein leistungsstarkes Multi-Timeframe-Dashboard, das Händlern hilft, Echtzeit-Währungskorrelationen von bis zu 28 Symbolen auf einen Blick zu analysieren. Mit anpassbaren Einstellungen, schlankem Design und manueller Symbolauswahl erhöht es die Handelsgenauigkeit, reduziert das Risiko und identifiziert profitable korrelationsbasierte Chancen. Einrichtung & Anleitung: MT4-Version hier herunterladen . Exklusiv für Sie: Das ist Ihre Chance, dem Markt einen Schritt voraus zu

Der Expert Advisor für diesen Indikator kann hier gefunden werden: https: //www.mql5.com/en/market/product/116472 Wir stellen den Rejection Candle MT5 Indicator vor, ein robustes Tool, das Ihre Handelserfahrung auf der MetaTrader 5-Plattform revolutionieren wird. Dieser Indikator wurde entwickelt, um potenzielle Umkehrungen mit Präzision zu erkennen, und bietet unvergleichliche Einblicke in Marktstimmungsänderungen, die es Händlern ermöglichen, profitable Gelegenheiten mit Zuversicht zu ergreife
FREE

Der WaveTrend Oscillator Indikator ist eine erweiterte Version des klassischen WaveTrend Oscillators, eines Momentum-Indikators. Er wurde entwickelt, um überkaufte/überverkaufte Bedingungen zu erkennen und potenzielle Trendumkehrsignale zu liefern. Der Hauptunterschied in dieser Version ist die Anwendung eines Algorithmus zur Normalisierung der Daten. Dadurch wird sichergestellt, dass die Oszillationslinien des Indikators um die Nulllinie herum ausgeglichen bleiben, so dass das Indikatorfenster
FREE

AI Adaptive Market Holographic System Indicator basierend auf Mikrostruktur und Feldtheorie Zusammenfassung: In diesem Beitrag werden die Konstruktionsprinzipien und der Implementierungsmechanismus eines neuartigen Finanzmarktanalysewerkzeugs untersucht - das KI-Selbstregulierungssystem mit Mikrogravitationsregression. Dieses System vereint die Theorie der Marktmikrostruktur, die klassische Mechanik (Elastizitäts- und Gravitationsmodelle), die Theorie der Informationsentropie und adaptive KI-Alg

Dieser Indikator stellt den Standard Heikin Ashi Candle Converter von normalen Kerzen dar. Sie werden auf ein anderes Diagramm angewendet, so dass Sie beide Preise leicht identifizieren können. Sie können die Kerzen auch in Ihre Lieblingsfarben ändern. Wenn Sie möchten, können Sie diesen Indikator in einen iCostum verwenden, so dass Sie andere Indikatoren darüber anwenden können, denn es gibt hervorragende Indikatoren, die mit diesem Kerzentyp kombiniert werden
FREE
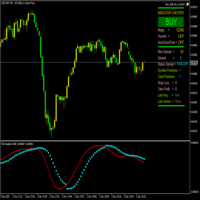
ParabolicSariTriX ist ein hybrider Indikator, der den Trend-Oszillator TriX (dreifacher exponentieller gleitender Durchschnitt) mit dem Parabolic SAR-System (parabolisches Stop- und Reverse-System) kombiniert. Der Indikator wird in einem separaten Fenster angezeigt und dient dazu, Ein- und Ausstiegspunkte auf der Grundlage von Trendumkehrsignalen zu identifizieren. Er liefert klare visuelle Signale in Form von SAR-Punkten, die ihre Position relativ zur TriX-Linie ändern, sobald sich der Marktt
FREE
[ MT4 Version ] Order Block Indicator MT5 — Präzises Trading leicht gemacht
Order Block Indicator MT5 wurde entwickelt, um Tradern zu helfen, wichtige Umkehrzonen schnell und mühelos zu erkennen — ohne überladene Charts oder Rätselraten.
Ideal für Scalping , Swing-Trading und intelligentes Intraday-Trading , hebt er aktive Orderblöcke über mehrere Zeitrahmen hinweg präzise und individuell anpassbar hervor. Handeln Sie mit Klarheit, sparen Sie wertvolle Zeit und reagieren Sie sofort auf Ve

Der Stretch ist ein Toby-Crabbel-Preis-Muster , das die minimale durchschnittliche Preisbewegung/Abweichung vom Eröffnungskurs während eines bestimmten Zeitraums darstellt und zur Berechnung von zwei Ausbruchsniveaus für jeden einzelnen Handelstag verwendet wird. Zur Berechnung wird der 10-Perioden-SMA der absoluten Differenz zwischen dem Eröffnungskurs und dem Höchst- oder Tiefstkurs herangezogen, je nachdem, welche Differenz kleiner ist. Dieser Wert wird zur Berechnung der Ausbruchsschwellen f
FREE

Der HiLo Ladder ist eine Neuinterpretation des klassischen HiLo-Indikators , der von Tradern häufig genutzt wird, um Trends und mögliche Umkehrpunkte am Markt zu erkennen. Im Gegensatz zur traditionellen Version wird der HiLo Ladder in einem stufenförmigen Format dargestellt — den beliebten „Leitern“ — was die Preisbewegungen wesentlich klarer und leichter verständlich macht. Hauptvorteile: Vereinfachte Visualisierung von Aufwärtsphasen (grün) und Abwärtsphasen (rot). Intuitivere Analyse, ohn
FREE

Binäre Vorhersage: Die ultimative Entscheidungshilfe für Händler binärer Optionen Binary Prediction ist ein sorgfältig entwickelter Indikator, der speziell auf die Anforderungen des Handels mit binären Optionen zugeschnitten ist. Er wurde entwickelt, um die komplexe Marktanalyse zu vereinfachen und klare, zuverlässige Handelssignale sowohl für Anfänger als auch für erfahrene Trader zu liefern, die ihren Entscheidungsprozess verbessern möchten. Hauptmerkmale & Vorteile: Spezieller Algorithmu
FREE

Ein Preiserhöhungsindikator berechnet die Spanne und die Preisänderungen in Prozent. Er ist sehr nützlich, wenn Sie sich das Diagramm ansehen.
Er hilft Ihnen, Entscheidungen zu treffen, um Geschäfte zu eröffnen, wenn der Preis auf dem niedrigsten Niveau ist, öffnen Sie keine Verkaufsgeschäfte und öffnen Sie Kaufgeschäfte, und wenn er auf dem höchsten Niveau ist, öffnen Sie keine Kaufgeschäfte, öffnen Sie Verkaufsgeschäfte, es ist kein Einstiegssignal für Geschäfte, sondern um den niedrigsten
FREE
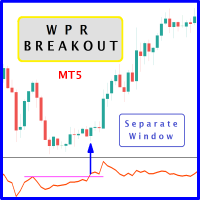
Die Wahrscheinlichkeit weitergehender Kursbewegungen steigt, wenn der Larry Williams Percentage Range Oszillator "WPR" seine historischen Widerstandsniveaus in Verbindung mit dem Ausbruch der Kurse aus den Widerstandsniveaus durchbricht. Es wird dringend empfohlen, den Ausbruch des Preises mit dem Ausbruch des Oszillators zu bestätigen, da sie vergleichbare Auswirkungen haben wie das Durchbrechen von Unterstützungs- und Widerstandsniveaus durch den Preis; eine ähnliche Sichtweise gilt für Short-
FREE

Heikin Ashi Candlestick-Indikator für MT5 Dieser benutzerdefinierte Heikin Ashi-Indikator bietet eine glatte visuelle Darstellung von Markttrends, indem er kurzfristiges Rauschen herausfiltert, wodurch es einfacher wird, potenzielle Umkehrungen und Trendfortsetzungen zu erkennen. Im Gegensatz zu regulären Candlesticks werden Heikin Ashi-Kerzen anhand von Durchschnittswerten berechnet, was zu stabileren und besser lesbaren Chartmustern führt. Hauptmerkmale: Klare und geglättete Visualisierun
FREE

Dies ist ein nicht-parametrisches ZigZag, das 4 verschiedene Berechnungsmethoden bietet. Die Aufwärtsflanke setzt sich bei neuen Balken fort, wenn deren "Hochs" über dem höchsten "Tief" der vorherigen Balken liegen, die Abwärtsflanke setzt sich bei den nächsten Balken fort, wenn deren "Tiefs" unter dem niedrigsten "Hoch" der vorherigen Balken liegen; Gann-Schwung: Die Aufwärtsflanke setzt sich fort, wenn die "Hochs" und "Tiefs" höher sind als beim linken benachbarten Balken, die Abwärtsflanke s
FREE

Candle Countdown Pro - Echtzeit-Zeitrahmen & Spread Tracker Lieben Sie es? Hassen Sie es? Lassen Sie es mich in einer Bewertung wissen! Feature-Wünsche und Ideen für neue Tools sind hochwillkommen :) Testen Sie "The AUDCAD Trader" :
https://www.mql5.com/en/market/product/151841 Verpassen Sie nie wieder einen Kerzenschluss! Candle Countdown Pro ist ein unverzichtbares Handelswerkzeug, das Echtzeit-Countdowns für mehrere Zeitrahmen,
Live-Spread-Überwachung und wichtige Handelsinformationen anzeig
FREE

Sie wurde 1995 von dem Physiker und technischen Analysten Paul Levine, PhD, initiiert und anschließend von Andrew Coles, PhD, und David Hawkins in einer Reihe von Artikeln und dem Buch MIDAS Technical Analysis weiterentwickelt: A VWAP Approach to Trading and Investing in Today's Markets (Ein VWAP-Ansatz für das Handeln und Investieren auf den heutigen Märkten).
FREE

Positionsgrößen-Rechner in Form eines Indikators. Für die Fälle, in denen es nicht möglich ist, Standard-Expert Advisors zur Risikoberechnung zu verwenden. Zwei Betriebsarten: Market und Pending Orders. Sie verschieben die SL-Linie und erhalten das erforderliche Positionsvolumen entsprechend den Risikoeinstellungen. Zeigt nur Informationen an, eröffnet keine Trades. Um korrekt zu funktionieren, sollten alle wichtigen Paare zu Market Watch hinzugefügt werden.
FREE

N/B : Alle unsere Produktkäufe kommen mit unserem kostenlosen ''DAILY SCALPER EA'' - bit .ly/4qlFLNh Whatsapp Entwickler für Ihre nach erfolgreichem Kauf
Ewiger Spike-Detektor Pro - M5 Mastery System
WIE MAN DIESES SYSTEM HANDELT
HANDELSREGELN
Für CRASH 500/900/1000:
SETUP VERKAUFEN:
- Warten Sie auf das Erscheinen des ROTEN ABWÄRTSPFEILS - SELL bei der Schließung der M5-Kerze, bei der der Pfeil erscheint, eingeben - Stop Loss: 1.5x ATR über dem Einstiegshoch - Take Profit: 2-3x ATR unter

Der Price Action Finder Multi-Indikator ist ein Indikator für Einstiegspunkte, der für Dutzende von Handelsinstrumenten und alle gängigen Zeitrahmen (m1, m5, m15, m30, H1, H4, D1, Wk, Mn) nach Price-Action-Mustern sucht und diese anzeigt. Der Indikator stellt die gefundenen Muster in einer Tabelle am unteren Rand des Bildschirms dar. Wenn Sie auf die Namen der Muster in der Tabelle klicken, können Sie zu dem Diagramm wechseln, in dem sich dieses Muster befindet. Manual (Be sure to read before pu

„Naturu“ ist ein manueller Indikator, der die Symmetrie der Natur als Algorithmus nutzt.
Beherrsche den Markt mit einer einfachen Strategie und verborgener Weisheit! Beim Laden des Indikators siehst du zwei Linien – Oben (Top) und Unten (Bottom).
Klicke einmal auf eine Linie, um sie zu aktivieren. Um sie zu verschieben, klicke einfach auf die Kerze, an die du sie setzen möchtest. Du legst einen Höchst- und einen Tiefstpunkt fest, und der Indikator berechnet automatisch: Eine magentafarbene Zone,

Wir stellen das Volume Orderflow Profile vor, ein vielseitiges Tool, das Händlern hilft, die Dynamik des Kauf- und Verkaufsdrucks innerhalb eines bestimmten Rückblickzeitraums zu visualisieren und zu verstehen. Perfekt für alle, die einen tieferen Einblick in das volumenbasierte Marktverhalten gewinnen möchten! MT4-Version - https://www.mql5.com/en/market/product/122656/ Der Indikator sammelt Daten zu Höchst- und Tiefstkursen sowie Kauf- und Verkaufsvolumina über einen benutzerdefinierten Zeitra

Ergründen Sie Handels-Einblicke mit Auto Anchored VWAPs: Auto Anchored VWAPs dienen als Ihr leitender Begleiter in der Welt des Handels. Diese Indikatoren ermitteln entscheidende Wendepunkte im Markt und veranschaulichen sie auf Ihrem Chart mit VWAP-Linien. Dies ist ein Game-Changer für Händler, die verankerte VWAP-Strategien verwenden. Wie funktioniert es? Identifizieren von Hochpunkten: Wenn der Höchstkurs der aktuellen Kerze niedriger ist als der Höchstkurs der vorherigen, Und der vorherige H

Auto Optimized RSI ist ein benutzerfreundlicher, intelligenter Pfeil-Indikator, der entwickelt wurde, um präzise Kauf- und Verkaufssignale zu liefern. Er nutzt Handelssimulationen auf historischen Daten, um automatisch die effektivsten RSI-Kauf-/Verkaufsschwellen für jedes Symbol und jeden Zeitrahmen zu ermitteln. Dieser Indikator kann als eigenständiges Handelssystem verwendet werden oder als Teil einer bestehenden Strategie – besonders nützlich für kurzfristige Trader. Im Gegensatz zu herköm

Dieser Indikator ist ein Volumenindikator, der die Farbe der Kerzen entsprechend einer bestimmten Anzahl von Ticks ändert, und diese Anzahl von Ticks kann der Benutzer sowohl über die Anzahl der Ticks als auch über die Farbe der Kerzen informieren. Dieser Indikator funktioniert in jeder grafischen Zeit oder einen Vermögenswert, vorausgesetzt, der Vermögenswert verfügt über eine Tickernummer, über die informiert werden muss.
Dieser Indikator soll dem Benutzer die Anzeige beim Analysieren von Ke
FREE

1. Einführung Der CM_Ultimate_RSI_MTF ist ein leistungsstarker und vielseitiger benutzerdefinierter Indikator für MetaTrader 5, der die Analyse des Relative Strength Index (RSI) verbessert. Er bietet Multi-Time-Frame (MTF)-Fähigkeiten, visuelle Signale und anpassbare Warnungen, was ihn zu einem unschätzbaren Werkzeug für Händler macht, die überkaufte/überverkaufte Bedingungen, Trendstärke und potenzielle Einstiegs-/Ausstiegspunkte über verschiedene Timeframes hinweg identifizieren wollen. 2. Hau
FREE

Der Indikator zeigt den aktuellen Zeitrahmen und den Symbolnamen an. Es ist auch möglich, die Anzeige der Zeit bis zum Ende des aktuellen Balkens einzuschalten. In den Einstellungen können Sie Folgendes festlegen - die Position des Indikators im Verhältnis zum Terminalfenster, oben links, oben rechts, unten links und unten rechts - die Anordnung der Textanzeige in einer Reihe, so dass sich die Beschriftungen nicht gegenseitig überlappen - die Farbe - Schriftart - die Schriftgröße.
FREE

Fair Value Gaps (FVG) und Liquiditätslücken sind Preisbereiche, die Sie für bessere Ein- und Ausstiege bei Ihren Geschäften ausnutzen können. Sie sind ähnliche Konzepte, also lassen Sie uns sie von oben betrachten und aufschlüsseln. Betrachten Sie FVG und Liquiditätslücken als Schwachstellen auf dem Markt. Sie sind der Weg des geringsten Widerstands. Das bedeutet nicht, dass der Preis durch sie hindurchgehen wird, aber der Preis könnte leichter durch sie hindurchgehen.
Um sie zu finden und zu
FREE

Wenn die Preise aus den Widerstandsniveaus ausbrechen und der Momentum-Oszillator aus seinen historischen Widerstandsniveaus ausbricht, besteht die Wahrscheinlichkeit, dass die Preise weiter steigen. Es wird dringend empfohlen, den Preisausbruch mit dem Oszillatorausbruch zu bestätigen, da sie vergleichbare Auswirkungen haben wie der Preis, der die Unterstützungs- und Widerstandsniveaus durchbricht; sicherlich werden Short-Trades die gleiche Wahrnehmung haben. Das Konzept basiert darauf, Swing-
FREE

ATR Moving Average zeichnet einen gleitenden Durchschnitt des Standard Average True Range ( ATR ) im gleichen Fenster.
Einstellungen Name Beschreibung ATR-Zeitraum
Eingestellte Preisperiode für die ATR-Berechnung
ATR-Niveau Legt den ATR-Wert für den Schwellenwert fest (nur ganze Zahlen, führende Nullen werden ignoriert, z.B. 0.00089 = 89) MA-Zeitraum Einstellen der Periode des gleitenden Durchschnitts MA-Methode Einstellen der Methode des gleitenden Durchschnitts (einfach, exponentiell, gegl
FREE

Der Indikator zeigt separate Break-even-Levels für Short-, Long- und Gesamtpositionen an. Er berücksichtigt alle laufenden Kosten: Swap, Spread, Kommissionen (auch beim Schließen). Der Indikator verfügt über flexible Einstellungen für die Anzeige der Linien, kann eine magische Zahl verwenden und das erforderliche Gewinnniveau für jedes Niveau festlegen.
Liste der Einstellungen: Zielgewinn für Kaufgeschäfte : Zielgewinn für Kaufpositionen. Zielgewinn für Sell-Trades : Zielgewinn für Sell-Positi
FREE

Super Strike - Das ultimative Trend-Präzisionssystem
Super Strike ist ein fortschrittliches Trendfolgesystem, das die bewährte Genauigkeit des SuperTrend-Algorithmus mit der Filterleistung eines dynamischen gleitenden Durchschnitts kombiniert. Dieser Indikator wurde für Händler entwickelt, die Präzision und Vertrauen verlangen, und verwandelt rohe Kursbewegungen in ein sauberes, intuitives und hochinformatives visuelles System - ein komplettes Rahmenwerk, um intelligentere Handelsentscheidunge
FREE

Dieser Indikator analysiert den Trend und zeigt Signale an. Wenn Sie den Chart öffnen, zeigt Ihnen der Indikator Kauf- oder Verkaufssignale als Alert an. Verwendung: Aktivieren Sie Algo Trading, aktivieren Sie den Indikator und ziehen Sie neue Währungen in den Chart. Der Indikator zeigt Ihnen ein Kauf- oder Verkaufssignal als Warnung an.
Ergebnisse
- Kaufsignal
- Verkaufssignal
- Kein Signal Bei Fragen zögern Sie bitte nicht uns zu kontaktieren.
FREE
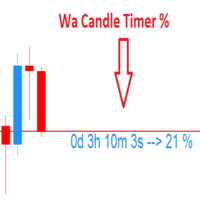
Wa Candle Timer Percentage MT5 ist ein Indikator, der dem Benutzer anzeigt, wie viel Zeit noch verbleibt, bis sich die nächste Kerze bilden wird. Der Prozentsatz der Entwicklung der aktuellen Kerze wird ebenfalls angezeigt. Der Benutzer kann den Prozentsatz einstellen, um den der Candle Timer die Farbe ändert. Dies sind die Einstellungen: 1- Der Prozentsatz, um den der Kerzen-Timer die Farbe ändert. 2- Farbe des Kerzentimers, wenn er UNTER dem vom Benutzer eingestellten Prozentsatz liegt. 3- Fa
FREE

Erklärungen zum Candle Time Indicator Der Candle Time Indicator für MetaTrader 5, zeigt Benutzern die Restzeit bis der neue Bar gezeichnet wird. Candle Time Indicator settings. TextColor: die Farbe des Textes; FontSize: die Größe des Textes; Installationsanweisungen Kopiere CandleTime.ex5 indicator in den Ordner MQL5 der Metatrader 5 Plattform. You can gain access to this folder by clicking the top menu options, that goes as follows: Datei> Dateiordner öffnen > MQL5 > Indicators(hier einfügen).
FREE

Synthetic Reverse Bar ist eine Weiterentwicklung des Reverse Bar Indikators. Es ist bekannt, dass Candlestick-Muster am besten in höheren Zeitrahmen (H1, H4) funktionieren. Allerdings können sich Candlesticks in solchen Zeitrahmen bei verschiedenen Brokern unterschiedlich bilden, da sich die Endzeit des einzelnen Symbols unterscheidet, während die Geschichte der Notierungen auf M1 und M5 gleich bleibt! Infolgedessen werden erfolgreiche Muster oft nicht auf höheren Zeitrahmen gebildet! Synthetic

Simple Range Filter ist ein Indikator, der entwickelt wurde, um Kerzen mit hoher oder niedriger Volatilität hervorzuheben. Er berechnet die durchschnittliche Spanne (High - Low) über eine definierte Anzahl von Kerzen und passt die Schwellenwerte dynamisch an die Marktbedingungen an. Hauptfunktionen: Dynamische Berechnung der durchschnittlichen Spanne Visuelle Hervorhebung von Kerzen mit über- oder unterdurchschnittlicher Spanne Konfigurierbare Parameter für Farben und Berechnungszeitraum Echtze
FREE

Sie können konfigurieren, dass mehrere Gewinnmitnahmeziele auf der Grundlage des aktuellen Kurses angezeigt werden, die alle auf der Volatilität basieren; Ich persönlich benutze es jeden Tag mit einem Skript, um meine Eingaben zu automatisieren; Wenn ich zum Beispiel bei einer Volatilität von 4 aussteigen möchte und einen Take Profit von 10 basierend auf den 2 Minuten der letzten 20 Bars verwenden möchte, kann ich das mit diesem Indikator tun; Sie können mehrere Take-Profits und Stopps mit unter
FREE

RS Zone ist ein Indikator, der verwendet wird, um die Unterstützungs- und Widerstandsniveaus jedes Vermögenswerts darzustellen. und jede Zeitperiode, wie wir sie festlegen Das Prinzip zur Berechnung der Unterstützungs- und Widerstandsniveaus basiert auf der Preisspanne (Range SR), um zu sehen, ob es Punkte gibt, an denen der Preis wiederholt auf diesem Preisniveau umkehrt oder nicht. Der Gesamttopf wird gleich der von uns festgelegten Gesamt-SR sein . Beispiel: Wenn Range SR gleich 120 ist, such
FREE

Der Kijun-Sen Envelope Indikator ist ein leistungsstarkes Trendfolge-Tool, das auf der Kijun-Sen -Linie des Ichimoku-Kinko-Hyo-Systems basiert. Dieser Indikator erstellt dynamische obere und untere Bänder um die Kijun-Sen-Linie und bildet eine Hülle, die Händlern hilft, Markttrends, potenzielle Umkehrungen und überkaufte/überverkaufte Zustände zu identifizieren.
Hauptmerkmale: • Trendbestätigung – hilft dabei, starke Aufwärts- oder Abwärtstrends zu erkennen. • Unterstützungs- und W
FREE

Der TickCounter-Indikator zählt Aufwärts- und Abwärtsticks auf jedem neuen Balken.
Die Berechnung beginnt ab dem Moment, in dem der Indikator auf dem Chart platziert wird.
Histogrammbalken stellen dar: Gelbe Balken - Gesamtzahl der Ticks; Blaue Balken - Ticks UP; Rote Balken – Ticks NACH UNTEN. Wenn der blaue Balken nicht sichtbar ist, gibt es mehr Abwärtsticks und der rote Balken wird über dem blauen angezeigt (die rote Ebene befindet sich über der blauen). MT4 version: https://www.mql5.com

TransitTrendlines ist ein automatischer Trendlinienzeichner, der sowohl horizontale als auch diagonale Trendlinien zeichnet. Die horizontalen Trendlinien sind die Pivotpunkte des Tageszeitrahmens und die diagonalen Trendlinien basieren auf den aktuellen Zeitrahmen. Sie können die diagonalen Trendlinien anpassen, indem Sie die Anzahl der Balken erhöhen, um die diagonale Trendlinie zu zeichnen, und Sie können auch die Steilheit anpassen. Beachten Sie, dass die horizontalen Trendlinien auf den Tage
FREE

Erkennen Sie Trades mit hoher Wahrscheinlichkeit: Sandwich Bar Breakouts auf Knopfdruck Dieser Indikator erkennt Sandwich-Bars aus mehreren Handelsspannen, ein äußerst zuverlässiges Ausbruchsmuster. Ein Sandwich-Setup besteht aus einem einzelnen Balken, der mehrere vorangegangene Balken verschlingt und die gesamte Preisspanne durchbricht und verwirft. [ Installationsanleitung | Updateanleitung | Fehlerbehebung | FAQ | Alle Produkte ] Einfache und effektive Anwendung Anpassbare Balkenbereiche An
FREE

Dieser Indikator summiert die Differenz zwischen der Aggression der Verkäufe und der Aggression der Käufe, die in jeder Kerze aufgetreten sind, und stellt die Wellen der Akkumulation des Aggressionsvolumens grafisch dar. Durch diese Wellen wird ein exponentieller Durchschnitt berechnet, der die Richtung des Geschäftsflusses anzeigt.
Hinweis: Dieser Indikator funktioniert NICHT für Broker und/oder Märkte OHNE die Art der Aggression (BUY oder SELL). Probieren Sie unbedingt unsere Professional-Ver
FREE

Der SMTrendLine-Indikator basiert auf den Prinzipien der grafischen Konstruktion von Bollinger-Bändern.
Grafisch gesehen handelt es sich bei den Bollinger Bändern um zwei Linien, die die Preisdynamik von oben bzw. von unten begrenzen. Es handelt sich dabei um eine Art Unterstützungs- und Widerstandslinien, die sich meist auf weit vom Kurs entfernten Ebenen befinden.
Wie wir wissen, sind die Bollinger-Bänder den Umschlägen der gleitenden Durchschnitte ähnlich. Der Unterschied zwischen ihnen be
FREE

Strifor Pivot + ATR Target
Pivot Levels Indikator mit ATR-basierten Zielen und Analysepanel
für MetaTrader 5 Strifor Pivot + ATR Target ist ein Tool für den Intraday- und mittelfristigen Handel, das klassische Pivot Levels mit dynamischen ATR-Targets und einem informativen Analysepanel kombiniert. Der Indikator hilft Ihnen, die Handelsspanne im Voraus einzuschätzen, wahrscheinliche Preisreaktionszonen zu identifizieren und das Bewegungspotenzial abzuschätzen - ohne manuelle Berechnungen und sub
FREE
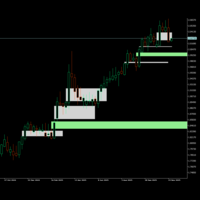
Wenn Ihnen dieses Produkt gefällt, geben Sie ihm bitte eine 5-Sterne-Bewertung als Zeichen der Wertschätzung.
Dieser Indikator identifiziert und zeigt Fair Value Gaps (FVG) auf Preisdiagrammen an.
Fair Value Gaps sind Preiszonen, in denen ein erhebliches Ungleichgewicht zwischen Kauf- und Verkaufsdruck besteht, wodurch "Lücken" im Preisgeschehen entstehen. Der Indikator erkennt zwei Arten und wann sie gemildert (berührt) werden:
Bullish FVG: Wenn das Tief einer Kerze über dem Hoch einer Kerze
FREE

Tick Velocity Pro - Der Echtzeit-Marktimpulsindikator Tick Velocity Pro ist ein Tick-basierter Momentum-Analysator der nächsten Generation, der Tick-Rohdaten in eine Live-Visualisierung der Marktenergie umwandelt.
Er verfolgt die Geschwindigkeit und Richtung jedes Preis-Ticks - und zeigt, ob Käufer oder Verkäufer dominieren - und wandelt dies in ein übersichtliches, leicht zu lesendes Histogramm um. ️ Kernkonzept Jeder eingehende Tick wird in Echtzeit analysiert: Aufwärtsticks → Käufermom
FREE

Die Monthly Weekly Open Line ist ein Indikator, der den aktuellen Monat abbildet: Die offene Linie des aktuellen Monats, die sich bis zur letzten Woche des Monats erstreckt. Wöchentliche Linien, die sich über den von Ihnen eingestellten Zeitraum von Rückblickstagen erstrecken. Jede Linie erstreckt sich von der jeweiligen wöchentlichen Montag-Null-GMT bis zum Freitag der jeweiligen Woche. Monatliche und wöchentliche offene Linien können für den Aufbau sehr leistungsfähiger und konsistenter Hande
FREE
https://www.mql5.com/en/users/gedeegi/seller
GEN FXTrendZones GEN FXTrendZones ist ein Indikator für die technische Analyse, der entwickelt wurde, um mit Hilfe von Fibonacci-Retracement- und Extension-Levels wichtige Preiszonen zu identifizieren und gleichzeitig Marktstrukturveränderungen wie Break of Structure (BoS) und Change of Character (CHoCH) zu erkennen. Der Indikator hilft Händlern, kritische Swing-Bereiche und potenzielle Trendfortsetzungs- oder -umkehrzonen zu erkennen. Er umfasst ein
FREE

AP Tag-Woche-Monat Hoch-Tief Overlay, das die Höchst-/Tiefstwerte des Vortags, der Woche und des Monats auf einem beliebigen Diagramm anzeigt. Hervorragend geeignet für die Planung von Sitzungen, Zusammenflüsse und Warnungen, wenn der Kurs zu wichtigen Swing-Levels zurückkehrt. Was es macht Zeichnet 6 Linien: Höchst-/Tiefstkurs des Tages , Höchst-/Tiefstkurs der Woche , Höchst-/Tiefstkurs des Monats (aus den letzten abgeschlossenen Sitzungen). Berührungs- und Annäherungswarnungen , wenn der Kurs
FREE
Der UZFX SWS {Scalping Winning Signals} Pro v1.0 ist ein leistungsstarker, nicht übermalender Indikator, der von Usman Zabir (UZFX LABS) speziell für Scalper, Daytrader und Swingtrader entwickelt wurde, die präzise Einstiegssignale in schnelllebigen Märkten suchen. Ideal für Trader, die zuverlässige Echtzeit-Signale ohne Verzögerungen oder falsche Übermalungen benötigen.
MEINE EMPFOHLENEN* BESTEN ZEITRAHMEN: 30 M UND MEHR. {1H} IST MEIN FAVORIT. UND DIE ERGEBNISSE SIND UMWERFEND...!
Zu den wic

Dieser Multi-Timeframe- und Multi-Symbol-Indikator scannt nach Pin-Bars, Morgen-/Abendsternen, Engulfings, Tweezers, Three Line Strikes, Inside Bars und Wimpel und Dreiecken. Der Indikator kann auch im Single-Chart-Modus verwendet werden. Bitte lesen Sie mehr über diese Option in den Produktinformationen bloggen . In Kombination mit Ihren eigenen Regeln und Techniken ermöglicht Ihnen dieser Indikator, Ihr eigenes leistungsstarkes System zu erstellen (oder zu verbessern). Merkmale
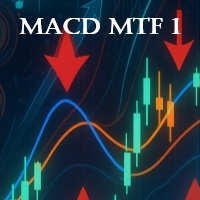
MACD MTF 1 - Multi-Timeframe MACD Ein professioneller MACD-Indikator, der alle Timeframes unterstützt!
Zeigt das Histogramm und die Signallinie übersichtlich in einem separaten Fenster an, um Ihnen zu helfen: Die aktuelle Marktdynamik zu erkennen. Marktumkehrungen einfach zu verfolgen. Optimale Einstiegs- und Ausstiegspunkte zu wählen, ohne den Zeitrahmen zu wechseln. Anpassbare Einstellungen: Zeitrahmen für jede Strategie. Schnelle und langsame gleitende Durchschnitte. Empfindlichkeit der Signa
FREE

MarketCrack – Whale Detector: Mit Smart Money im Einklang MarketCrack – Whale Detector ist ein professioneller Indikator, der entwickelt wurde, um die Aktivität großer Marktteilnehmer, bekannt als „Wale“, visuell und vorausschauend zu erkennen. Sein Zweck ist es, Schlüsselmomente erheblichen institutionellen Drucks zu identifizieren, wodurch Trader sich an der Richtung des intelligenten Geldes ausrichten und strategische Entscheidungen mit größerem Vertrauen treffen können. Funktionalität und Zi

MACD Pro - MACD-Indikator für MetaTrader 5 Beschreibung
MACD Pro ist ein Moving Average Convergence Divergence (MACD) Indikator für MetaTrader 5. Er folgt der Standard-MACD-Berechnungsmethode und zeigt Trendrichtung und Momentum in einem separaten Indikatorfenster an. Elemente des Indikators MACD-Linie, die auf der Differenz zwischen schnellen und langsamen exponentiellen gleitenden Durchschnitten basiert Signallinie, berechnet als exponentiell gleitender Durchschnitt der MACD-Linie Histogramm,
FREE

Der Gann Box Indikator ist ein leistungsstarkes und vielseitiges Werkzeug, das dazu entwickelt wurde, Händlern zu helfen, die Schlüsselniveaus des Marktes zu identifizieren und zu nutzen. Dieser Indikator ermöglicht es, ein Rechteck im Diagramm zu zeichnen, das automatisch in mehrere Zonen mit strategischen Niveaus 0, 0.25, 0.50, 0.75, 1 unterteilt wird. Wenn der Preis eines dieser Niveaus erreicht, werden Warnungen ausgelöst, was eine wertvolle Hilfe bei Handelsentscheidungen bietet. Sie wissen
Der Trendline Automatic Indikator ist ein fortschrittliches technisches Analysewerkzeug, das speziell entwickelt wurde, um Händler bei der Identifizierung kritischer Niveaus auf den Finanzmärkten durch das automatische Einzeichnen von Unterstützungs- und Widerstandstrendlinien auf den Preisdiagrammen zu unterstützen. Dank seiner automatischen Funktionen spart dieser Indikator den Händlern Zeit und Mühe bei der Analyse von Kursbewegungen und ermöglicht es ihnen, sich auf bessere Handelsentscheidu
FREE

Das ADX-Histogramm ist eine moderne und visuelle Erweiterung des klassischen Average Directional Index (ADX ).
Es wandelt die Standard-ADX- und DI+ / DI--Werte in ein farbkodiertes Histogramm um, wodurch die Trendanalyse viel klarer und schneller wird. Hauptmerkmale: Histogramm mit vier Zuständen : Blau = Normaler Kauftrend Grün = Starker Kauftrend Orange = Normaler Verkaufstrend Rot = Starker Verkaufstrend Automatische Erkennung der Stärke : verwendet die ADX-Linie, um "normale" von "starken" S
FREE

TrendBite v1.5 – Professioneller Trendfolgeindikator Entwickler: 8aLt4 Version: 1.5 Plattform: MetaTrader 5
Überblick TrendBite v1.5 ist ein fortschrittlicher Indikator für die technische Analyse, der entwickelt wurde, um Trendänderungen auf dem Markt zu erkennen und Anlegern klare Kauf- und Verkaufssignale zu liefern. Basierend auf dem Bollinger-Bänder-Algorithmus erfasst dieses Tool Trendwenden präzise und ist sowohl für Anfänger als auch für erfahrene Trader ideal.
Hauptmerkmale Trender
FREE
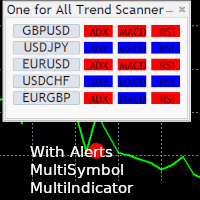
One for All Trend Scanner ist ein trendfolgender Multi-Symbol-Indikator, der mit jedem Input verwendet werden kann: Forex, Aktien, Rohstoffe,... Das Panel zeigt drei Indikatoren und sechs Symbole mit dem Trend für jedes Paar (Symbol/Indikator): aufwärts, abwärts oder kein Trend. Die Indikatoren sind: Durchschnittlicher direktionaler Bewegungsindex (ADX) Gleitender Durchschnitt Konvergenz Divergenz (MACD) Relative Stärke Index (RSI) Sie können wählen, welche Indikatoren für den Ein- und Ausstieg
FREE

Dies ist ein OLD-Indikator, der ziemlich effizient war, um mit MA Cross, Bollinger Bands, Dochian Channel und viele andere Strategien gepaart werden und dies bietet Ihnen mit Marktwechsel von BEAR und BULL Trends. Da es nicht viel in MT5 Market gibt, möchte ich meinen eigenen Indikator für Ihren Gebrauch teilen. Bitte zögern Sie nicht, zu kommentieren oder zu kritisieren, um den Indikator zu verbessern und zu erweitern.
FREE

Einführung
Der RSI Plus ist ein innovatives technisches Analyseinstrument, mit dem die Stärke und Richtung des Markttrends gemessen werden kann. Im Gegensatz zum traditionellen RSI-Indikator zeichnet sich der RSI Plus durch seine Fähigkeit aus, sich an die Marktvolatilität anzupassen und darauf zu reagieren, während er gleichzeitig die Auswirkungen kleinerer, kurzfristiger Marktschwankungen minimiert.
Signal
Kaufen Sie, wenn sich der RSI Plus einige Zeit im überverkauften (roten) Bereich bef
FREE

Der Indikator bestätigt die Stärke des Trends anhand des gehandelten Volumens. Die Kerzen werden in grüner Farbe angezeigt, um die Kaufstärke anzuzeigen, und in roter Farbe, um die Verkaufsstärke anzuzeigen. Die Bewegung wird durch den parabolischen SAR abgeschlossen. Vorteile: Filtert Preisverzerrungen ohne Finanzvolumen heraus; Filtert Konsolidierungen und Seitwärtsbewegungen heraus; Filtert Volumendivergenzen durch den Money Flow Indikator heraus. Nachteile: Es werden nicht alle falschen Ausb
FREE

APICT Chart Patterns - Erkennung von Trendlinien und Mustern für MT5 Verbessern Sie Ihre technische Analyse mit dem APICT Chart Patterns Indikator - ein fortschrittliches Tool zur automatischen Erkennung von Mustern und Trendlinien im MetaTrader 5. Hauptmerkmale Automatische Erkennung von Mustern: Identifiziert über 10 klassische Chartmuster, einschließlich Wimpel, Keile, Kanäle und doppelte Tops/Bottoms. Trendlinien in Echtzeit: Zeichnet Unterstützungs- und Widerstandslinien mit Hilfe intellig
FREE

VWAP Machine Learning Bänder: Der vorausschauende Vorteil für Trader Erschließen Sie die nächste Ebene der Marktanalyse mit den VWAP Machine Learning Bändern – einem innovativen MQL5-Indikator, der entwickelt wurde, um Ihnen unvergleichliche Einblicke in Markttrends, dynamische Unterstützungs-/Widerstandszonen und hochwahrscheinliche Handelssignale zu liefern. Dieser Indikator nutzt einen proprietären adaptiven Machine-Learning-Algorithmus, der mit der Leistungsfähigkeit des volumengewichteten D
Der MetaTrader Market ist eine einzigartige Plattform für den Verkauf von Robotern und technischen Indikatoren.
Das Merkblatt für Nutzer der MQL5.community informiert Sie über weitere Möglichkeiten: nur bei uns können Trader Handelssignale kopieren, Programme bei Freiberuflern bestellen, Zahlungen über das Handelssystem automatisch tätigen sowie das MQL5 Cloud Network nutzen.
Sie verpassen Handelsmöglichkeiten:
- Freie Handelsapplikationen
- Über 8.000 Signale zum Kopieren
- Wirtschaftsnachrichten für die Lage an den Finanzmärkte
Registrierung
Einloggen
Wenn Sie kein Benutzerkonto haben, registrieren Sie sich
Erlauben Sie die Verwendung von Cookies, um sich auf der Website MQL5.com anzumelden.
Bitte aktivieren Sie die notwendige Einstellung in Ihrem Browser, da Sie sich sonst nicht einloggen können.