Guarda i video tutorial del Market su YouTube
Come acquistare un Robot di Trading o un indicatore
Esegui il tuo EA
hosting virtuale
hosting virtuale
Prova un indicatore/robot di trading prima di acquistarlo
Vuoi guadagnare nel Market?
Come presentare un prodotto per venderlo con successo
Indicatori tecnici per MetaTrader 5 - 28

Indicator Overview Latest Updates: Update 02-23-2025: This version includes further optimizations for improved signal accuracy. Update 01-13-2025: Now compatible with the upcoming Web Request App, which will replace the AutoSignal_Connection bot. Purpose
This MT5 indicator is designed for analyzing 3-minute Heiken Ashi candles, generating buy and sell signals based on moving average (MA) crossovers. It provides visual signals and alerts, making it a valuable tool for traders. Heiken Ashi Candl

Quante volte avete cercato un PIVOT che funzionasse su una candela specifica ogni giorno?
Molti trader amano stimare la direzione del trend del giorno in base a un momento specifico, come 30 minuti dopo l'apertura del mercato, o alle 12.00, e così via.
Questo indicatore consente di specificare un determinato orario (ora e minuti) e traccia un pivot da quell'ora al giorno successivo alla stessa ora. Mostra cinque linee basate su quella specifica candela/ora: mediana, massimo, minimo, supporto
FREE

QUESTO INDICATORE FA PARTE DELL'EA: HIPERCUBE PRO GALE BTC Codice sconto del 20% per Darwinex Zero: DWZ2328770MGM_20
Introduzione alla nuova versione dell'indicatore Donchian
Siamo entusiasti di presentare la nuova versione dell'indicatore Donchian , progettata con miglioramenti all'avanguardia e una precisione maggiore. Ora completamente adattato per HiperCube Pro Gale , questo strumento aggiornato offre un'esperienza fluida per un trading più efficace.
Perché questa versione è rivoluzio
FREE

I'm sure after a lot of research on the internet, you haven't found any indicator that can help you with forex or binary trading in the latest probability strategy created by famous trader Ronald Cutrim. The strategy is based on a simple count of green and red candles, checking for a numerical imbalance between them over a certain period of time on an investment market chart. If this imbalance is confirmed and is equal to or greater than 16%, according to trader Ronald Cutrim, creator of the pro
FREE

Taking orders, now on MT5 the TPX Dash Needle is everything you need to find the famous Didi Needles on several timeframes and in several pairs at the same time. These are the simultaneous meeting of the 3, 8 and 20 averages that, aligned with the ADX indicator, are synonymous with large and strong movements in the market. Now with the new Heiken Aish filter, the name of the pair shows the direction of the Heiken Aish you choose, it can be weekly or daily, all signals will appear on the screen,

The Breakout Box for MT5 is a (opening) range breakout Indicator with freely adjustable: - time ranges - end of drawing time - take profit levels by percent of the range size - colors - font sizes It can not only display the range of the current day, but also for any number of days past. It can be used for any instrument. It displays the range size and by request the range levels and the levels of the take profit niveaus too. By request it shows a countdown with time to finish range. The indic

The Stochastic Momentum Index (SMI), developed by William Blau and featured in the January 1993 edition of Technical Analysis of Stocks & Commodities magazine, introduces a unique perspective to trading analysis. Distinguished from the conventional Stochastic Oscillator, which evaluates the current close in relation to the recent x-period high/low range, the SMI assesses the close's position relative to the midpoint of this range. This innovation yields an oscillator with a range of +/- 100, re
FREE

TickFlow is a tool for tick-data analysis and visual highlighting of significant zones on the chart. The utility aggregates current and historical ticks, shows the buy/sell balance, and helps to identify support/resistance levels and cluster zones. This is the MetaTrader 4 version. How it works (brief) TickFlow collects tick data and aggregates it by price steps and candles. Based on the collected data the indicator builds visual layers: up/down tick counters, buy/sell ratio, historical levels

Cybertrade ATR Trend Zone - MT5 The indicator shows, by calculating the ATR (Average True Range), the zone of probable price resistance. Indicated to be used as a probable exit point of an operation.
It works on periods longer than the period visible on the chart. All values are available in the form of buffers to simplify possible automations. This indicator is the same one we use in our EA. Also check out our other products.
FREE
If you like this product, please give it a 5 star rating as a token of appreciation.
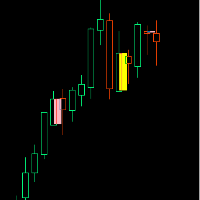
Inside Bar: A candle that is completely contained within the high-low range of the previous candle
Outside Bar: A candle that completely engulfs the high-low range of the previous candle (also called an "Engulfing Bar")
Inside Bars Consolidation Signals : Indicates market indecision/compression Breakout Setup : Often precedes significant price moves Continuation Patterns : Can signal pause in trend before con
FREE

SMC Trend Momentum Signal Line
SMC Trend Momentum Signal Line is an MT5 indicator that draws a smoothed on-chart line and colors it in real time: lime for positive momentum, tomato for negative, derived from the “SMC Trend Momentum” subwindow oscillator. This gives you immediate momentum direction directly in the main chart. Note: You must purchase the “SMC Trend Momentum” to see the line. The SMC Trend Momentum Signal Line is and will remain free of charge for you. Key Features Colored On-Char
FREE
Engulfing Zone Sniper MT5 — Multi-Timeframe Signal & Zone Indicator The Engulfing Zone Sniper MT5 is a technical analysis tool designed to highlight engulfing candlestick patterns in combination with adaptive support/resistance zones. It provides visual markers and optional alerts to assist traders in identifying market structure reactions across multiple timeframes. Key Features Multi-Timeframe Detection – Option to scan higher timeframe engulfing setups with lower timeframe confirmation. Su

The HammerStar indicator is designed to search for the Hammer and Shooting Star patterns on charts of any currency pairs.
Hammer Downward trend.
The lower shadow is not less than 2 and no more than 3 times larger than the body.
There is no upper shadow, or it is very short (no more than 10% of the candlestick range).
The color of the body in the long game is not important, with the short - white hammer is much stronger than the black one.
Confirmation is suggested.
Shooting Star Uptrend.
The u
FREE

QUANTUM OBSERVATION ENGINE Advanced Market Structure & Dominance Visualization Tool
Quantum Observation Engine is a professional-grade, non-repainting market analysis indicator designed for traders who prefer clarity, structure, and decision control instead of direct buy/sell signals.
This tool does NOT give forced trade entries. Instead, it reveals the internal state of the market in real time.
WHAT THIS TOOL DOES
Quantum Observation Engine con
FREE

Bollinger bands out/in strategy A strategy created by Joe Ross, and very useful for finding trades when the market is overloaded. Indicator You don't need to find where there are entries on the chart, this indicator shows them for you. The entrance The trade is confirmed when the price closes outside the bollinger bands on a candle and the candle after the price closes inside the bands. comment I want to improve this indicator, so you can help me sending me your reviews and comments, thanks :).
FREE

AI SuperTrend Final – Adaptive Intelligence for Smarter Trading
The AI SuperTrend Final is not just another trend indicator—it is a next‑generation trading tool powered by adaptive intelligence. Designed for MetaTrader, this indicator combines the proven logic of SuperTrend with advanced filters such as Moving Average (MA), Average Directional Index (ADX), and a unique self‑learning mechanism. The result is a smart, evolving system that adapts to market conditions and continuously improves its
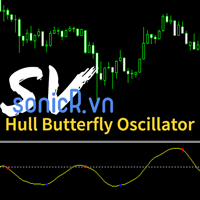
The Hull Butterfly Oscillator (HBO) is an oscillator constructed from the difference between a regular Hull Moving Average ( HMA ) and another with coefficients flipped horizontally . Levels are obtained from cumulative means of the absolute value of the oscillator. These are used to return dots indicating potential reversal points . This indicator draw line in separate window, plus blue dot (for buy signal) when hull oscillator is peak and red when sell signal. It also includes integrate

XE Forex Strengh Indicator MT5 displays visual information about direction and strength of a signal for current pair and chosen timeframes (M5, M15, M30 and H1). Calculations are based on multiple factors and results are shown as a colored panel with scale bar, numerical values and arrows. There are also displayed values of current price and spread on the pair. There can be activated an alert (as a mail or pop-up window with sound) for each available timeframes which send a message when the dir
FREE

Trendy Stock is a price following indicator that uses Stochastic to show when the price is out of the oversold or overbought areas. The algorithm allows you to stay longer in a trend where the bulls or bears are in control. The indicator changes color immediately the price exits oversold/overbought state. In short, the downtrend [red] bars start to paint when the buying pressure decreases while the uptrend [green] bars form as the buy pressure kicks in. For MT4 version, follow :: https://www
FREE

The script tries to determine the overall direction of the market, using smoothed Heiken Ashi candles. The coloring system (using bright and dark colors) is an attempt to detect strong market and weak market conditions. There's also an oscillator within the script
These are the features: Alert condition Features: You can now set alerts in the alert dialog for events like trend switch, trend strengthening and weakening; all for both Bullish and Bearish trend.
I also added the code for custom a
FREE
The Strat Dashboard - Scanner Multi-Simbolo per la Strategia “The Strat” di Rob Smith Trasforma il tuo trading con l’analisi multi-simbolo in tempo reale The Strat Dashboard è un indicatore professionale e potente, progettato specificamente per i trader che utilizzano la famosa metodologia “The Strat” di Rob Smith.
Monitora simboli illimitati su più timeframe, individua configurazioni ad alta probabilità all’istante e non perdere mai un pattern operativo importante. MT4 Version :- https://w

FRONTIER PIVOTS - Geometric Levels Indicator This indicator plots support and resistance levels/ranges on the chart using mathematical calculations. It helps traders identify potential price reaction zones based on geometric patterns. Main Features: Automatically calculates and displays key price levels Plots both support and resistance lines Uses daily price data for level calculation Clean visual presentation with different colors for different level types No repainting - levels remain static

Permettetemi di presentarvi il Golden Sniper Indicator , un potente strumento MQL5 creato con cura per i trader che desiderano migliorare la propria esperienza di trading. Sviluppato da un team di trader esperti con oltre 6 anni di esperienza , questo indicatore offre un metodo affidabile per identificare opportunità di trading con una notevole precisione. Caratteristiche principali : Allarmi e frecce di segnale : Il Golden Sniper Indicator fornisce allarmi tempestivi e frecce di segnale visive

ATHENA Quantum v4.0.1 - Professional Trading Indicator MetaTrader 5 Indicator
Build: 2026-02-05 OVERVIEW ATHENA Quantum combines AI pattern recognition, institutional microstructure analysis, and Smart Money Concepts to generate high-probability trade signals with comprehensive risk management. KEY FEATURES AI-Powered Signals Prometheus genetic algorithm engine Ensemble prediction (3-10 pattern voting) Confidence-based filtering No repaint - signals finalize on bar close Institutional A
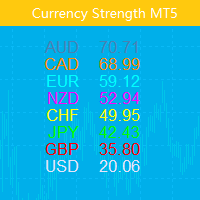
Questo indicatore mostra la forza relativa delle otto principali valute (USD, EUR, GBP, AUD, NZD, CAD, CHF, JPY). I valori della forza sono normalizzati nell'intervallo da 0 a 100. Un valore maggiore di 60 significa forte. Un numero inferiore a 40 indica debolezza.
biglietto Only Show Current Pair - Se vero, viene visualizzata solo la coppia di carte corrente. Altrimenti verranno visualizzate tutte le otto curve. Bars To Show – Numero di barre per visualizzare la curva di forza.

This is the latest offering from tr1cky.com. This is a session time indicator with customisable start and finish times. The indicator draws a vertical coloured line at the start and finish of the three institutional trading time zones. The session colours are as follows: Tokyo - Red London - Green New York - Blue Times are in Coordinated Universal Time (UTC)
FREE

The RSI Divergence Indicator is a powerful tool designed to identify potential reversals in the market by spotting discrepancies between the Relative Strength Index (RSI) and price movement. Divergences can be a significant indication of an impending trend change, either from bullish to bearish or vice versa. This indicator is built for making the task of identifying potential trade opportunities more straightforward and efficient.
Features: Automatic Detection: The indicator scans the chart
FREE

SMC Precision AI Unlock the edge of institutional trading with SMC Precision AI – an advanced AI-powered Smart Money Concept (SMC) based FIBO Retrenchment indicator built for serious traders who want precision, clarity, and high-probability trade setups.
Key Features It Plots Fibo Retrenchment Zones.
AI-Powered Signals – Enhanced by real-time AI logic to adapt to changing market conditions with Reasonable accuracy
Signal Clarity – It Draws Fibo Bands- When the Lower Line Is drawn it indicat

The purpose of Impulse Release is to prevent trading in the wrong direction. While the Impulse System operates in a single timeframe, Impulse Release is based on two timeframes. It tracks both the longer and the shorter timeframes to find when the Impulse points in the same direction on both. Its color bar flashes several signals: If one timeframe is in a buy mode and the other in a sell mode, the signal is "No Trade Allowed", a black bar. If both are neutral, then any trades are allowed, showi
Body Ratio Indicator per MT5 – Analizzatore della Forza delle Candele e della Compressione del Range Il Body Ratio Indicator è uno strumento tecnico progettato per analizzare la struttura delle candele giapponesi e identificare la condizione del mercato in base al rapporto tra il corpo della candela (differenza tra apertura e chiusura) e la sua escursione totale (massimo – minimo).
Questo calcolo semplice ma efficace aiuta i trader a rilevare candele con forte direzionalità, candele di indecisi
FREE
APICT Chart Patterns – Trend Line & Pattern Recognition for MT5 Enhance your technical analysis with the APICT Chart Patterns Indicator — an advanced tool for automatic pattern and trend line detection in MetaTrader 5. Key Features Automatic Pattern Detection: Identifies over 10 classic chart patterns, including pennants, wedges, channels, and double tops/bottoms. Real-Time Trend Lines: Draws support and resistance lines using smart algorithms. Custom Sensitivity: Adjust detection for major or
FREE
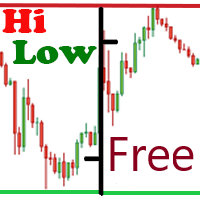
The free version of the Hi Low Last Day indicator . The Hi Low Levels Last Day indicator shows the high and low of the last trading day . The ability to change the color of the lines is available . Try the full version of the Hi Low Last Day indicator , in which additional indicator features are available : Displaying the minimum and maximum of the second last day Displaying the minimum and maximum of the previous week Sound alert when crossing max . and min . levels Selecting an arbitrary audio
FREE
The Vix_Fix indicator, or "Vix Fix," is a tool designed to identify potential market bottoms. It operates on the principle of measuring extreme fear or pessimism among the crowd, which are moments when the market often has a high probability of reversing to the upside. Main Purpose: To help traders find high-probability BUY (Long) entry points by identifying when the market is "oversold." How it Works In simple terms, the Vix Fix measures the distance between the current bar's Low and the Highes
FREE
1. Introduction The CM_Ultimate_RSI_MTF is a powerful and versatile custom indicator for MetaTrader 5, designed to enhance your Relative Strength Index (RSI) analysis. It provides multi-timeframe (MTF) capabilities, visual signals, and customizable alerts, making it an invaluable tool for traders seeking to identify overbought/oversold conditions, trend strength, and potential entry/exit points across various timeframes. 2. Key Features Multi-Timeframe (MTF) Analysis: Allows you to view RSI from
FREE

LogVar è un indicatore che calcola e mostra la variazione logaritmica del prezzo , un modo più preciso per misurare i cambiamenti percentuali tra periodi. Confronta il prezzo di chiusura attuale con quello di n periodi fa ( iPeriod ) e mostra il risultato su una scala logaritmica amplificata. La linea cambia colore automaticamente: Verde: prezzo sopra il riferimento (trend rialzista). Rosso: prezzo sotto il riferimento (trend ribassista). Il livello 0 è la linea neutra, che separa le variazioni
FREE

Indicatore di trottola reale
Rileva una trottola precisa sul grafico con un rapporto equilibrato tra corpo e altezza dello stoppino, che è il vero significato di trottola che lo differenzia da Hammers e Doji o Null Candlestick.
Questo indicatore traccia un'icona di wingdings in corrispondenza del numero di trottole trovate sul grafico.
Le impostazioni includono
Numero di barre: per regolare la ricerca in base al numero di barre
Colore dell'icona: cambia il colore dell'icona
Codice icona: m
FREE

Smoothed Supertrend Indicator - Indicatore di Tendenza Basato sulla Volatilità con Funzione di Levigatura Lo Smoothed Supertrend Indicator è una variante avanzata dell'indicatore Supertrend classico per MetaTrader 5. Attraverso l'integrazione di una funzione di levigatura aggiuntiva, il rumore di mercato viene ridotto e la qualità dei segnali di tendenza viene migliorata. Descrizione Tecnica: L'indicatore si basa sull'Average True Range (ATR) per misurare la volatilità del mercato e lo combina
FREE

The indicator plots two lines by High and Low prices. The lines comply with certain criteria. The blue line is for buy. The red one is for sell. The entry signal - the bar opens above\below the lines. The indicator works on all currency pairs and time frames It can be used either as a ready-made trading system or as an additional signal for a custom trading strategy. There are no input parameters. Like with any signal indicator, it is very difficult to use the product during flat movements. You
FREE

BITCOIN DAILY TOP BOTTOM ENGINE (V1)
This is not a simple indicator. This is a professional-grade market observation and decision engine designed for serious Bitcoin traders who demand clarity, structure, and precision.
The Bitcoin Daily Top Bottom Engine is built to identify high-probability daily extremes using adaptive range logic, sweep behavior analysis, and market condition filtering. Instead of reacting late, this engine prepares you in advance by defining where the market is most like
FREE

Hull Moving Average is more sensitive to the current price activity than a traditional Moving Average. It faster responds to trend change and more shows the price movement more accurately. This is a color version of the indicator. This indicator has been developed based in the original version created by Sergey <wizardserg@mail.ru>. Suitable for all timeframes.
Parameters Period - smoothing period, recommended values are 9 to 64. The larger the period, the softer the light. Method - smoothing m
FREE

The POC_Levels indicator calculates and displays the 3 most frequently occurring price levels (Points of Control – POC) based on historical candles. It is useful for identifying areas of high market interest (like support/resistance zones) across any timeframe. How It Works
The indicator analyzes the last LookbackBars candles. It counts how many times each price level (based on the selected price type) appears. Then it selects the top 3 most frequent prices and draws horizontal lines at those l
FREE

Version 1.5: manual color change added
This indicator helps to trade price action and momentum strategies like Guerrilla Trading or similar strategies.
The indicator displays: most recent highs and lows number of consecutive breaks past breaks of most recent highs and lows retest lines flag formations manual color change User can change colors. Go to Indictor Properties/Input, set "Auto Color" to false and change the colors. Set "Auto color" back to true to go back to pre-set colors. Please wa
FREE
Classic ZigZag formula. But no lags and repaints. You can see on screenshots that it shows values between peaks and it is useful to test strategies based on indicator. Because sometimes people find a good idea about it but don't understand that repainting indicators have some things to keep in mind. The parameters are the same as original ZigZag indicator: Depth, Deviation and Backstep. Useful for visual analyze of the chart and cut strategies based on repainting peaks.
FREE

Introduction
The SuperBands Indicator is a sophisticated technical analysis tool designed to provide traders with a clear visual representation of price movements within well-defined bands. This indicator is specifically engineered to filter out minor price fluctuations and market noise, offering traders a more accurate and reliable view of price trends and potential reversal points.
Signal
Buy when price breaks below the "Extremely oversold" band (darker red color) and then closes abo
FREE

MACD Pro – MACD Indicator for MetaTrader 5 Description
MACD Pro is a Moving Average Convergence Divergence (MACD) indicator for MetaTrader 5. It follows the standard MACD calculation method and displays trend direction and momentum in a separate indicator window. Indicator Elements MACD line based on the difference between fast and slow exponential moving averages Signal line calculated as an exponential moving average of the MACD line Histogram showing the difference between the MACD and signa
FREE

O Indicador valida a força da tendência utilizando o volume negociado. Os candles são mostrados na cor verde indicando força compradora e cor vermelha na força vendedora. O movimento é encerrado pelo SAR parabólico. Vantagens: Filtra distorções de preço sem volume financeiro; Filtra consolidações e movimentos laterais; Filtra divergências de volume pelo indicador Money Flow. Desvantagens: Não filtra todos os falsos rompimentos, visto que rompimentos importantes geram altos volumes financeiros; N
FREE

BTMM Continuation Sessions + Re-Entry Indicator (MT5) is a chart visualization tool designed to make continuation trading clearer and faster.
It draws session boxes (Asian, London, New York) and marks continuation entry + re-entry opportunities during active sessions.
Works on Forex pairs and XAUUSD (depending on broker symbols).
This is an indicator (not an EA). It does not place trades automatically.
Key Features
Session Boxes Asian, London, New York boxes Custom colors, opacity,
FREE

Purpose and functions of the indicator The indicator determines and marks the moments of trend change on the chart based on the theory of fractal levels breakout on any of the analyzed timeframes. If a breakout based on all rules is valid, a horizontal line with corresponding color will appear on the chart. If there is an uptrend, the line will be blue. In the descending trend, the line will be red. The blue line is a strong support level, the trader should look for buying opportunities above th
FREE

The indicator My Big Bars can show bars (candles) of a higher timeframe. If you open an H1 (1 hour) chart, the indicator puts underneath a chart of H3, H4, H6 and so on. The following higher timeframes can be applied: M3, M5, M10, M15, M30, H1, H3, H4, H6, H8, H12, D1, W1 and MN. The indicator chooses only those higher timeframes which are multiple of the current timeframe. If you open an M2 chart (2 minutes), the higher timeframes exclude M3, M5 and M15. There are 2 handy buttons in the lower r
FREE

This indicator is based on Mr. Mark Fisher's ACD strategy, based on the book "The Logical Trader."
- OR lines - A lines - C lines - Daily pivot range - N days pivot range - Customizable trading session - Drawing OR with the desired time Drawing levels A and C based on daily ATR or constant number - Possibility to display daily and last day pivots in color zone - Displaying the status of daily PMAs (layer 4) in the corner of the chart - Show the order of daily pivot placement with multi-day piv
FREE

Индикатор для синхронизации и позиционировании графиков на одном и более терминалах одновременно. Выполняет ряд часто необходимых при анализе графиков функций: 1. Синхронизация графиков локально - в пределах одного терминала при прокрутке, изменении масштаба, переключении периодов графиков, все графики делают это одновременно. 2. Синхронизация графиков глобально - тоже самое, но на двух и более терминалах, как МТ5, так и МТ4. 3. Позиционирование графика на заданном месте при переключении периодо
FREE
This indicator is a sophisticated MetaTrader 5 tool that calculates and displays Average Daily Range (ADR) levels on your chart. It draws horizontal lines representing expected price movement ranges based on historical daily volatility, helping traders identify potential daily high and low targets. ADR (Average Daily Range) = The average difference between the daily high and low over a specified period (default: 14 days). Unlike ATR which includes gaps between days, ADR focuses purely on int
FREE
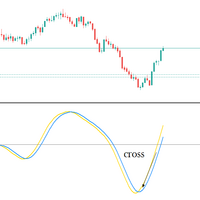
Big promotion on the Robos, Get yours now Robos Indicator The ROBOS indicator is a multi timeframe oscillator that targets the overbought and oversold regions of a price chart, a signal is indicated by the two lines crossing, compatible with all tradable instruments
Latest Release
The latest release is the version 4.0
#What's new in version 4.0 ?
Features
Extreme oversold and overbought levels
ROBOS version 4.0 comes with cool new feature , the ability to target only extrem

FX Correlation Matrix is a powerful multi-timeframe dashboard that helps traders analyze real-time currency correlations of up to 28 symbols at a glance. With customizable settings, sleek design, and manual symbol selection option, it enhances trade accuracy, reduces risk, and identifies profitable correlation-based opportunities. Setup & Guide: Download MT4 Version here. Follow our MQL5 channel for daily market insights, chart, indicator updates and offers! Join here.
Read the product des
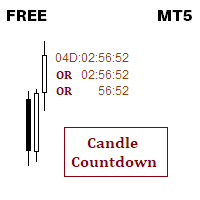
This indicator is about candle countdown timer
You can change timer color 3 colors can be set for different time range You can set font size, you can set font name If you need anything extra, ping me, I will add that functionality.
Thank you :) Always open to feedback and criticism if it helps me provide you more value. - Rahul
My other indicators you may like
[I have been trading forex for last 6 years and i publish every indicator that i build for my personal use so everyone can benefit]
FREE

Momentum Maxwell V1 PRO: The Sniper Hybrid Energy Momentum Maxwell V1 PRO no es un oscilador convencional; es una herramienta de precisión balística diseñada para el trader que opera como un francotirador . Mientras que los indicadores estándar se pierden en el ruido del mercado, el Maxwell V1 PRO utiliza un motor de triple filtrado de energía para detectar el agotamiento del precio con una nitidez quirúrgica. A diferencia del RSI o el Estocástico, que confinan sus datos en una escala artificial
FREE

AI Adaptive Market Holographic System Indicator Based on Microstructure and Field Theory Abstract: This paper aims to explore the construction principles and implementation mechanism of a novel financial market analysis tool—the Micro gravity regression AIselfregulation system. This system fuses Market Microstructure theory, classical mechanics (elasticity and gravity models), information entropy theory, and adaptive AI algorithms. By aggregating Tick-level data in real-time, physically modeling
Ratio Indicator - User Guide
Special Deal! Leave a review and get the indicator Long & Short Cointegration Analyzer for free — just send me a message!
This Ratio indicator between assets allows you to monitor and trade the price relationship between two assets selected by the user. It calculates the ratio between the prices of two assets, referred to as Asset1 and Asset2 (e.g., "GBPUSD" and "EURUSD"), and plots a moving average of the ratio along with Bollinger Bands . These bands are used to
FREE

This indicator displays the remaining time of the current candle, providing a visual representation of the time left until the candle closes and a new one begins, helping traders to make more informed decisions and stay on top of market fluctuations with precise timing, enhancing their overall trading experience and strategy execution, and allowing them to optimize their trades and maximize their profits.
FREE

Leggermente cambiato per la velocità. i tester sono necessari per un nuovo consulente, che è interessato, scrivimi via e-mail 777basil@mail.ru
https://backoffice.aurum.foundation/u/DHXP1U
L'indicatore viene calcolato in base alle variazioni di prezzo nella cronologia e viene calcolato matematicamente, ricalcolato ogni volta che i dati vengono ricevuti di nuovo. Può essere utilizzato su diversi tempi. Dai confini dell'indicatore nel 70% c'è un cambiamento nella direzione del movimento dei pre
FREE

Indicator introduction:
The indicator is calculated by volumes and prices, It is a single side indicator, only has up arrow signals. It is better to use it in conjunction with other trend indicators, and you need to find the most efficient time to use it in order to acquire a high winning probability. The indicator can send emails, alerts and notifications to you when the indicator before k line has an up arrow. The indicator's parameters can be changed, including the computation period of the
FREE
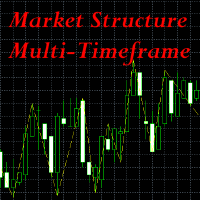
This indicator is extremely useful for traders who want to keep an eye on the market structure without wasting time drawing it manually. It also adds an important optional feature, which is MTF (Multi-Timeframe) analysis . Multi-Timeframe (MTF) analysis is a trading technique that consists of analysing the same financial instrument on different time intervals (charts) simultaneously, in order to gain a more complete view of the market. Starting with the analysis of higher timeframe charts to i
FREE
[ MT4 Version ] Order Block Indicator MT5 — Precision Trading Made Simple
Order Block Indicator MT5 is designed to help traders spot powerful reversal zones effortlessly — without cluttered charts or guesswork.
Built for scalping , swing trading , and smart intraday decisions , it highlights active order blocks across multiple timeframes with precision, speed, and full customization. Trade with clarity, save valuable time, and react instantly to market structure changes — even across Forex
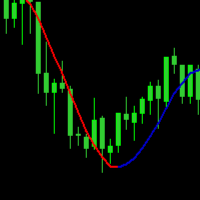
A moving average is simply a way to smooth out price fluctuations to help you distinguish between typical market “noise” and the actual trend direction . By “moving average”, we mean that you are taking the average closing price of a currency pair for the last ‘X’ number of periods. Like every technical indicator, a moving average (MA) indicator is used to help us forecast future prices.
FREE

Questo indicatore è stato sviluppato per aiutarti come trader a identificare la direzione del mercato, NEL trading abbiamo tre tipi di movimenti e UPTREND, DOWNTREND e SIDEWAYS, il movimento laterale del mercato è dove la maggior parte dei trader rimane intrappolata, poiché il prezzo è consolidare, questo significa semplicemente che non c'è direzione, per gli scalper questo può essere un vantaggio per loro SOLO se sanno come identificare quando le classi di attività sono in questo periodo.
Un
FREE

Description (English): Trend Test by Subho – Advanced Trend & Step Channel System Trend Test by Subho is a powerful all-in-one trend trading system designed to filter noise and provide clear market direction. This indicator combines two sophisticated algorithms: the Trend Test () and the Subho Step Channel into a single chart overlay. It also features a stylish Live Dashboard that alerts you to the current trend status in real-time. Key Features: Trend Test () Logic: An advanced tr
FREE
N/B: All our product purchase comes with our free ‘’DAILY SCALPER EA’’ - bit.ly/4qlFLNh Whatsapp Developer for yours after successful purchase
Eternal Spike Detector Pro - M5 Mastery System
HOW TO TRADE THIS SYSTEM
TRADING RULES
For CRASH 500/900/1000:
SELL SETUP:
· Wait for RED DOWN ARROW to appear · Enter SELL at the close of the M5 candle where arrow appears · Stop Loss: 1.5x ATR above the entry high · Take Profit: 2-3x ATR below entry · Only trade maximum 7 signals per day

Stochastic Color Alerts – Indicatore Intelligente di Momentum e Trend a Colori Stochastic Color è una versione avanzata e visiva dell’oscillatore stocastico classico, progettata per rendere più semplice l’identificazione dei cambiamenti di momentum e di trend attraverso colori dinamici e avvisi affidabili. Questo indicatore combina la logica tradizionale dello stocastico %K e %D con una linea principale che cambia colore, aiutando i trader a riconoscere rapidamente la direzione del mercato, i ca
FREE

The Price Action Finder Multi indicator is an indicator of entry points that searches for and displays Price Action system patterns on dozens of trading instruments and on all standard time frames: (m1, m5, m15, m30, H1, H4, D1, Wk, Mn). The indicator places the found patterns in a table at the bottom of the screen. By clicking on the pattern names in the table, you can move to the chart where this pattern is located. Manual (Be sure to read before purchasing) | Version for MT4 Advantages
1. Pat

“Naturu” è un indicatore manuale che utilizza la simmetria della natura come algoritmo.
Conquista il mercato con una strategia semplice e saggezza nascosta! Quando carichi l’indicatore, vedrai due linee: Top e Bottom.
Clicca una volta su una linea per attivarla. Per spostarla, basta cliccare sulla candela dove vuoi posizionarla. Definisci un punto alto e un punto basso, e l’indicatore calcola automaticamente: Una zona magenta che mostra dove gli interessi di tori e orsi sono più vicini, ossia l
Il MetaTrader Market è un sito semplice e pratico dove gli sviluppatori possono vendere le loro applicazioni di trading.
Ti aiuteremo a pubblicare il tuo prodotto e ti spiegheremo come prepararne la descrizione per il Market. Tutte le applicazioni sul Market sono protette da crittografia e possono essere eseguite solo sul computer dell'acquirente. La copia illegale è impossibile.
Ti stai perdendo delle opportunità di trading:
- App di trading gratuite
- Oltre 8.000 segnali per il copy trading
- Notizie economiche per esplorare i mercati finanziari
Registrazione
Accedi
Se non hai un account, registrati
Consenti l'uso dei cookie per accedere al sito MQL5.com.
Abilita le impostazioni necessarie nel browser, altrimenti non sarà possibile accedere.