Phibo MA SAR
- Indicators
-
Samuel Manoel De Souza
 Developer of trading algorithms with expertise in the platforms Metatrader 4, Metatrader 5, Trading View, Ninja Trader 8 and Quantower.
 - Version: 1.30
- Updated: 1 August 2022
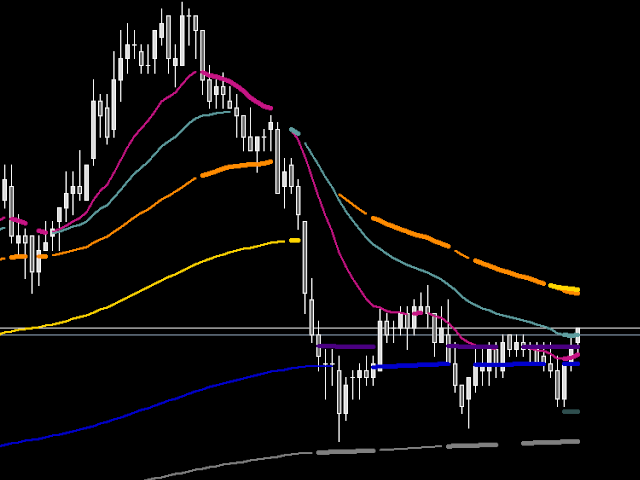
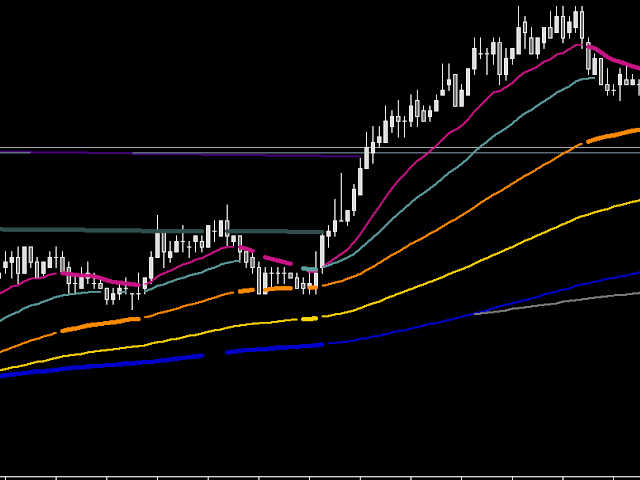
Baseado no indicador MIMA SAR, que é uma combinação dos indicadores MIMA Consolidação e MIMA Tendência, da metodologia Phicube. O indicador é composto pelos 8 fractais, 17,34.72.144.305,610.1292,2554. Sendo a tendência indicada pelas linhas finas e a consolidação pelas linhas mais espessas.
Para usar o indicador de maneira adequada deve-se partir do princípio de que tudo na natureza segue o caminho que oferece menor resistência. Isso significa que para uma reversão da tendência ocorrer nesse modelo é preciso ocorrer o alinhamento de pelo menos 5 linhas. Sendo as demais linhas, níveis adicionais de suporte e resistência que devem ser superados para estabelecer uma tendência pura.
Se todas as linhas estiverem alinhas para cima há uma pura tendência de alta e somente deve-se procurar por sinais de compra.
Se todas as
linhas estiverem alinhas para baixo há uma pura tendência de baixa e somente deve-se procurar por sinais de venda.
Se o preço estiver entre duas linhas, uma apontando para baixo e outra para cima então há uma consolidação e deve-se operar com base na
relação de risco retorno.
Para mais informações da metodologia consulte os tutoriais do Bo Willians no youtube.
Obs.:Esse indicador não é uma reprodução dos indicadores PhiCube e portanto difere do indicador MIMA SAR por não dispor do mesmo método de suavização das médias móveis.

Top esse indicador, estou aprendendo a programar, gostaria de saber como faz para ocultar as médias assim =)