Technische Indikatoren für den MetaTrader 5 - 18

Der Donchian-Kanal Kanäle gehören zu den beliebtesten Instrumenten der technischen Analyse, da sie dem Analysten visuell die Grenzen aufzeigen, innerhalb derer sich die meisten Kursbewegungen abspielen. Die Nutzer von Kanälen wissen, dass sie jederzeit wertvolle Informationen erhalten können, unabhängig davon, ob sich die Kurse im mittleren Bereich eines Bandes oder nahe an einer der Grenzlinien befinden.
Eine der bekanntesten Techniken zur Erforschung dieser Konzepte sind die Bollinger-Bänder
FREE
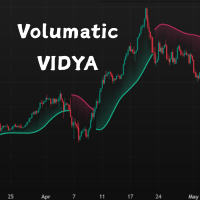
Dies ist ein benutzerdefinierter VIDYA-basierter Trendfolgeindikator für MetaTrader 5 (MT5), der mit einer ATR-Band-Logik zur Anpassung an die Marktvolatilität erweitert wurde. Er bietet dynamische Trendzonen und intelligente Richtungswechsel zur Unterstützung besserer Handelsentscheidungen.
Im Gegensatz zu traditionellen gleitenden Durchschnitten verwendet dieser Indikator einen momentumangepassten VIDYA (Variable Index Dynamic Average) und kombiniert ihn mit ATR-basierten Bändern , um Trendwe
FREE

Einzigartiger Indikator, der einen professionellen und quantitativen Ansatz für Mean-Reversion-Trading umsetzt. Es nutzt die Tatsache, dass der Preis auf vorhersehbare und messbare Weise umlenkt und zum Mittelwert zurückkehrt, was klare Ein- und Ausstiegsregeln ermöglicht, die nicht-quantitative Handelsstrategien bei weitem übertreffen. [ Installation Guide | Update Guide | Troubleshooting | FAQ | All Products ]
Klare Handelssignale Erstaunlich einfach zu handeln Anpassbare Farben und Größen Im

Smart SR Levels Support and Resistance - Professioneller stärkenbasierter Support & Resistance Indikator MT5
Hauptmerkmale: - Automatische Erkennung von signifikanten Unterstützungs- und Widerstandsniveaus - Liniendicke basierend auf der Stärke des Levels (Anzahl der Berührungen + Volumenfaktor) - Benutzerdefinierte Farben für Support und Resistance - Multi-Timeframe-Unterstützung - Saubere Hintergrundlinien (keine Überlappung mit Kerzen) - Beschriftung mit S/R-Typ und Stärke-Wert
Perfekt für
FREE

ICT Silberkugel
Wenn Sie auf der Suche nach einem zuverlässigen Indikator für den Handel mit dem ICT Silver Bullet-Konzept oder ICT-Konzepten, Smart Money Concepts oder SMC sind, wird dieser Indikator Ihre Bedürfnisse erfüllen! Before version 2.2, this indicator was focused only on ICT Silver Bullet, but moving forward, we will include the different elements for smart money concept trading. Dieser Indikator hilft Ihnen bei der Identifizierung der folgenden Punkte: FVG - Fair Value Gaps Marktstr

Einführung in den Fractal Pattern Scanner Fractal Indicator bezieht sich auf einen technischen Indikator, der die fraktale Geometrie des Finanzmarktes nutzt. Fractal Pattern Scanner ist ein fortschrittlicher Fraktalindikator, der nach umfangreichen Forschungs- und Entwicklungsarbeiten im Bereich der fraktalen Geometrie auf dem Finanzmarkt die neueste Handelstechnologie bietet. Das wichtigste Merkmal von Fractal Pattern Scanner ist die Fähigkeit, die Wahrscheinlichkeit des Wendepunkts sowie die T

Dieser Indikator zeigt farbige Kerzen an, wenn die Preise im Verhältnis zu ihren Durchschnittswerten stark verzerrt sind.
Ein guter Zeitpunkt für einen Kauf ist nach dem Schließen einer Silberkerze zu sehen. Das Muster wird zuverlässiger, wenn der Kauf eröffnet wird, wenn der Preis der Kerze nach der Silberkerze über dem Höchstpreis der Silberkerze liegt.
Ein guter Zeitpunkt für einen Verkauf ist nach dem Schließen einer rosa Kerze zu erkennen. Das Muster wird zuverlässiger, wenn der Verkauf
FREE

Dies ist ein Markttiefenindikator (DOM - Depth of Market) für MetaTrader 5, der Echtzeit-Orderbuchdaten in einem visuellen Leiterformat anzeigt. Der DOM bietet einen umfassenden Überblick über die Markttiefe mit klaren visuellen Hinweisen auf Volumenungleichgewichte, was ihn sowohl für Scalping- als auch Swing-Trading-Entscheidungen nützlich macht. Dieser Indikator bietet Händlern eine professionelle Visualisierung der Markttiefe, die an individuelle Handelsvorlieben und -strategien angepasst we

Der Außenstab Indikator zeigt eine Range von Innenstäben an und den Ausbruch nach oben und unten aus der Range. Der Ausbruch aus dem Aussenstab (alle anderen Stäbe in der Range sind Innenstab) wird immer mit dem Begin einer neuen Range angezeigt und bis zum erneuten Ausbruch erweitert. Die Berechnung erfolgt immer mit dem Beginn eines neuen Candles (Bar). Wird also in allen Timeframes entsprechend angezeigt. Im Inside Bar ( Insidebar | Innenstab ) - Handel kann man die Ober- und Unterseite ei
FREE

Phoenix Candlestick Pattern Monitor (MT5)
Echtzeit-Tool zur Erkennung und Überwachung von Kerzenmustern für MetaTrader 5. Identifiziert automatisch klassische Kerzenmuster über mehrere Symbole hinweg und zeigt umfassende Musterstatistiken über ein visuelles Dashboard an.
Übersicht
Der Phoenix Candlestick Pattern Monitor erkennt und verfolgt Doji-, Hammer-, Shooting Star-, Bullish Engulfing-, Bearish Engulfing-, Morning Star-, Evening Star-, Three White Soldiers- und Three Black Crows-Muster.
FREE

Der Stochastik-Indikator warnt wenn EA verfügbar in Kommentaren, muss Indikator installiert sein kauft die Hauptlinie der Stochastik über der Signallinie liegt Stochastik ist unter 30 rsi 5 liegt unter 20 verkaufen stochastische Hauptlinie liegt unter der Signallinie stochastik liegt über 70 rsi 5 liegt über 80 Zum Diagramm hinzufügen Stochastik k 30 - d 9 - Verlangsamung 3, Niveau 30/70 rsi 5 lelels 20.80
Vollständige Alarme Push, Handy, E-Mail ect Alle Eingabeeinstellungen variabel Kontaktier
FREE

Erweiterter Accelerator Oscillator (AC) Indikator mit Multi-Zeitrahmen-Unterstützung, anpassbaren visuellen Signalen und hochgradig konfigurierbarem Alarmsystem.
Funktionen: Visuelle Signalmarkierungen (Pfeile und/oder vertikale Linien) mit anpassbaren Farben und Codes Drei unabhängige Signalpuffer mit konfigurierbaren Auslösern (Richtungsänderung, Levelkreuzung, Spitze/Tal) Hochgradig anpassbare Alarmfunktionen für jedes Signal (per E-Mail, Push, Sound, Popup) Konfigurierbare Alarmzeit (nach
FREE

Bringen Sie die beliebte "Fadenkreuz mit Magnetmodus"-Funktionalität von modernen Charting-Plattformen direkt auf Ihr MetaTrader 5-Terminal. Crosshair for MT5 Das Fadenkreuz ist ein Präzisionswerkzeug für Trader, die Wert auf Genauigkeit legen. Im Gegensatz zum Standard-MT5-Fadenkreuz erkennt dieses intelligente Tool automatisch die Eröffnungs-, Höchst-, Tiefst- und Schlusskurse Ihrer Kerzen. Wenn Sie mit der Maus in die Nähe einer Kerze fahren, springt das Fadenkreuz auf den nächstgelegenen Doc
FREE
If you love this indicator, please leave a positive rating and comment, it will be a source of motivation to help me create more products <3 Wie verwendet man den Gann High-Low Activator? Der Gann HiLo Activator hilft dem Händler, den aktuellen Trend des Marktes zu erkennen. Wenn der Indikator unter dem Schlusskurs liegt, kann er auf einen Aufwärtstrend hindeuten. Liegt der Indikator hingegen über dem Schlusskurs, kann er auf einen Abwärtstrend hindeuten. Der Gann HiLo Activator generiert auch
FREE

ECHTE SPIKES ABLEITEN telegram channel for more information and other products: https://t.me/automated_TLabs
DM: https: //t.me/gg4rex
Professionelles Trend-Spike-Erkennungs- und Performance-Tracking-System für Boom- und Crash-Indizes Laden Sie hier das Benutzerhandbuch des Produkts herunter: WAS IST TRUE SPIKES? True Spikes ist ein präzisionsgefertigter Trendfolgeindikator, der speziell für die Erfassung explosiver Spike-Bewegungen in synthetischen Boom- und Crash-Indizes entwickelt wurde.
FREE
Dieser Indikator bietet ein klares, übersichtliches Dashboard zur Überwachung des Relative Strength Index (RSI) und des Stochastik Oszillators für jedes Instrument oder jeden Zeitrahmen.
Immer wenn sowohl der RSI als auch der Stochastik %K gleichzeitig ihre jeweiligen überkauften oder überverkauften Niveaus überschreiten, zeigt der Indikator ein Pfeilsignal im Indikatorfenster an.
Diese Signale heben ein starkes Momentum hervor und können Händlern helfen, schnell wahrscheinliche Umkehrzonen zu i
FREE

Steigern Sie Ihre Handelspräzision mit dem WH Trading Sessions MT5- Indikator für MetaTrader 5! Dieses leistungsstarke Tool hilft Ihnen, wichtige Marktsitzungen mühelos zu visualisieren und zu verwalten. Basierend auf: WH SMC Indicator MT5
MT4-Version: WH Trading Sessions MT4
Hauptmerkmale: Interaktives GUI-Panel – Einfaches Auswählen und Umschalten zwischen Handelssitzungen in Asien, London und New York .
Anpassbare Warnungen und Einstellungen – Passen Sie den Indikator
FREE
Wenn Ihnen dieses Produkt gefällt, geben Sie ihm bitte eine 5-Sterne-Bewertung als Zeichen der Wertschätzung.
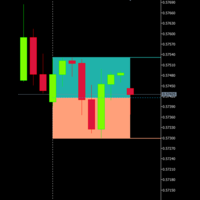
Dieser Indikator zeichnet die Premium- und Discount-Zonen einer einzelnen Kerze aus einem beliebigen Zeitrahmen auf Ihrem Chart.
Sie wählen die Kerze (aktuelle oder vorherige) mit CandleOffset, und der Indikator ruft automatisch das Hoch, das Tief und den Mittelpunkt dieser Kerze ab.
Anschließend wird visuell angezeigt:
Premium Zone (Upper 50%)
Ein schattiertes Rechteck vom Mittelpunkt
FREE

Dieser Indikator ist darauf ausgelegt, Umkehrmuster mit hoher Wahrscheinlichkeit zu erkennen: Double Tops/Bottoms mit gefälschten Ausbrüchen . Dies ist die kostenlose Version des Indikators: https://www.mql5.com/en/market/product/29957 Die kostenlose Version funktioniert nur für EURUSD und GBPUSD! Double Top- und Bottom-Muster sind Chart-Muster, die auftreten, wenn sich das Handelsinstrument in einem ähnlichen Muster wie der Buchstabe "W" (Double Bottom) oder "M" (Double Top) bewegt. Diese Muste
FREE

Kerzennummern-Indikator für MetaTrader 5 Der Candle Number Indicator zeigt eine numerische Beschriftung auf jeder Kerze an, beginnend mit dem jüngsten Balken. Dieses Tool hilft Händlern bei der visuellen Verfolgung des Kerzenverlaufs, was Strategien unterstützen kann, die auf Zeit, Struktur oder Mustererkennung basieren.
Merkmale: Nummeriert jede Kerze ab dem aktuellen Balken rückwärts Ermöglicht benutzerdefinierte Farbe, horizontale oder vertikale Textausrichtung und Etikettenversatz Option z
FREE

Der Indikator ist ein Analysetool, das 37 verschiedene Varianten gleitender Durchschnitte umfasst, die von Autoren wie Patrick Mulloy, Mark Jurik, Chris Satchwell, Alan Hull und anderen entwickelt wurden. Er ermöglicht historische virtuelle Tests. Der Indikator kann für verschiedene Instrumente verwendet werden, darunter Gold, Kryptowährungen, Aktienindizes, Währungspaare und andere Vermögenswerte. Ein integrierter visueller Backtester ermöglicht es Nutzern, virtuelle Handelspositionen zu simuli
FREE

GEN Sessions Bandprofil Entwickler: Gede Egi GEN Sessions Volume Profile ist ein MT5-Indikator, der die Volumenverteilung für jede Handelssitzung (täglich) in Form eines Volumenprofils anzeigt. Mit diesem Tool können Händler leicht erkennen, auf welchen Kursniveaus die höchste Handelsaktivität während einer Sitzung stattgefunden hat, was es einfacher macht, wichtige Marktbereiche zu identifizieren. Der Indikator stellt automatisch Session Boxes, Point of Control (POC), Value Area High (VAH), Va
FREE

Produktname: Harmonischer Konfluenz-Indikator (Basic Edition) Hinterlassen Sie eine 5-Sterne-Bewertung und erhalten Sie eine kostenlose Indikatorversion mit Handelsstufen (begrenzt auf die ersten 20 Personen)--!!! Überschrift: Automatisierter Harmonic Pattern Scanner mit Supply & Demand Confluence. Beschreibung: Erschließen Sie die Macht der geometrischen Marktstruktur mit dem Harmonic Confluence Indicator (Basic Edition) . Dieses leistungsstarke Tool wurde entwickelt, um Ihre Charts automatisch
FREE

BEHOLD!!!
Einer der besten Breakout-Indikatoren aller Zeiten ist da. Multi Breakout Pattern betrachtet die vorangegangenen Kerzen und Zeitrahmen, um Ihnen zu helfen, die Ausbrüche in Echtzeit zu erkennen.
Die eingebaute Funktion von Angebot und Nachfrage kann Ihnen helfen, Ihre Take-Profits und Stop-Losses zu bewerten
SIEHEN SIE DIE SCREENSHOTS, UM EINIGE DER BESTEN BREAKOUTS ZU ERLEBEN
INPUTS
MaxBarsback: Die maximale Anzahl der Bars, die zurückgeblickt werden
Slow length 1: Period lookba
FREE

Sind Sie es leid, Ihre Einstiege ständig zu hinterfragen? Sniper Entry Signal ist ein professionelles Handelssystem, das ein spezifisches Problem löst: das richtige Timing.
Im Gegensatz zu herkömmlichen Indikatoren, die verzögert reagieren oder nachzeichnen, nutzt dieses Tool eine ausgeklügelte „3-Timeframe-Konsens-Engine“. Sie analysiert gleichzeitig die Zeitrahmen M1, M5 und M15. Ein Signal wird nur dann generiert, wenn alle drei Zeitrahmen die Trendrichtung bestätigen.
Das Ergebnis? Sie fi
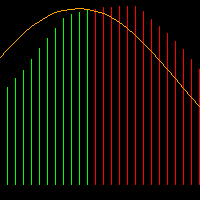
Der Impuls-MACD ist ein technischer Indikator, der die Stärke mehrerer gleitender Durchschnitte zu einem einzigartigen Momentum-Oszillator kombiniert. Im Gegensatz zu herkömmlichen MACD-Indikatoren verwendet dieses Tool drei verschiedene gleitende Durchschnitte, die auf hohe, niedrige und gewichtete Kursdaten angewendet werden, um präzisere Marktimpulssignale zu erzeugen. Seine Stärke ist die hervorragende Filterfunktion bei schwankenden Märkten. Visuelle Elemente Farbkodiertes Histogramm : Dyna
FREE

MomoPoints ist ein Indikator, der Long und Short Entry / Add Punkte im Chart anzeigt.
Basiertend auf Momentum und Trendstärke zeigen die MomoPoints Entrys / Adds mit guten Risk to Reward ratio.
Einstellungen
----------------------------------
Design: Es können Farben, die Größe sowie das Wingdings (Grafik Symbol) des Signals eingestellt werden.
Signal Einstellungen: Es können Moving Average Periode, Trendstärke, Abstand von Moving Average zu Preis und RSI Periode eingestellt werden.
Der Ind
FREE
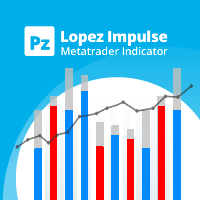
Dieser Indikator bewertet gleichzeitig die Volatilität und die Kursrichtung, wobei die folgenden Ereignisse ermittelt werden. [ Installationsanleitung | Update-Anleitung | Fehlerbehebung | FAQ | Alle Produkte ] Entscheidende und plötzliche Preisbewegungen Große Hämmer / Sternschnuppenmuster Starke Ausbrüche, die von den meisten Marktteilnehmern unterstützt werden Unentschlossene, aber volatile Marktsituationen Es ist ein extrem einfach zu verwendender Indikator ... Das blaue Histogramm repräsen
FREE

WAHRE BIAS Wissen, wohin der Markt will Sehen Sie die Marktrichtung über 6 Zeitrahmen gleichzeitig. Ein professionelles Dashboard mit Echtzeit-Bias-Analyse (M1, M5, M15, H1, H4, D1) mit Konfidenzniveaus, umsetzbaren Handelssignalen und intelligenter Kontrollpunkt-Erkennung. Was es tut: Zeigt die Marktrichtung für jeden Zeitrahmen mit dem Konfidenzniveau an - Grün = Kaufen, Rot = Verkaufen, Grau = Warten Liefert klare Handelsaktionen: STARKER KAUF, KAUF, VERKAUF, STARKER VERKAUF, LONG SWING, SHOR
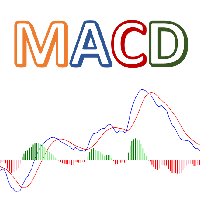
Colorful MACD ist die MT5-Version des Standard-MACD von TradingView. Dieser Indikator hat 4 verschiedene Farben für das MACD-Histogramm, so dass es sehr einfach ist, Schwankungen im Histogramm zu erkennen. Eigenschaften: Bunte Histogramm-Balken Signallinie anzeigen/ausblenden MACD-Linie ein-/ausblenden Flexible Preissteuerung Bitte rufen Sie mich an, wenn Sie weitere Eingabeparameter oder eine modifizierte Version dieses Indikators benötigen.
FREE

Die Verwendung des Stochastik-Oszillators mit einem gleitenden Durchschnitt ist eine einfache, aber sehr effiziente Strategie zur Vorhersage einer Trendumkehr oder -fortsetzung.
Der Indikator verschmilzt automatisch beide Indikatoren zu einem einzigen. Er gibt Ihnen auch visuelle und akustische Warnungen.
Er kann mit unserem programmierbaren EA, Sandbox, verwendet werden, den Sie unten finden: Unser programmierbarer EA: https: //www.mql5.com/en/market/product/76714 Viel Spaß mit dem Indikator!
FREE

Beschreibung:
Heikin-Ashi-ähnliche Swing-Oszillator-Kerzen. Er kann auf die gleiche Weise wie der RSI oder die Stochastik verwendet werden.
Zum Beispiel: Nulldurchgang. Oberhalb der Nulllinie ist bullish, unterhalb der Nulllinie ist bearish.
Überkauft oder überverkauft. Die 100er-Linie ist das extreme Kaufniveau, die -100er-Linie ist das extreme Verkaufsniveau.
Divergenzen.
Zeitrahmen: Beliebiger Zeitrahmen.
Instrument: Beliebiges Instrument.
FREE

Stop Loss Pro - Präzises Risikomanagement für jeden Trader
Stop Loss Pro ist ein leistungsstarker, kostenloser MetaTrader-Indikator, der das Rätselraten beim Risikomanagement überflüssig macht. Er basiert auf einer fortschrittlichen Marktstrukturanalyse und identifiziert automatisch die zuverlässigsten Stop-Loss-Levels und zeigt diese direkt auf Ihrem Chart an. Mit diesem Tool können Händler ihre Trades mit Zuversicht schützen, da sie wissen, dass jedes vorgeschlagene Level durch eine Mischung
FREE

Der Indikator für Angebot und Nachfrage wird nicht neu gezeichnet, da er die Anzahl der Tests/Retests zählt, die in der Vergangenheit x-mal stattgefunden haben. Als Händler benötigen Sie einen Weg, um Ihre Kauf- und Verkaufstransaktionen zu platzieren: Angebot und Nachfrage, Fallende und steigende Kanäle . Erfahrene Händler werden die wichtigsten Niveaus und Kanäle um die Zeitrahmen herum einzeichnen. Sie werden jedoch nicht in der Lage sein, sie auf den kleinen Zeitrahmen zu zeichnen, da sich
FREE

INFOPad ist eine Informationsanzeige, die Informationen zum ausgewählten Währungspaar im MetaTrader 5-Terminal erstellt. Es gibt 5 Funktionen dieses Indikators: Zeigt die wichtigsten und wichtigsten Informationen zum ausgewählten Symbol an: BID, Spread, Stop-Level, Swap, Tick-Wert, Provisionspreise; Zeigt die zukünftigen Ziele von SL-Ziel und TP-Ziel (Anzahl der Punkte des festgelegten Stop-Loss- und Take-Profit-Gewinns, Dollarbetrag); Es zeigt den erzielten Gewinn für die Zeiträume: Heute, Woc
FREE

Correlation Matrix Pro - Multi-Währungs-Korrelationsanalyse
Verstehen Sie die Beziehungen zwischen Währungspaaren in Echtzeit! Ein leistungsstarkes Analyse-Tool, das Ihnen hilft, statistische Zusammenhänge zwischen bis zu 6 Währungspaaren gleichzeitig zu visualisieren. Perfekt für Portfoliomanagement, Risikodiversifikation und Hedging-Strategien.
HAUPTFUNKTIONEN
- Echtzeit-Pearson-Korrelation mit logarithmischen Renditen - Bis zu 6 Währungspaare gleichzeitig überwachen - Automatische Zeitrahm
FREE

Der MetaTrader 5-Indikator "Rejection Block" bietet Händlern ein umfassendes Instrument zur Identifizierung und Visualisierung von Rejection-Candlestick-Mustern, die gemeinhin als Rejection Blocks bezeichnet werden. Diese Muster sind ausschlaggebend für die Erkennung potenzieller Marktumkehrungen oder -fortsetzungen, was sie für Händler, die ihre Analysen verbessern möchten, von unschätzbarem Wert macht. Hauptmerkmale: Erkennung von Rejection Blocks: Der Indikator scannt sorgfältig die Kursdaten
FREE

RSI Advanced - Verbessern Sie Ihre Analysen und Handelssignale mit hohem Potenzial Überblick RSI Advanced ist ein leistungsfähiger benutzerdefinierter Indikator für MetaTrader 5, der Ihre technische Analyse verbessern und zuverlässige Handelssignale liefern soll. Dieser Indikator integriert einen standardmäßigen Relative Strength Index (RSI) mit einem ausgeklügelten System von gleitenden Durchschnitten (MA) und Bollinger Bändern (BB), die direkt auf die RSI-Daten angewendet werden. Darüber hinau
FREE

EINSTELLUNGEN Vergewissern Sie sich, dass die Option Diagrammverschiebung im Diagramm aktiviert ist .
(Klicken Sie mit der rechten Maustaste in das Diagramm ---> Eigenschaften (Dialogfeld) ----> Wählen Sie Diagrammverschiebung)
Bitte bewerten und kommentieren Sie das Produkt für Upgrades und Support
Bei der Verwendung von Candlestick-Timern sollten Sie bedenken, dass das Timing von Candlestick-Mustern eine entscheidende Rolle in Ihrer Handelsstrategie spielen kann. So können beispielsweise ve
FREE

Phoenix ATR Volatility Meter (MT5)
Echtzeit-Volatilitätsüberwachungstool für MetaTrader 5. Verwendet die Average True Range (ATR), um die aktuelle Marktvolatilität in Ihrem Chart anzuzeigen.
Zweck
Die Marktvolatilität wirkt sich direkt auf die Platzierung von Stopps, die Positionsgröße, Slippage und die Wirksamkeit von Strategien aus. Trading ohne Kenntnis der Volatilität führt oft zu übermäßigen Risiken in schnellen Märkten oder zu verpassten Chancen in ruhigen Marktbedingungen.
Der Phoenix
FREE

Dies ist die Volume Avarage Weighted Price (VWAP) es ist ein Indikator, der zeigt, wo ist der Durchschnitt der aktuellen Volumina und die Ebenen, auf denen der Preis als Prämie, über dem zweiten oberen Band, oder Rabatt, unter dem zweiten unteren Band, es ist auch sehr nützlich, um die VWAP-Ebene als Ziel für Operationen, da es eine sehr liquide Ebene, so dass der Preis ist es angezogen zu ihm. fühlen Sie sich frei, ein Feedback entweder positiv oder negativ auf Ihre Erfahrungen mit diesem Indik
FREE

DTFX Algo Zones sind automatisch generierte Fibonacci-Retracements, die auf Marktstrukturverschiebungen basieren.
Diese Retracement-Levels sollen als Unterstützungs- und Widerstandslevels verwendet werden, an denen der Preis abprallen kann, um die Richtung zu bestätigen.
ANWENDUNG Abbildung 1 Da die Retracement-Levels nur aus identifizierten Marktstrukturverschiebungen generiert werden, sind die Retracements darauf beschränkt, nur aus Bereichen zu ziehen, die aufgrund des technischen Brea

Major Swing Fibonacci-Indikator - Professionelles Handelswerkzeug Was es tut Erkennt automatisch die wichtigsten Swing-Punkte und nicht das interne Rauschen Erzeugt Kauf-/Verkaufssignale an wichtigen Fibonacci-Niveaus Zeigt ein professionelles GUI-Panel mit Echtzeit-Analyse Markiert große Ausschläge mit visuellen Indikatoren Handelsstrategie KAUFEN bei 38,2%-61,8% Fibonacci-Unterstützung in Aufwärtstrends VERKAUFEN Die vergangene Performance ist kein Indikator für zukünftige Ergebnisse. Dieser I
FREE
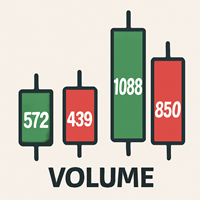
Volumendaten auf Kerzen Indikator für MetaTrader 5 Maximieren Sie Ihre Handelseinblicke mit dem Volume Data on Candles Indikator für MetaTrader 5. Dieses leistungsstarke Tool liefert Echtzeit-Volumendaten direkt zu jeder Kerze und ermöglicht es Ihnen, signifikante Verschiebungen in der Marktaktivität zu erkennen. Wenn das Volumen einer Kerze den Durchschnitt der letzten 50 Kerzen übersteigt, wird es deutlich hervorgehoben , damit Sie keine potenziellen Bewegungen mit hohem Volumen verpassen. Hau
FREE

Dieser MT5-Indikator bietet Echtzeit-Updates von klassischen Renko-Charts. Renko-Charts konzentrieren sich auf die Kursbewegung, filtern Störungen heraus und heben Trends hervor. Was sind Renko-Kerzen? Renko-Diagramme zeigen die Kursbewegung mit Hilfe von "Bausteinen" gleicher Größe an, ohne die Zeit zu berücksichtigen. Ein neuer Baustein wird nur gezeichnet, wenn sich der Kurs um einen bestimmten Betrag bewegt. Sie helfen bei der Visualisierung von Trends, indem sie zeitbasiertes Rauschen entf
FREE

Der Blahtech Moving Average Indikator ist eine Multitimeframe Version des Standard Moving Average Indikators. Er ist außerdem mit anpassbaren Alarmen, Periodenunterbrechungen und anderen Konfigurationsoptionen ausgestattet. Die gleitenden Durchschnitte der 50- und 200-Tage-Linie werden von Anlegern und Händlern häufig verfolgt, wobei Durchbrüche über und unter den MA-Linien als interessante Signale gelten. Links [ Installieren | Aktualisieren | Training | Alle Produkte ]
Funktions-Highlights Bi
FREE
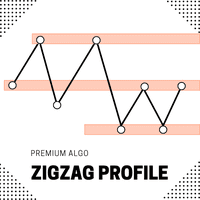
Wir stellen das ZigZag-Profil vor - ein leistungsfähiges Instrument zur Identifizierung von Pivot-Zonen mit hoher Wahrscheinlichkeit, in denen sich die Kursentwicklung häufig umkehrt. Dieser Indikator analysiert historische Kursdaten, um Schlüsselbereiche zu ermitteln, in denen der Kurs mehrfach umgeschlagen ist, und bietet Händlern so verwertbare Einblicke in potenzielle Unterstützungs- und Widerstandsebenen. Der ZigZal Profile-Indikator sucht kontinuierlich nach Zonen, in denen der Preis am hä
FREE

The TMA Centered Bands Indicator for MT5 draws bands on the chart and shows the overall price trend. It displays three bands - the lower and upper boundaries of the channel and the median. The bands are made up of moving averages, and each of them has an MA period. The name TMA comes from triangular moving averages, as the indicator draws triangular bands. The price will fluctuate between these ranges whenever the trend changes direction, thus creating entry and exit points. How to trade
FREE
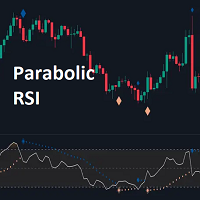
Der Parabolic RSI Indikator wendet den Parabolic SAR direkt auf den Relative Strength Index (RSI ) an. Diese Kombination hilft Händlern, Trendverschiebungen und potenzielle Umkehrpunkte innerhalb des RSI-Rahmens zu erkennen. Der Indikator liefert sowohl regelmäßige als auch starke Signale , je nachdem, ob der Parabolic SAR die RSI-Schwellenwerte über- oder unterschreitet.
KEY FEATURES
Parabolic SAR Applied to RSI - Verfolgt Momentum-Verschiebungen innerhalb des RSI-Indikators.
Dynamische S
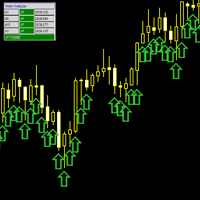
Der MultiFrameTrendAnalyzer ist ein vielseitiger MetaTrader 5 (MT5)-Indikator, der eine Multi-Timeframe-Trendanalyse unter Verwendung von Moving Average (MA) Crossovers ermöglicht. Dieser Indikator synchronisiert Trendsignale über mehrere Zeitrahmen (M1, M5, M15, M30, H1, H4, D1, W1, MN1) und zeigt sie mit intuitiven visuellen Hinweisen an, einschließlich einer farbigen Trendlinie, Signalpfeilen und einem anpassbaren Dashboard. Funktionen Multi-Timeframe-Analyse : Bewertet Trends über bis zu neu
FREE

Wir stellen den VFI (Volume Flow Indicator) vor - einen Handelsindikator, der die Beziehung zwischen Volumen und Preisbewegung analysiert, um wichtige Handelsmöglichkeiten zu identifizieren. Der Indikator zeigt die Stärke und Richtung des Volumenflusses an und liefert klare Signale über potenzielle Einstiegs- und Ausstiegspunkte. Signale werden auf der Grundlage von Nulllinienüberkreuzungen, Überkreuzungen zwischen der VFI-Linie und ihrem exponentiellen gleitenden Durchschnitt (EMA) und wenn der
FREE
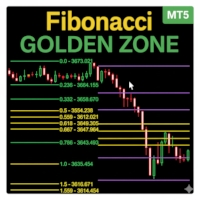
Der Fibonacci Sessions Indikator ist ein leistungsstarkes Trading-Tool, das für präzises Scalping und Intraday-Strategien entwickelt wurde. Er zeichnet automatisch die wichtigsten Fibonacci-Niveaus für die Sitzungen in New York, London und Asien ein und bietet Tradern einen klaren Überblick über die Kursdynamik während der wichtigsten Handelszeiten. Einzigartige „Goldene Zonen“ werden in jeder Sitzung hervorgehoben, in denen der Preis am häufigsten reagiert. Dies schafft hochzuverlässige Bere
FREE

Harmonic Pattern Suite Pro Einführung Harmonic Pattern Suite Pro ist ein Indikator, der harmonische Strukturen auf der Basis von X-A-B-C-D-Sequenzen identifiziert und im Chart anzeigt. Sein Ziel ist es, Musterformationen darzustellen, die geometrische und proportionale Kriterien erfüllen und eine klare visuelle Darstellung direkt auf dem Chart bieten. Der Indikator automatisiert den Erkennungsprozess, so dass keine manuelle Messung der Verhältnisse mehr erforderlich ist und der Benutzer die str
FREE

GEN Ichimoku Signal Entwickler: gedeegi Übersicht GEN Ichimoku Signal ist ein technischer Indikator für die MetaTrader 5 Plattform. Er kombiniert zwei verschiedene Trendanalysesysteme, Ichimoku Kinko Hyo und HalfTrend, in einem einzigen visuellen Werkzeug. Die Hauptfunktion des Indikators ist die Einfärbung der Candlesticks auf dem Chart, je nachdem, ob die Bedingungen dieser beiden Systeme übereinstimmen. Der Indikator bietet eine visuelle Darstellung der Marktbedingungen, indem er eine von dre
FREE

Capital Vault System ist eine professionelle Suite für die technische Analyse in MetaTrader 5, die entwickelt wurde, um die Marktstruktur zu identifizieren und Marktvolatilität adaptiv zu filtern. Im Gegensatz zu statischen Indikatoren integriert dieses System drei mathematische Modelle – Maximum Entropy Spectral Analysis (MESA) , Fraktale Dimension und Harmonische Geometrie – um zwischen direktionalen Trends und nicht-linearen Konsolidierungsphasen zu unterscheiden. Es enthält ein integriertes

Basic Theme Builder: Vereinfachen Sie Ihre Diagrammanpassung Verwandeln Sie Ihr Trading-Erlebnis mit dem Basic Theme Builder -Indikator, einem vielseitigen Werkzeug, das entwickelt wurde, um die Anpassung des Erscheinungsbildes Ihres Charts auf MetaTrader 5 zu vereinfachen. Dieser intuitive Indikator bietet ein benutzerfreundliches Panel, mit dem Sie mühelos zwischen verschiedenen Themen und Farbschemata wechseln können, um sowohl die visuelle Attraktivität als auch die Funktionalität Ihres Han
FREE

Der Chart-Overlay- Indikator zeigt die Kursbewegungen mehrerer Instrumente auf demselben Chart an, sodass Sie auswerten können, wie unterschiedlich die Währungspaare im Verhältnis zueinander schwanken. [ Installationsanleitung | Update-Anleitung | Fehlerbehebung | FAQ | Alle Produkte ]
Finden Sie leicht überkaufte oder überverkaufte Währungspaare Zeichnen Sie bis zu sechs Währungspaare auf ein und demselben Diagramm Zeigen Sie bei Bedarf invertierte Symbole an An Diagrammgröße, Zoom und Zeitr
FREE

Der ADX-Indikator wird verwendet, um den Trend und seine Stärke zu bestimmen. Die Richtung des Preises wird durch die Werte +DI und -DI angezeigt, und der ADX-Wert zeigt die Stärke des Trends. Wenn +DI über -DI liegt, befindet sich der Markt in einem Aufwärtstrend, wenn nicht, ist es ein Abwärtstrend. Wenn ADX unter 20 liegt, gibt es keine eindeutige Richtung. Sobald der Indikator dieses Niveau durchbricht, beginnt ein Trend mittlerer Stärke. Werte über 40 zeigen einen starken Trend an (einen A
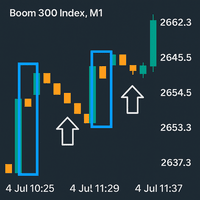
Boom Spike Mitigation Zone Pro
Ein professioneller Spike-Muster-Indikator, der für synthetische Trader entwickelt wurde, die Boom 500/300/1000/600/900 mit Präzision scalpen und swingen.
Dieser Indikator: Erkennt starke 3-Kerzen-Spike-Formationen (Spike → Pullback → Spike) Zeichnet automatisch eine saubere Box um das Muster Markiert den Einstiegskurs ab der mittleren Kerze Erweitert eine horizontale Abschwächungslinie, um perfekte Sniper-Einstiege zu ermöglichen Löscht und zeic
FREE
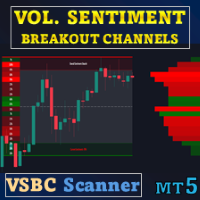
Sonderangebot : ALL TOOLS , nur $35 pro Stück! Neue Tools kosten $30 während der ersten Woche oder für die ersten 3 Käufe ! Trading Tools Channel on MQL5 : Treten Sie meinem MQL5-Kanal bei, um die neuesten Neuigkeiten von mir zu erhalten Volume Sentiment Breakout Channels ist ein Indikator, der Ausbruchsbereiche anhand des Volumensentiments innerhalb dynamischer Preiskanäle visualisiert. Anstatt einen Ausbruch nur als ein rein technisches Preisereignis zu betrachten, konzentriert

Der Indikator synchronisiert acht Arten von Markierungen auf mehreren Charts eines Handelsinstruments.
Dieser Indikator kann bequem in Verbindung mit "Multichart Dashboard" oder einem ähnlichen Assistenten verwendet werden, mit dem Sie gleichzeitig mit mehreren Charts arbeiten können.
"Multichart Dashboard" finden Sie unter dem Link auf meinem Youtube-Kanal.
Die Einstellungen:
Aktivieren die vertikale Liniensynchronisation
Aktivieren die horizontale Liniensynchronisation
Aktivieren die Trendlin
FREE

Betrachten Sie den Super Fractal Indicator als den Bill WIlliams Indicator auf Steroiden. Indikator-Fähigkeiten: 1. Anpassung der Kerze um das Fraktal-Hoch oder -Tief. 2. Passen Sie die Lookback-Periode an und stellen Sie nur eine bestimmte Anzahl von historischen Kerzen dar, um Ihr Trading-Desk nicht zu überfrachten. 3. Der Indikator verwendet Puffer, so dass Sie ihn von jedem EA aus aufrufen und verwenden können.
Anmerkung : Je höher die Kerzen um das Fraktal sind, desto stärker ist der Wende
FREE

Der Nadaraya-Watson Envelope ist ein indikatorbasierter, nicht-parametrischer Regressionsansatz, der Händlern hilft, Trends sowie Unterstützungs- und Widerstandsniveaus mit sanften, adaptiven Bändern zu erkennen. Im Gegensatz zu herkömmlichen gleitenden Durchschnitten oder auf Standardabweichungen basierenden Envelopes verwendet dieser Indikator die Nadaraya-Watson-Kernelregression , die sich dynamisch an Preisbewegungen anpasst, Verzögerungen reduziert und dennoch reaktionsschnell bleibt
FREE
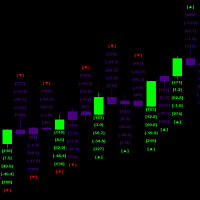
Dieser Indikator hilft, den Beginn signifikanter Marktbewegungen zu erkennen, indem er die Kerzenmuster und ihre relative Preisaktionsstärke analysiert.
Der Indikator führt jede Millisekunde mehrere gleichzeitige Berechnungen durch und führt auch eine dreifache historische Überprüfung durch, um zukünftige Wahrscheinlichkeiten zu berechnen. Die historische Verarbeitung muss abgeschlossen sein, bevor neue Candlesticks als ein Gesamtsatz aus der gesamten verfügbaren Historie ab dem Startdatum und
FREE
Der Round-Level-Indikator zeichnet automatisch psychologisch bedeutsame Kursniveaus direkt auf Ihrem Chart ein.
Diese runden Zahlen dienen oft als wichtige Unterstützungs- und Widerstandszonen in allen Märkten und Zeitrahmen.
Round Levels werden in meinem automatisierten EA verwendet: Opal Dieser Indikator funktioniert am besten, wenn er mit anderen Tools und Strategien kombiniert wird, z.B.: Preis-Aktions-Strategien
Runde Levels stimmen oft mit wichtigen Unterstützungs-/Widerstandszonen übere
FREE
Zeigt AUTOMATISCH die prozentualen TAGESÄNDERUNGSNIVEAUS als UNTERSTÜTZUNGS- und WIDERSTANDSLINIEN an — dies ist der 2MV Frequencies Full Indikator. Identifizieren Sie Unterstützungs- und Widerstandszonen schnell anhand von Prozentsätzen (z. B.: 0,50 %, 1 %, 1,50 %) – vollständig anpassbar, um Umkehrungen, Ausbrüche und Konsolidierungszonen mit Präzision und visueller Klarheit vorherzusehen, basierend auf der exklusiven Methode von Evandro Soares. Erkennen Sie schnell Unterstützungs

Der VR-Raster-Indikator ist entwickelt , um ein grafisches Raster mit benutzerdefinierten Einstellungen zu erstellen. Im Gegensatz zum Standardgitter wird VR Grid zum Erstellen von kreisförmigen Ebenen verwendet. Je nach Wahl des Benutzers kann der Schritt zwischen den Rundenstufen beliebig sein. Darüber hinaus behält VR Grid im Gegensatz zu anderen Indikatoren und Dienstprogrammen die Position des Rasters bei, selbst wenn sich der Zeitraum ändert oder das Terminal neu gestartet wird. Einstellun
FREE

Pip Value Calculator - Sofortige Risikobewertung in Ihrem Chart Dieses leistungsstarke und leichtgewichtige Dienstprogramm berechnet sofort den genauen Geldwert für jede Pip-Bewegung und zeigt ihn direkt auf Ihrem Chart an, so dass Sie das Risiko und den potenziellen Gewinn auf einen Blick beurteilen können. Das Herzstück des Indikators, die ausgeklügelte Berechnungs-Engine, läuft bei jedem Preis-Tick unbemerkt ab und stellt sicher, dass die angezeigten Informationen immer aktuell sind. Er erken
FREE

- Zeigt horizontale Linien für Vortageshoch (PDH) und Vortagestief (PDL) im Diagramm an. - Anpassbare Linienfarben über Eingabeparameter. - Versendet akustische Warnungen, Popup-Benachrichtigungen und mobile Push-Benachrichtigungen beim ersten Crossover von PDH oder PDL. - Die Warnungen werden nur einmal pro Crossover-Ereignis ausgelöst; sie werden nur dann erneut ausgelöst, wenn sich der Kurs entfernt und nach einem bestimmten Mindestintervall erneut kreuzt. - Aktualisiert die PDH/PDL-Ebenen au
FREE

AlgoMatrix EMA Ribbon Trend Pro (MT5)
Professioneller EMA Ribbon Trend Indikator für MetaTrader 5
Übersicht - Gebaut für Trader, die Trends respektieren
AlgoMatrix EMA Ribbon Trend Pro ist ein professioneller EMA Ribbon Trend-Indikator für MetaTrader 5, der für Trader entwickelt wurde, die eine saubere Trendbestätigung, disziplinierte Eingänge und nicht nachmalende Signale bevorzugen.
Dieser Indikator konzentriert sich auf ein einfaches Ziel: Ihnen dabei zu helfen, nur dann zu hand
Erfahren Sie, wie man einen Handelsroboter im MetaTrader AppStore, dem Shop für Applikationen für die MetaTrader Handelsplattform, kaufen kann.
Das Zahlungssystem der MQL5.community ermöglicht Zahlungen mit PayPal, Kreditkarten und den gängigen Zahlungssystemen. Wir empfehlen Ihnen eindringlich, Handelsroboter vor dem Kauf zu testen, um eine bessere Vorstellung von dem Produkt zu bekommen.
Sie verpassen Handelsmöglichkeiten:
- Freie Handelsapplikationen
- Über 8.000 Signale zum Kopieren
- Wirtschaftsnachrichten für die Lage an den Finanzmärkte
Registrierung
Einloggen
Wenn Sie kein Benutzerkonto haben, registrieren Sie sich
Erlauben Sie die Verwendung von Cookies, um sich auf der Website MQL5.com anzumelden.
Bitte aktivieren Sie die notwendige Einstellung in Ihrem Browser, da Sie sich sonst nicht einloggen können.