YouTubeにあるマーケットチュートリアルビデオをご覧ください
ロボットや指標を購入する
仮想ホスティングで
EAを実行
EAを実行
ロボットや指標を購入前にテストする
マーケットで収入を得る
販売のためにプロダクトをプレゼンテーションする方法
MetaTrader 5のためのテクニカル指標 - 18

RSI ABCDパターンファインダー:テクニカル戦略 1. インジケーターの仕組み 古典的RSI と ABCD調和パターン の自動検出を組み合わせたものです。 主要コンポーネント 標準RSI (調整可能な期間) 高値・安値マーカー (矢印) ABCDパターン (緑/赤の線) 過買(70)・過売(30)フィルター 2. MT5設定 period = 14 ; // RSI期間 size = 4 ; // 最大パターンサイズ OverBought = 70 ; // 過買水準 OverSold = 30 ; // 過売水準 Filter = USE_FILTER_ YES ; // 確認フィルター 3. 取引戦略 3.1. 買いエントリー(強気ABCD) 条件: RSIが以下を形成: 谷( A )→ 山( B )→ より高い谷( C ) D が過売域(30)より上だが C より下 確認:A-B-C-Dを結ぶ緑色の線 目標: TP1: B-Cの61.8% TP2: B-Cの100% ストップロス: D より下 3.2. 売りエントリー(弱気ABCD) 条件: RSIが以下を形成: 山( A
FREE

フェニックス・トレンド強度メーター (MT5)
MetaTrader 5 向け市場環境とトレンド強度分析ツール。ADX、RSI、方向性指数を単一パネルに統合し、市場状況をリアルタイムで分類します。
目的
多くのトレーダーが失敗するのは、エントリーポイントが悪いからではなく、間違った市場環境に誤った戦略を適用するためです。フェニックス・トレンド強度計は、市場がレンジ相場か、トレンド形成中か、強いトレンドか、あるいは消耗リスク領域に入りつつあるかをトレーダーが瞬時に判断するのを支援します。
本指標は、トレンド強度をADXで、方向性バイアスをDIで、モメンタムバランスをRSIで分析します。これらを視覚的なメーターに統合し、明確なテキストベースの相場状態分類(レンジ、慎重なロング/ショート、強いロング/ショート、リスク/延長)を表示します。パネルは新しいバーで更新され、オプションで相場状態変化や消耗アラートを含みます。
インストール
MQL5マーケットからダウンロードし、任意のチャートに添付してください。パネルは事前最適化されたデフォルト値で即座に表示されます。
要件
Meta
FREE

This indicator displays pivot points in the chart, including historical vales, and supports many calculation modes for Pivot Points and S/R levels. [ Installation Guide | Update Guide | Troubleshooting | FAQ | All Products ] It plots historical levels for backtesting purposes
It allows you to select the reference timeframe It implements different Pivot Point calculation modes It implements different SR calculation modes
It implements customizable colors and sizes
Calculation Modes The indicato
FREE

This indicator draw a line on high and low levels of X number of days. It is possible to have an alert (in the software and mobile app) for when the price breaks the high or low of the current day. Configurações: Days - past days to calculate (1 = actual day only).
Alert when reach levels - activate the alert for specific levels or both.
Push notification - enable the alert to the mobile MT5 app.
Appearance
High - high level color.
Low - low level color.
Size actual day - thickness
FREE

SETTINGS Make sure to select Chart shift option in the chart.
(Right click in the chart ---> Properties (dialog box) ----> Select Chart Shift)
Kindly rate and comment about the product for upgradation & Support
When using candlestick timers, keep in mind that the timing of candlestick patterns can play a crucial role in your trading strategy. For instance, different timeframes (such as 1-minute, 5-minute, hourly, ) can provide varying insights into price movements and trends. Make sure to i
FREE

It is the MQL5 version of zero lag MACD that was available for MT4 here: https://www.mql5.com/en/code/9993 Also there was a colored version of it here but it had some problems: https://www.mql5.com/en/code/8703 I fixed the MT4 version which has 95 lines of code. It took me 5 days to write the MT5 version.(reading the logs and testing multiple times and finding out the difference of MT5 and MT4!) My first MQL5 version of this indicator had 400 lines of code but I optimized my own code again and n
FREE
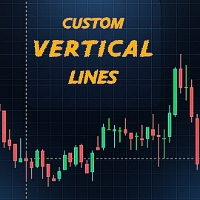
このインディケーターは、任意の時刻に自動的に縦線を描画し、必要に応じてその時刻の始値に基づいて水平線を追加します。トレーダーが市場セッション、戦略特有の時間、または日ごとのカスタムレベルなどの重要なイベントをマークするのに役立ちます。 特徴: 1日最大2本のカスタマイズ可能な縦線 を描画できます。 選択した時刻の始値から 水平線を追加 するオプション。 線の 色、スタイル、太さを完全にカスタマイズ 可能。 軽量で高速、チャートを遅くしません。 任意の シンボル や 時間足 で動作。 1本だけ表示したい場合 、2つ目の時刻入力を空白にしてください。 まったく表示したくない場合 、両方の時刻入力を空白にしてください。 使用方法: インディケーターをチャートに適用します。 入力設定で希望する時刻を設定します(例: 07:00、14:30)。 線のスタイル、色、太さを調整します。 どの時刻イベントが水平線を生成するかを選択できます。 少ない本数または表示なしにしたい場合は入力を空にしてください。 このツールは、取引セッション、戦略、または日常のルーチンのために 明確な視覚マーカー を必要とする
FREE

The TMA Centered Bands Indicator for MT5 draws bands on the chart and shows the overall price trend. It displays three bands - the lower and upper boundaries of the channel and the median. The bands are made up of moving averages, and each of them has an MA period. The name TMA comes from triangular moving averages, as the indicator draws triangular bands. The price will fluctuate between these ranges whenever the trend changes direction, thus creating entry and exit points. How to trade
FREE

エントリーの判断に迷うことにうんざりしていませんか?Sniper Entry Signalは、タイミングという特定の問題を解決するために設計されたプロフェッショナルなトレーディングシステムです。
遅延やリペイントが発生する一般的なインジケーターとは異なり、このツールは高度な「3時間枠コンセンサスエンジン」を採用しています。M1、M5、M15の時間枠を同時にスキャンします。3つの時間枠すべてがトレンドの方向と一致した場合にのみ、シグナルが生成されます。
その結果、市場のノイズを除去し、ダマシなブレイクアウトを回避し、高い確率で勢いのある取引にエントリーできるようになります。
Sniper Entry Signalを選ぶ理由
レーザーフォーカスされたエントリー:エントリーが早すぎたり遅すぎたりすることはもうありません。ダッシュボードが、市場が準備完了するタイミングを正確に示します。
️ 100%リペイントなし:矢印が表示され、ローソク足が閉じると、シグナルはロックされます。決して消えることはありません。
スマートリスク管理:ダッシュボードは、現在のボラティリテ

Are you tired of plotting Fibonacci retracements or extensions manually? This indicator displays Fibo retracements or extensions automatically, calculated from two different price points, without human intervention or manual object anchoring. [ Installation Guide | Update Guide | Troubleshooting | FAQ | All Products ] Easy to use Manual anchoring is not needed Perfect for price confluence studies The indicator evaluates if retracements or extensions are needed Once drawn, you can manually edit t
FREE

The Advanced Support and Resistance Indicator for MetaTrader 5 leverages sophisticated pivot point detection algorithms to autonomously identify and visualize critical price levels on the chart. Utilizing a configurable pivot period (default: 20 bars) and data source (High/Low or Open/Close), it intelligently scans historical price action within a user-defined loopback window (default: 290 bars) to pinpoint pivot highs and lows with strict validation criteria for enhanced precision. Pivots are d
FREE

Moving Average Alerts は、4 本の完全にカスタマイズ可能な移動平均線を搭載した、シンプルで効率的なインジケーターです。トレーダーは自身の戦略に応じて、期間、手法、設定を自由に選択できます。 各移動平均線には 2 つの独立したアラートがあり、それぞれ個別に有効または無効にできます: 価格が移動平均線の上でクローズしたときのアラート
価格が移動平均線の下でクローズしたときのアラート アラートはローソク足の確定時のみ作動し、価格形成中の重複や誤ったシグナルを防ぎます。 また、プッシュ通知機能を備えており、MetaTrader 5 Mobile に直接アラートを送信できるため、パソコンから離れていてもチャンスを逃しません。 移動平均線をトレンド、サポート・レジスタンス、またはエントリー確認の基準として使用するトレーダーに最適です。
FREE

フェニックス ATR ボラティリティメーター (MT5)
MetaTrader 5 向けリアルタイムボラティリティ監視ツール。平均真値範囲(ATR)を用いて、チャート上に現在の市場ボラティリティを表示します。
目的
市場ボラティリティは、ストップ注文の位置、ポジションサイズ、スリッページ、戦略の有効性に直接影響します。ボラティリティを認識せずに取引を行うと、急激な相場では過剰なリスクを負い、静かな相場では機会を逃すことにつながることがよくあります。
フェニックス ATR ボラティリティメーターは、現在のチャートデータを用いてATRを計算し、その値をチャート上に明確に表示します。メーターはリアルタイムで更新され、銘柄や時間枠の変更に自動的に適応するため、トレーダーは市場が穏やかか、活発か、あるいは非常にボラティリティが高いかを評価できます。
インストール
MQL5マーケットからダウンロードし、任意のチャートにアタッチしてください。メーターは即時表示され、設定は不要です。
動作環境
MetaTrader 5 ビルド3280以降。カスタムインジケーターです。ボラティリティ測定
FREE

MetaTrader 5 の WH Trading Sessions MT5 インジケーターを使用して、取引の精度を高めましょう。この強力なツールを使用すると、主要な市場セッションを簡単に視覚化して管理できます。 ベース オン: WH SMCインジケーターMT5
MT4 バージョン: WH トレーディングセッション MT4
主な特徴: インタラクティブ GUI パネル – アジア、ロンドン、ニューヨークの 取引セッションを簡単に選択して切り替えることができます。
カスタマイズ可能なアラートと設定 – 直感的な オプション タブ を使用して、インジケーターを戦略に合わせてカスタマイズします。
高速で応答性の高いインターフェース - 移動、最小化、最大化が可能なパネル でスムーズなエクスペリエンスをお楽しみください。
自動 GMT オフセット処理 - 手動調整は不要です。セッションは常に市場時間に合わせて調整されます。
トレーディングセッション で市場動向を先取りし、取引の決定を最適化しましょう
FREE

This indicator combines TRIX (Triple Exponential Moving Average) with a Moving Average, which can be simple, exponential, smoothed or weighted.
This combination is very useful to identify the main trend and when it is changing to a new direction.
The indicator also has signals on the chart that indicates the TRIX crossing with the Moving Average, as well as pop-up alerts and push (in the MT5 app).
Enjoy it!
FREE
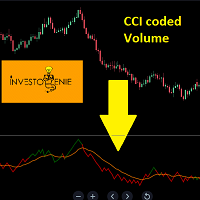
The Indicator is based on Commodity Channel Index (CCI) coded on Volume. The concept is to try and analyze the movement of Volume and Price in a certain direction
Concept:
If the Price of the indicator moves below the threshold price, it turns RED indicating the direction downwards is getting strong.
If the Price of the indicator moves above the threshold price, it turns GREEN indicating the direction upwards is getting strong.
The moving average acts as a great filter to decide entry/exit poi
FREE

TRUE BIAS Know Where The Market Wants To Go See market direction across 6 timeframes at once. A professional dashboard displaying real-time bias analysis (M1, M5, M15, H1, H4, D1) with confidence levels, actionable trading signals, and smart control point detection. What It Does: Shows market direction for each timeframe with confidence % - Green = Buy, Red = Sell, Gray = Wait Provides clear trading actions: STRONG BUY, BUY, SELL, STRONG SELL, LONG SWING, SHORT SWING Automatically detects key su

This is an optimized version of the Waddah Attar Explosion (WAE) indicator, designed to adapt to different asset classes.
Standard WAE indicators often use a fixed "DeadZone" calculation (usually set to 20). This fixed value may not be suitable for high-volatility assets like Bitcoin, Gold, or Indices (US30), potentially leading to incorrect filtering. This Auto-Adaptive version addresses that calculation issue. The indicator implements a dynamic formula based on ATR and SMMA to automatically ca
FREE

This indicator is designed to detect high probability reversal patterns: Double Tops/Bottoms with fake breakouts . This is the FREE version of the indicator: https://www.mql5.com/en/market/product/29957 The free version works only on EURUSD and GBPUSD! Double top and bottom patterns are chart patterns that occur when the trading instrument moves in a similar pattern to the letter "W" (double bottom) or "M" (double top). The patterns usually occur at the end of a trend and are used to signal tren
FREE

Using the Stochastic Oscillator with a Moving Average is a simple but very efficient strategy to predict a trend reversal or continuation.
The indicator automatically merges both indicators into one. It also gives you visual and sound alerts.
It is ready to be used with our programmable EA, Sandbox, which you can find below: Our programmable EA: https://www.mql5.com/en/market/product/76714 Enjoy the indicator!
This is a free indicator, but it took hours to develop. If you want to pay me a coff
FREE
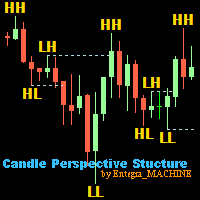
Candle Perspective Structure Indicator MT5 is a simple indicator that defines and displays the candlestick structure of the market. This indicator will suit both experienced traders and beginners who find it difficult to follow the structure visually.
If you want to see more high-quality products or order the development/conversion of your own products, visit my partners' website: 4xDev
Get 10% OFF on manual strategies automation services or indicator development/conversion services at 4xDev
FREE
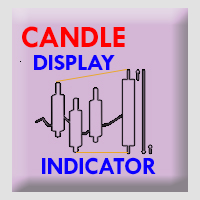
Timeframe Simulator Indicator This indicator redraws candlestick structures from a higher timeframe onto your current chart. It helps visualize higher-period price action without switching timeframes, making it easier to analyze trends and key levels while trading on lower timeframes. Main features: Customizable Candles – Adjust the appearance of higher timeframe candles (bull/bear colors, wick style, gaps, and history length). Higher Timeframe Lines – Optionally display dynamic high, low,
FREE

This tool was developed to help traders on candle by candle and replay training. In the indicator settings, the user can set the training start datetime. The indicator will autommatically hide all candles after this datetime. So the user can make studies before starting the training. Starting the training, the user can simulate your trades quickly and easily!
This is a product developed by Renato Fiche Junior and available to all MetaTrader 5 users!
Input Parameters
Training Start - training
FREE

Product Name: Auto Trend Pattern Pro [Subho - India] Short Description:
An advanced Price Action tool that automatically detects and draws Trend Channels, Wedges, and Triangles with a live Dashboard. Full Description: Auto Trend Pattern Pro is a sophisticated technical indicator designed for MetaTrader 5. It automates the complex task of drawing Trend Lines and Channels. By analyzing historical price action, the indicator identifies the most accurate "Best Fit" channels for both short-term
FREE

This auxiliary indicator displays time left before closing on the current timeframe with continuous update . It also shows the last trade price and variation from a previous day close in percentage and points. This indicator is pretty handy for daytraders and scalpers who want to precisely monitor closing and opening of candles.
Indicator parameters Show in shifted end - Default: False. Display time and values on screen. If True, Displays only time to close aside last candle. Distance from the
FREE
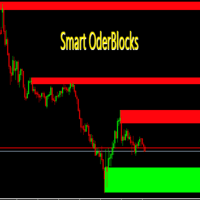
Smart OrderBlocks Indicator for MetaTrader 5 A Differentiated Vision and a Bit of Price Action! Smart OrderBlocks is an advanced indicator that reveals market structure from a unique perspective through intelligent supply and demand zone detection. Key Features OrderBlocks Detection Internal OrderBlocks : Capture micro-level market dynamics Swing OrderBlocks : Identify macro market momentum trends Advanced Volatility Intelligence Volatility detection using: Adaptive Average True Range (AT
FREE

Adaptive Moving Average (AMA) is a trend indicator using moving average and market noise filter. Indicator feature are blue and red points, showing the power of trend. Recommendations for trading: Auxiliary Indicator Detecting trend Detecting power of trend Detecting potential reversal points Main indicator Shows entry points for swing trading Serves as dynamic support and resistance Recommendations for use: Any instrument Any timeframe Input parameters: Period - AMA period Fast Period - fast MA
FREE

YOU CAN NOW DOWNLOAD FREE VERSIONS OF OUR PAID INDICATORS . IT'S OUR WAY OF GIVING BACK TO THE COMMUNITY ! >>> GO HERE TO DOWNLOAD
The Volatility Ratio was developed by Jack D. Schwager to identify trading range and signal potential breakouts. The volatility ratio is defined as the current day's true range divided by the true range over a certain number of days N (i.e. N periods). The following formula is used to calculate the volatility ratio: Volatility Ratio (VR) = Today's True Range
FREE

Previous Candle Levels MT5 shows the previous candle levels, it shows the previous candle Open High Low Close levels (OHLC Levels) in different time frame. It's designed to help the trader to analyse the market and pay attention to the previous candle levels in different time frame. We all know that the OHLC Levels in Monthly, Weekly and Daily are really strong and must of the time, the price strongly reacts at those levels. In the technical analysis, the user can use them as a support and res
FREE

Accurate Buy Sell System is a clean and reliable swing-based indicator designed to identify trend reversals and entry zones with high precision. The algorithm follows the original “Accurate Swing Trading System” concept from TradingView (by ceyhun) and has been fully re-engineered for MetaTrader 5. 1:1 match with TradingView behavior
Works on all symbols and timeframes
Clean non-repainting signals when used after candle close
Visual BUY/SELL arrows + colored dynamic trendline
Popup al
FREE

The outside bar indicator shows a range of inside bars and the breakout up and down from the range. The breakout is always displayed at the start of a new range and is extended until another breakout. The calculation always takes place at the start of a new candle. So it is displayed accordingly in all time frames. In inside bar ( insidebar ) trading you can see the top and bottom of a range.
In outside bar ( outsidebar ) trading, the breakout from a range and thus the trend following.
The col
FREE

金融市場で取引しているなら、スプレッドの重要性はよく知っているはずです。売値(アスク)と買値(ビッド)の差であるスプレッドは、利益に大きく影響します。 Spread Size は、現在のスプレッドをチャート上に直接表示する、シンプルで非常に便利なインジケーターです。手動でデータを監視する必要はもうありません。すべてが目の前に表示されます! なぜ必要か?
スプレッドは単なる数字ではありません。実際のお金です。スプレッドが低いと、取引の開始と終了のコストが安くなります。ニュース時や流動性が低い時の高いスプレッドは、利益の一部を「食い潰す」可能性があり、利益が出る取引を損失に変えることさえあります。Spread Sizeは、こうした瞬間をタイムリーに察知するのに役立ちます。 どのように機能する?
インジケーターはスプレッドをテキストでチャート上に表示します。特に便利なのは、状況に応じて色が変わることです: 緑 — スプレッドが低い。安心して取引できる。
赤 — スプレッドが高い。待つか条件を再確認した方が良い。
色や作動閾値は自由に設定できます。 その他の利点:
時間の節約 — ウィンドウを
FREE

Time Candle with Sound Alert
This indicator will be display the time left candle Features : 1. Multi Time Frames, Multi Pairs 2. Time Left 2. Position dynamic with Bid Price or Edge of Chart Screen 3. Font Size and Color 4. Display Current Spread, Maximum Spread and Minimum Spread
Note: Maximum and Minimum Spread will be reset when you change TF Tested On MT5 Version 5 Build 5200
If you want the source code, just PM me
FREE

BarTimer v1.0 | Visualización Dinámica de Tiempo para MT5 BarTimer v1.0 es un indicador de alta precisión diseñado para traders que buscan gestionar el tiempo de cierre de sus velas sin saturar su espacio de trabajo. A diferencia de los contadores numéricos tradicionales, utiliza una barra de progreso visual que permite interpretar el ciclo del mercado de un solo vistazo. BarTimer v1.0 "La gestión del tiempo es tan crítica como la gestión del riesgo. BarTimer transforma un dato abstracto en una
FREE

VOLUMIZED ORDER BLOCKS [Riz] - MT5 Indicator Smart Money Order Block Detection with Volume Analysis
Volumized Order Blocks is an advanced Smart Money Concepts (SMC) indicator that automatically detects institutional order blocks with integrated volume analysis. It identifies high-probability supply and demand zones where banks and institutions
FREE

Candle Number Indicator for MetaTrader 5 The Candle Number Indicator displays a numeric label on each candlestick, starting from the most recent bar. This tool assists traders in visually tracking candle progression, which may support strategies based on time, structure, or pattern identification.
Features: Numbers each candle from the current bar backward Allows custom color, horizontal or vertical text orientation, and label offset Option to limit display to recent candles (e.g., last 10 bar
FREE
This indicator provides a clear, at-a-glance dashboard for monitoring both the Relative Strength Index (RSI) and Stochastic Oscillator on any instrument or timeframe.
Whenever both RSI and Stochastic %K simultaneously exceed their respective overbought or oversold levels, the indicator displays an arrow signal in the indicator window.
These signals highlight strong momentum and can help traders quickly identify high-probability reversal zones. As with all my free tools, the arrow symbol can be e
FREE

DTFX Algo Zones are auto-generated Fibonacci Retracements based on market structure shifts.
These retracement levels are intended to be used as support and resistance levels to look for price to bounce off of to confirm direction.
USAGE Figure 1 Due to the retracement levels only being generated from identified market structure shifts, the retracements are confined to only draw from areas considered more important due to the technical Break of Structure (BOS) or Change of Character (CHo

Gann Hilo — トレンドにおける精度と明確さ YouTubeチャンネル:@BotPulseTrading GannHilo は、市場のトレンド変化を 正確かつ視覚的に 識別するために設計されたテクニカル指標です。価格構造と ガン理論 を組み合わせ、このシステムは 方向とサポートのスマートガイド となる動的なラインを描きます。 ミニマルなデザインと最適化されたアルゴリズムにより、 クリーンで効果的 な分析を実現し、ノイズや遅延なく勢いの変化を明確に示します。デイトレーダーにもスイングトレーダーにも最適な GannHilo は、次の点で役立ちます: 視覚的な明確さでエントリーを確認 主要トレンドに沿って取引を維持 誤った転換や過剰取引を回避 価格アクションを強力でわかりやすい視覚シグナルに変換。
GannHilo — シンプルさと精度の融合。 Darwinex Zero 割引 -25%:DWZ2328770MGM
FREE

説明
Spread Historyは、別ウィンドウでローソク足ごとにスプレッドの履歴を表示し、同時にスプレッドの移動平均を表示するシンプルながら必須のインジケーターです。リアルタイムラインとメインチャートへのオーバーレイテキストにより、マーケットの各局面でブローカーが適用するスプレッドを手軽に監視できます。 目的 各ローソク足ごとにブローカー提供の実際のスプレッドを表示 設定可能な期間でスプレッドの移動平均を計算・表示 メインチャート上で現在のスプレッド値と移動平均値をオーバーレイ表示 スプレッドが高い時間帯(例:取引開始/終了、経済指標発表前後)を特定 不利な市場環境でのトレードを回避 主な機能 カスタマイズ可能なカラーのスプレッド履歴ライン表示 N本のローソク足を対象とした単純移動平均(SMA)計算 メインチャート上へのスプレッド値ラベル表示 移動平均期間、ライン色、テキスト色などのパラメーター設定 ラグなしのリアルタイム更新 対象ユーザー スプレッドの高騰を避けたいスキャルパーおよびデイトレーダー 複数のブローカーやデモ/リアル口座の比較を行うトレーダー 安定したスプレッドを
FREE
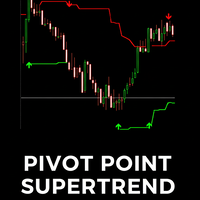
The Pivot Point Supertrend indicator is a technical analysis tool designed for the MetaTrader 5 (MT5) platform. It combines two popular analytical methods: Pivot Points: Uses significant historical price highs and lows to identify potential support and resistance zones. These points are objective and stable. Supertrend: A well-known trend-following indicator that helps identify the current market trend and provides dynamic stop-loss levels. Indicator's Goal: By using the stability of Pivot Point
FREE
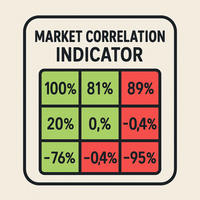
概要説明
このインジケーターは、複数の金融商品間のピアソン相関係数をリアルタイムで計算します。通貨ペア、株価指数、株式、商品などの市場間における関係の強さと方向を示すダイナミックな相関マトリックスを表示します。 主要パラメータ SymbolsList : 比較する銘柄のリスト(カンマ区切り) BarsToAnalyze : 計算に使用する過去バーの数 TimeFrame : 相関分析に使用する時間足 相関の解釈 +1.00 に近い値 : 強い正の相関を示す -1.00 に近い値 : 強い負の相関を示す 0.00 に近い値 : 弱い相関または無相関を示す トレードの利点 保有ポジション間の相関を監視し、過度なリスクエクスポージャーを回避 ポートフォリオにおける分散投資の機会を特定 ヘッジングやスプレッドトレード戦略をサポート インターマーケット分析によるエントリーシグナルの確認 重要な注意事項
このインジケーターは、取引ターミナルで利用可能なすべての銘柄に対応しており、日中足、日足、長期足で動作します。カラーコードにより、強い相関、弱い相関、負の相関をすばやく識別できます。 キーワ
FREE
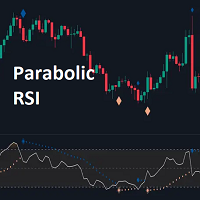
The Parabolic RSI indicator applies the Parabolic SAR directly to the Relative Strength Index (RSI) . This combination helps traders identify trend shifts and potential reversal points within the RSI framework. The indicator provides both regular and strong signals based on whether the Parabolic SAR crosses above or below key RSI thresholds.
KEY FEATURES
Parabolic SAR Applied to RSI – Tracks momentum shifts within the RSI indicator.
Dynamic SAR Dots – Plots SAR levels
Stop guessing where the market will turn. Our advanced High/Low Indicator for MT5 is the ultimate tool for mastering price action and identifying key market structure. It automatically scans the chart to identify and clearly plot all critical swing highs and lows in real-time, helping you see the true story behind the candles. These crucial, non-repainting levels form the backbone of any successful trading strategy. Use them to instantly visualize the market's framework, allowing you to pinpoint
FREE

Break Even Line by MMD
The Break Even line is a useful indicator for people using strategies that allow simultaneous trades in both directions, such as the MMD methodology. This indicator is useful when playing statistical models and averaging positions in accumulation and distribution zones. The indicator draws levels by summing positions in three groups: positions included in BUY, positions included in SELL and all positions included.
Functionality description:
Show BUY BELine - shows or
FREE

Hi-Lo is an indicator whose purpose is to more precisely assist the trends of a given asset - thus indicating the possible best time to buy or sell.
What is Hi-lo?
Hi-Lo is a term derived from English, where Hi is linked to the word High and Lo to the word Low. It is a trend indicator used to assess asset trading in the financial market.
Therefore, its use is given to identify whether a particular asset is showing an upward or downward trend in value. In this way, Hi-Lo Activator can be tran
FREE

The "YK-LOT-SIZE" is a custom indicator for MetaTrader 5 (MT5) that displays the total lot sizes and profits for both buy and sell positions on the current chart. Key features of the indicator: It calculates the total lot sizes for all open buy and sell positions of the current symbol. It calculates the total profits (including commissions and swaps) for all open buy and sell positions. The indicator displays the information on the chart using two lines of text: "BUY Lots: [total buy lots] | BUY
FREE

CurvedSmoothChannel_Enhanced - 強化された価格チャネルインジケーター
**CurvedSmoothChannel_Enhanced** は、MetaTrader 5 向けに設計された、強力で視覚的に魅力的な価格チャネルインジケーターです。トレンド、潜在的な反転、主要な価格レベルを正確に特定するのに役立ちます。この強化版は、ハル移動平均(HMA)とジョン・エーラーズ氏のスーパースムーズフィルターの機能を組み合わせ、複数の時間枠にわたる市場状況に合わせて調整する、動的で適応性の高いチャネルを構築します。 #### 主な機能: - **スムーズで適応性の高いミドルライン:** このインジケーターの中核となるのは、HMA に基づくスーパースムーズラインです。歪みを最小限に抑え、価格トレンドに忠実に追従します。 - **多層チャネル構造:** 3種類のチャネルラインを表示します。 - **外側のライン(タイト、黄色):** メインチャネルの境界を表し、トレンドの方向とブレイクアウトの可能性を判断するのに役立ちます。 - **内側の線(ややタイト、赤と緑):*
FREE

Capital Vault System is a professional technical analysis suite for MetaTrader 5 engineered to identify market structure and adaptively filter market volatility. Unlike static indicators, this system integrates three mathematical models— Maximum Entropy Spectral Analysis (MESA) , Fractal Dimension , and Harmonic Geometry —to distinguish between directional trends and non-linear consolidation ranges. It includes an embedded Risk Management Dashboard designed to assist traders in real-time positio

ADX インジケーターは、トレンドとその強さを判断するために使用されます。価格の方向は +DI と -DI の値で示され、ADX 値はトレンドの強さを示します。+DI が -DI より上であれば、市場は上昇傾向にあり、反対であれば下降傾向にあります。ADX が 20 より下であれば、明確な方向性はありません。インジケーターがこのレベルを突破するとすぐに、中程度の強さのトレンドが始まります。40 を超える値は、強いトレンド (下降トレンドまたは上昇トレンド) を示します。
平均方向性指数 (ADX) インジケーターの複数通貨および複数時間枠の変更。パラメータで任意の通貨と時間枠を指定できます。また、インジケーターは、トレンドの強さのレベルが交差したとき、および +DI と -DI のラインが交差したときに通知を送信できます。ピリオドの付いたセルをクリックすると、このシンボルと期間が開きます。これが MTF スキャナーです。
通貨強度メーター (CSM) と同様に、ダッシュボードは、指定された通貨を含むペア、またはその通貨を基本通貨とするペアを自動的に選択できます。インジケーターは、

Introduction
The PF Maximizer is a game-changing non-repainting technical tool engineered to help traders distinguish genuine trend signals from erratic market fluctuations. By employing sophisticated algorithms and cutting-edge data analysis, this indicator efficiently filters out unwanted noise, empowering traders to identify the precise starting and ending points of substantial market moves.
Signal
Potential buy signal is generated when moving average is going up and the blue line cross a
FREE

Introducing VFI (Volume Flow Indicator) – a trading indicator that analyzes the relationship between volume and price movement to identify key trading opportunities. The indicator displays the strength and direction of volume flow, providing clear signals about potential entry and exit points. Signals are formed based on zero line crossovers, crossovers between the VFI line and its exponential moving average (EMA), and when the indicator exits overbought and oversold zones.
Attention! This stra
FREE

The "Rejection Block" MetaTrader 5 Indicator offers traders a comprehensive tool for identifying and visualizing rejection candlestick patterns, commonly known as rejection blocks. These patterns are pivotal in discerning potential market reversals or continuations, making them invaluable for traders seeking to enhance their analysis. Key Features: Rejection Block Detection: The indicator diligently scans price data, pinpointing instances of rejection candlestick patterns. These patterns typical
FREE

親愛なる友人、ご清聴ありがとうございました。 異なる通貨ペアの動きが相互に関連していることを観察したい場合は、インジケーター Visual Correlation に注目してください。 異なる通貨ペアの動きは相互に関連しています。 Visual Correlation インジケーターを使用すると、スケールを維持しながら 1 つのチャート上にさまざまな金融商品を表示できます。 正の相関、負の相関、または相関なしを定義できます。
親愛なる友人、あなたは、いくつかの楽器が他の楽器よりも先に動くことをご存知でしょう。 このような瞬間は、グラフを重ね合わせることで判断できます。
親愛なる友人へ、チャート上に商品を表示するには、Symbol フィールドに商品名を入力する必要があります。
Version for MT4 https://www.mql5.com/ja/market/product/33063
FREE

Pipsometer is an elegant, real-time panel indicator for MT5 that instantly shows you both your cumulative money and pip gain/loss and total trades executed on the current chart. It dynamically changes its display color—green for net profit and red for net loss—so you can gauge performance at a glance without opening reports or scrolling through trade history.
FREE

The indicator synchronizes eight types of markings on several charts of one trading instrument.
This indicator is convenient to use in conjunction with "Multichart Dashboard" or other similar assistant that allows you to work with several charts at the same time.
"Multichart Dashboard" can be found under the link on my youtube channel.
Settings:
enable vertical line synchronization
enable horizontal line synchronization
enable Trend Line synchronization
enabling Fibonacci Retracement synchron
FREE

The XR Gartley Pattern MT5 is an indicator which displays and alerts Gartley pattern detected on the candlestick chart. It also displays potential trade with calculated Take Profit and Stop Loss. After purchasing XR Gartley Pattern Indicator, you can immediately download this indicator from the MT4-MT5 Market and start using it because all features are set to default, is not necessary to change any parameter. In addition, we have created a private group for customers who have purchased one of
FREE
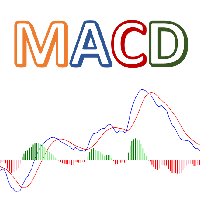
Colorful MACD is MT5 version of TradingView default MACD. This indicator has 4 different colors for MACD histogram, so it's so easy to detect fluctuations in histogram. Features: Colorful Histogram Bars Show/Hide Signal Line Show/Hide MACD Line Flexible price control Please call me if you need more input parameters or modified version of this indicator.
FREE

Highly configurable Trader Dynamic Index (TDI) indicator.
Features: Highly customizable alert functions (at levels, crosses, direction changes via email, push, sound, popup) Multi timeframe ability (higher and lower timeframes also) Color customization (at levels, crosses, direction changes) Linear interpolation and histogram mode options Works on strategy tester in multi timeframe mode (at weekend without ticks also) Adjustable Levels Parameters:
TDI Timeframe: You can set the lower/higher ti
FREE
The Linear Regression Candles indicator is a powerful tool that enhances traditional candlestick analysis by incorporating linear regression techniques. It helps traders visualize market trends more clearly by smoothing price movements and reducing noise. Unlike standard candles, Linear Regression Candles are dynamically calculated based on statistical regression, providing a clearer picture of the prevailing market direction.
Key Features: • Trend Identification – Highlights the overall mar
FREE
Reverse RSI Signals Indicator
The Reverse RSI Signals indicator is a versatile technical analysis tool designed for MetaTrader 5 (MT5). It transforms traditional RSI calculations into dynamic price-based bands, integrates Supertrend for trend identification, and includes divergence detection for potential reversal signals. This overlay indicator provides visual and alert-based insights to help traders spot overbought/oversold conditions, trend shifts, and momentum divergences directly on the p
FREE
The Moving Average Ribbon is a technical indicator that overlays a series of moving averages (MAs) on a price chart to visualize trend direction, strength, and potential reversals or reentries. It supports both Exponential Moving Averages (EMA) and Simple Moving Averages (SMA), configurable via user input.
Key Features:
Ribbon Composition: Displays 18 moving averages with periods ranging from 5 to 90 in increments of 5 (e.g., MA5, MA10, ..., MA90), plus an internal MA100 for reference. The MA5
FREE
日中のパーセンテージ変動レベルを自動的にサポートおよびレジスタンスとして表示します — これは 2MV Frequencies Full インジケーターです。 Evandro Soares の独自手法に基づき、 サポートとレジスタンスゾーン を パーセンテージレベル (例: 0.50%、1%、1.50%) によってすばやく特定できます。これらは完全にカスタマイズ可能で、 反転、ブレイクアウト、レンジゾーン を高い精度と視覚的な明確さで予測します。 サポートとレジスタンスゾーン をすばやく特定。
市場が反応する前に 反転やブレイクアウト を予測。
複数のインジケーター を同じチャートに制限なく追加可能。
パーセンテージレベル を戦略に合わせて調整可能。 MetaTrader 5 に対応しており、 すべてのアカウントタイプ 、 ストラテジーテスター 、および Forex 、 株式 、 指数 、 B3 - ブラジル証券取引所 市場で完全に動作します。 ️ 使用のヒント: 無料デモ版 をダウンロードして、取引している 銘柄 でインジ

For traders, monitoring price movements is a constant activity, because each price movement determines the action that must be taken next.
This simple indicator will helps traders to display prices more clearly in a larger size.
Users can set the font size and choose the color that will be displayed on the chart. There are three color options that can be selected to be displayed on the chart.
FREE

Check out my TRADE PLANNER MT5 – strongly recommended to anticipate account scenarios before risking any money. This is the moving average convergence divergence (MACD) indicator based on Heikin Ashi calculations. Here you find multi-colored histogram which corresponds to bull (green) / bear(red) trend. Dark and light colors describes weakness/strenght of price trend in time. Also you can switch calculations between normal and Heikin Ashi price type.
Note: Buffers numbers for iCustom: 0-MACD,
FREE

フェニックスニュースカウントダウンカレンダー(MT5)
MetaTrader 5向けリアルタイム経済ニュースカウントダウンパネル。高影響度イベントを正確なカウントダウンタイマー付きで表示し、ボラティリティ急騰時のリスク管理を支援します。
目的
経済ニュース発表は予期せぬボラティリティ、スリッページ、ドローダウンを引き起こします。高影響度イベントを盲目的に取引すると、テクニカル分析のセットアップやリスク管理が瞬時に無効化されるリスクがあります。
フェニックス ニュース カウントダウン カレンダーは予定された経済イベントを取得し、ブローカーサーバー時間と同期します。パネルはリアルタイムで更新されるカウントダウンタイマー付きで今後のニュースイベントを表示し、ボラティリティが襲う前にトレーダーが準備、一時停止、またはポジションを決済できるようにします。
インストール
MQL5マーケットからダウンロードし、任意のチャートにアタッチしてください。カレンダーパネルは即時表示され、設定は不要です。
動作環境
MetaTrader 5 ビルド3280以降。チャート上で実行する必要があるエ
FREE

Advanced Dynamic RSI The **Advanced Dynamic RSI** indicator builds on the classic Relative Strength Index (RSI) developed by J. Welles Wilder. It incorporates volatility-adaptive overbought and oversold levels using moving averages and standard deviation calculations. This adaptation helps the levels adjust to current market conditions, offering a more responsive oscillator compared to fixed thresholds. The indicator is suitable for various instruments and timeframes, supporting analysis in diff
FREE

AlgoMatrix EMA Ribbon Trend Pro (MT5)
Professional EMA Ribbon Trend Indicator for MetaTrader 5
Overview – Built for Traders Who Respect Trends
AlgoMatrix EMA Ribbon Trend Pro is a professional-grade EMA ribbon trend indicator for MetaTrader 5, designed for traders who prefer clean trend confirmation, disciplined entries, and non-repainting signals.
This indicator focuses on one simple goal: helping you trade only when the market is actually trending, while avoiding sideways and cho

This indicator calculates fibonacci levels via moving averages trend and draw these lines. You can change fast and slow Moving Averages settings for customization. Inputs:
Fast MA Time Period : 64 Fast MA Shift: 0 Fast MA Method: Smoothed Fast MA Apply To: Median Price Slow MA Time Period: 32 Slow MA Shift: 0 Slow MA Method: Smoothed Slow MA Apply To: Median Price ZigZag: False ZigZag Color: Red ZigZag Type: DashDot ZigZag Width: VeryThin Fibo Settings TrendFibonacci: True FiboTrendColor: Black
FREE

This indicator calculates gann support and resistance prices with use gann pyramid formulation and draw them on the chart. And If you want, Indicator can alert you when the current price arrive these pivot levels. Alert Options: Send Mobil Message, Send E-mail, Show Message and Sound Alert Levels: S1, S2, S3, S4, S5, R1, R2, R3, R4, R5 Inputs: GannInputPrice: Input price for gann pyramid formulation. GannInputDigit: How many digit do you want to use for calculation formula. (The number and the
FREE
MetaTraderマーケットはトレーダーのための自動売買ロボットやテクニカル指標を備えており、 ターミナルから直接利用することができます。
MQL5.community支払いシステムはMetaTraderサービス上のトランザクションのためにMQL5.comサイトに登録したすべてのユーザーに利用可能です。WebMoney、PayPal または銀行カードを使っての入金や出金が可能です。
取引の機会を逃しています。
- 無料取引アプリ
- 8千を超えるシグナルをコピー
- 金融ニュースで金融マーケットを探索
新規登録
ログイン