Indicadores técnicos para MetaTrader 5 - 18

Las señales de entrada de francotirador basadas en volumen y RSI para sintéticos Boom y Crash cuentan con sólidos sistemas de alerta de entrada. Para señales de filtro más avanzadas, considere el Harmonic Hybrid Pro. Cuando se negocian picos, se colocan estratégicamente tres órdenes para gestionar el riesgo, con la tercera orden colocada cerca de la mayor probabilidad de un pico. Las señales dejan de ser válidas quince minutos después de la última orden, y cualquier pérdida debe cerrarse rápidam
FREE

- Muestra líneas horizontales para el máximo del día anterior (PDH) y el mínimo del día anterior (PDL) en el gráfico. - Colores de línea personalizables mediante parámetros de entrada. - Envía alertas sonoras, notificaciones emergentes y notificaciones push para móviles al producirse el cruce inicial de PDH o PDL. - Las alertas se activan sólo una vez por evento de cruce; se vuelven a activar sólo si el precio se aleja y vuelve a cruzar después de un intervalo mínimo especificado. - Actualiza au
FREE

Consulte regularmente la pestaña "Novedades" para obtener una lista completa y actualizada de todas las mejoras + parámetros. Indicador GRATUITO para mi utilidad de trading Take a Break . Este indicador le permite gestionar múltiples EAs con una sola instancia de Take a Break EA. Simplemente especifique el Grupo de Gráficos correspondiente en los ajustes del indicador(es) y del EA Take a Break y listo.
Ejemplos de configuración (Indicador + EA)
Como prerrequisito, añada la URL https://trading.
FREE

Versión MT5 : Pre Nota : El indicador utiliza el valor del precio Open para los cálculos.
Este indicador representa un oscilador de impulso genuino de acuerdo con la verdadera definición de "Momentum", y como se realiza por las técnicas de filtros digitales. Los artículos académicos sobre el tema del desarrollador actual se pueden encontrar aquí y aquí , pero en esta descripción tomaremos prestado sólo el mínimo de marco conceptual y matemático necesario. En el proceso, exponemos algunos mitos
FREE

Configuración gráfica y señales de compra y venta basadas en la estrategia de swing, posición y day trade de Stormer (Alexandre Wolwacz, trader brasileño ), descrita en su canal de youtube ( https://www.youtube.com/watch?v= 0QZ_NjWkwl0).
Las indicaciones de compra y venta se basan en 2 patrones de velas (Inside Bar [Amarillo] y Reversal Closing Price [Azul y Rojo] ), 3 Medias Móviles y 1 Estocástico .
Indicadores: Inside Bar - Patrón de velas que indica la continuidad de la tendencia o un cam
FREE

Velas sin Mecha es un potente indicador de la acción del precio que identifica las velas sin mecha superior o inferior (también conocidas como velas Marubozu ) y traza automáticamente líneas horizontales de compensación desde su precio de apertura con una etiqueta de "Compensación ". Estas velas sin mecha representan un fuerte impulso y a menudo son utilizadas por los operadores profesionales como zonas clave de soporte/resistencia . El indicador le ayuda a visualizar posibles zonas de reversión
FREE

El indicador muestra gráficos minimizados de cualquier símbolo de cualquier período de tiempo. El número máximo de gráficos mostrados es 28. Los gráficos se pueden ubicar tanto en la ventana principal como en la inferior. Dos modos de visualización: velas y barras. La cantidad de datos mostrados (barras y velas) y los tamaños de los gráficos son ajustables. Para trabajar con un mini chat, primero debe colocar los indicadores deseados en un gráfico regular, luego guardarlo como una plantilla y ap
FREE

Heiken Ashi Dynamic es un indicador para MetaTrader 5 que muestra velas Heiken Ashi directamente en tu gráfico. Puedes elegir entre el modo clásico o un modo suavizado, que hace que los cambios de color sean más claros y fáciles de seguir. Los colores son simples: verde para movimientos al alza y rojo para movimientos a la baja. El modo Clásico reacciona rápido y ayuda a detectar giros con más antelación. El modo Suavizado hace que las tendencias largas se vean más limpias y continuas, ajustand
FREE
DRX SPREAD MONITOR es una utilidad profesional diseñada para visualizar y analizar los spreads del bróker en tiempo real. Ayuda a los traders a identificar costes ocultos causados por la ampliación del spread durante noticias, rollovers o sesiones de baja liquidez. Esta herramienta es esencial para Scalpers y traders de Oro que necesitan asegurar la calidad de ejecución y evitar operar cuando los costes son estadísticamente demasiado altos. Características Clave Histograma en Tiempo Real: Muestr
FREE

IQ FX Gann Levels es un indicador de precisión basado en los métodos de raíz cuadrada de W.D. Gann . Traza niveles de soporte y resistencia en tiempo real y sin repintado para ayudar a los operadores a detectar con confianza oportunidades intradía y de scalping con gran precisión. William Delbert Gann (W.D. Gann) fue un excepcional analista de mercado, cuya técnica de negociación se basaba en una compleja mezcla de matemáticas, geometría, astrología y matemáticas antiguas que demostró ser extrem

Descripción:
Oscilador de velas tipo Heikin-Ashi. Se puede utilizar de la misma forma que el RSI o el Estocástico.
Por ejemplo: Cruce cero. Por encima de la línea cero es alcista, por debajo de la línea cero es bajista.
Sobrecompra o sobreventa. La línea 100 es el nivel extremo comprado, la línea -100 es el nivel extremo vendido.
Divergencias.
Marco temporal: Cualquier marco temporal.
Instrumento: Cualquier instrumento.
FREE

** Todos los símbolos x Todos los plazos escanean con sólo pulsar el botón del escáner ** Descuento: El precio es de $ 50, pero ahora es sólo $ 39, oferta por tiempo limitado está activo.
*** Ponte en contacto conmigo para enviarte instrucciones y añadirte en "Trend Reversal group" para compartir o ver experiencias con otros usuarios. Introducción: Las líneas de tendencia son el análisis técnico más famoso en el trading . Las líneas de tendencia se forman continuamente en los gráficos de los me

El indicador sincroniza ocho tipos de marcas en varios gráficos de un instrumento de negociación.
Este indicador es conveniente utilizarlo junto con "Multichart Dashboard " u otro asistente similar que le permita trabajar con varios gráficos al mismo tiempo.
"Multichart Dashboard" se puede encontrar en el enlace de mi canal de youtube.
Ajustes:
habilitar sincronización de líneas verticales
habilitar sincronización de líneas horizontales
habilitar sincronización de líneas de tendencia
habil
FREE

AJUSTES Asegúrese de seleccionar la opción Desplazamiento del gráfico en el gráfico .
(Haga clic con el botón derecho en el gráfico ---> Propiedades (cuadro de diálogo) ----> Seleccione Desplazamiento del gráfico)
Por favor, valore y comente el producto para su actualización y soporte.
Cuando utilice temporizadores de velas, tenga en cuenta que el tiempo de los patrones de velas puede desempeñar un papel crucial en su estrategia de negociación. Por ejemplo, los diferentes marcos temporales (c
FREE

Indicador único que implementa un enfoque profesional y cuantitativo para el comercio de reversión a la media. Aprovecha el hecho de que el precio se desvía y vuelve a la media de manera predecible y medible, lo que permite reglas claras de entrada y salida que superan ampliamente las estrategias comerciales no cuantitativas. [ Installation Guide | Update Guide | Troubleshooting | FAQ | All Products ]
Señales comerciales claras Sorprendentemente fácil de operar Colores y tamaños personalizables

MomoPoints es un indicador que muestra puntos de entrada/adición largos y cortos en el gráfico.
Según el impulso y la fuerza de la tendencia, MomoPoints muestra entradas/adiciones con una buena relación riesgo-recompensa.
Ajustes
----------------------------------
Diseño: Se pueden ajustar colores, tamaño y aletas (símbolo gráfico) de la señal.
Configuración de señal: se puede establecer el período de media móvil, la fuerza de la tendencia, la distancia desde la media móvil al precio y el pe
FREE

ICT Bala de Plata
Si está buscando un indicador fiable para operar con el concepto ICT Silver Bullet, o conceptos ICT, Smart Money Concepts, o SMC, ¡este indicador responderá a su necesidad! Before version 2.2, this indicator was focused only on ICT Silver Bullet, but moving forward, we will include the different elements for smart money concept trading. Este indicador le ayudará a identificar lo siguiente FVG - brechas de valor razonable Estructura del mercado: BOS y CHOCH. Se basa en el swing

Este indicador dibuja canales de precios. Es fácil de utilizar. Tiene varios ajustes, por ejemplo, puede configurarlo para que muestre canales sólo para compra o venta, puede mostrar líneas de tendencia en lugar de canales. Hay muchas estrategias de negociación que se basan en el comercio en los canales, usted puede operar en el rebote de las fronteras de los canales, o la ruptura del canal. Parámetros Historial - el número máximo de barras para construir canales; Distancia - la distancia mínim

Introducción a Fractal Pattern Scanner El indicador fractal se refiere al indicador técnico que hace uso de la geometría fractal que se encuentra en el mercado financiero. Fractal Pattern Scanner es un indicador fractal avanzado que incorpora la última tecnología de negociación tras un exhaustivo trabajo de investigación y desarrollo de la geometría fractal en el mercado financiero. La característica más importante de Fractal Pattern Scanner es la capacidad de medir la probabilidad de punto de i

Este es un indicador de profundidad de mercado (DOM - Depth of Market) para MetaTrader 5 que muestra los datos del libro de órdenes en tiempo real en un formato de escalera visual. El DOM proporciona una visión completa de la profundidad del mercado con señales visuales claras para los desequilibrios de volumen, por lo que es útil tanto para scalping y swing trading decisiones Este indicador proporciona a los operadores una visualización profesional de la profundidad del mercado que puede person
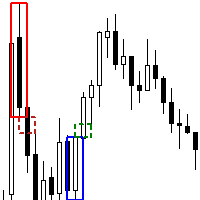
El indicador Order Block FVG Box para MetaTrader 5 es una poderosa herramienta diseñada para los operadores exigentes que buscan identificar y capitalizar las oportunidades comerciales de alta probabilidad. Este indicador destaca en la identificación de Bloques de Órdenes válidos que son seguidos inmediatamente por Fair Value Gaps (FVG), mejorando su estrategia de negociación con señales visuales precisas. Características principales: Identificación de bloques de órdenes : Detecta Bloques de Órd
FREE

El indicador es una herramienta analítica que incorpora 37 variaciones diferentes de medias móviles, desarrolladas por autores como Patrick Mulloy, Mark Jurik, Chris Satchwell, Alan Hull y otros. Ofrece la posibilidad de realizar pruebas virtuales históricas. El indicador se puede utilizar en varios instrumentos, incluidos oro, criptomonedas, índices bursátiles, pares de divisas y otros activos. Un backtester visual integrado permite a los usuarios simular posiciones de trading virtuales, monito
FREE
FlatBreakoutPro MT5 Detector de zonas planas y rupturas multisímbolo para MT5 FlatBreakoutPro MT5 es una herramienta profesional para traders modernos, diseñada para detectar y monitorizar zonas planas (laterales) y reaccionar instantáneamente a rupturas a través de múltiples instrumentos y marcos temporales. El indicador utiliza una lógica fractal transparente, garantiza señales claras no repintadas y proporciona un control visual completo de la situación del mercado. ¿Para quién es este produc

Presentamos el poderoso indicador NRTR (Nick Rypock Trailing Reverse) - una herramienta técnica imprescindible para los traders que buscan identificar las inversiones de tendencia y establecer niveles efectivos de stop trailing. Desarrollado por Nick Rypock, este indicador cuenta con un algoritmo único que se adapta a las cambiantes condiciones del mercado, convirtiéndose en una adición invaluable para el arsenal de cualquier trader.
Aquí están las dos formas populares en las que los traders u
FREE
If you love this indicator, please leave a positive rating and comment, it will be a source of motivation to help me create more products <3 ¿Cómo se utiliza el activador Gann High-Low? El Activador HiLo de Gann ayuda al operador a identificar la tendencia actual del mercado. Cuando el indicador está por debajo del precio de cierre, puede indicar que se está produciendo una tendencia alcista. Por el contrario, cuando el indicador está por encima del precio de cierre, puede indicar una tendencia
FREE

Ichimoku Kinko Hyo es un sistema de gráficos de negociación de tendencias diseñado específicamente que se ha utilizado con éxito en casi todos los mercados negociables. Es único en muchos aspectos, pero su principal ventaja es el uso de múltiples puntos de datos para ofrecer al operador una visión más profunda y completa de la acción de los precios. Esta visión más profunda, y el hecho de que Ichimoku es un sistema muy visual, permite al operador discernir rápidamente y filtrar "de un vistazo" l
FREE

Pivot Classic, Woodie, Camarilla, Fibonacci and Demark Floor/Classic Los puntos de pivote, o simplemente pivotes, son útiles para identificar posibles niveles de soporte/resistencia, rangos de negociación, reversiones de tendencia y sentimiento del mercado al examinar los valores máximo, mínimo y de cierre de un activo. Los puntos de pivote Floor/Classic se pueden calcular de la siguiente manera. Pivot Point (P) = (High + Low + Close)/3 S1 = P * 2 - High S2 = P - (High - Low) S3 = Low – 2*(High
FREE
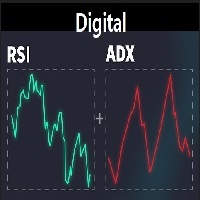
Un indicador digital ligero que combina las herramientas de impulso más importantes directamente en el gráfico. Muestra valores en tiempo real de RSI, ADX, +DI, -DI y DI Spread en un formato limpio y compacto, sin dibujar líneas ni objetos gráficos en el gráfico. Diseñado para proporcionar una visión rápida de la fuerza de la tendencia y el equilibrio entre compradores y vendedores, sin necesidad de abrir ventanas de indicadores adicionales. Totalmente personalizable: la fuente, el tamaño y la p
FREE

¿Cansado de dudar en tus entradas? Sniper Entry Signal es un sistema de trading profesional diseñado para resolver un problema específico: la sincronización.
A diferencia de los indicadores estándar que se retrasan o repintan, esta herramienta utiliza un sofisticado "Motor de Consenso de 3 Marcos Temporales". Escanea los marcos temporales M1, M5 y M15 simultáneamente. Se genera una señal SOLO cuando los tres marcos temporales coinciden en la dirección de la tendencia.
¿El resultado? Filtra el

Este indicador es un port de MQL5 inspirado en el concepto "Cyclic Smoothed RSI" desarrollado originalmente por Dr_Roboto y popularizado por LazyBear y LuxAlgo en TradingView. El RSI Cíclico Suavizado (cRSI) es un oscilador diseñado para abordar las dos principales limitaciones del RSI estándar: retraso y niveles fijos de sobrecompra/sobreventa. Al utilizar el procesamiento digital de señales (DSP) basado en los ciclos del mercado, el cRSI reduce el ruido sin sacrificar la capacidad de respuest
FREE

Ratón Puedes dibujar fibonaccis moviendo el ratón sobre el indicador en zigzag Fijarlos Puede hacer clic en fibonacci con esta opción y ya no se borrará a menos que vuelva a hacer clic en él :) Precisión El fibonacci afinado consigue el punto preciso en timeframes inferiores Disfrútalo Puedes pedirme que añada más funciones, así que por favor comenta y deja tu opinión para que yo sea feliz, gracias :)
FREE
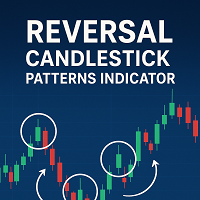
Indicador de Patrones de Velas Inversas - Versión Gratuita Este indicador MT5 identifica patrones de inversión de velas alcistas y bajistas comunes y los muestra directamente en el gráfico.
Se puede utilizar en cualquier mercado y marco temporal, proporcionando a los operadores referencias visuales claras para los posibles puntos de inversión. Características principales Detección automática de patrones de inversión de velas bien conocidos Funciona en todos los marcos temporales disponibles en
FREE

Si le gusta utilizar las Medias Móviles tradicionales (como las SMAs y las EMAs) para proporcionar a sus operaciones niveles dinámicos de Soporte y Resistencia, le encantará la Media Móvil Adaptativa (AMA). Creada en 1995 por Perry Kaufman y presentada al mundo en su libro "Smarter Trading : Improving Performance in Changing Markets ", la Media Móvil Adaptativa (también conocida como KAMA - Kaufman Adaptive Moving Average) tiene como objetivo ser la compañera perfecta para seguir una tendencia s
FREE

Entrada de tendencias premium pro
TZ Trade Logics, le presenta la versión mejorada de la entrada de tendencias Premium
Esta versión le ofrece un estado comercial mucho más relajado con funciones avanzadas para filtrado de tendencias y tiempos de entrada de señales premium.
Para nosotros, ¡no es la creación del producto lo que importa! pero mantenimiento y educación continuos para los usuarios. a través de nuestros medios dedicados para comunicarse con nosotros, disfrutará de una guía detalla
FREE

VERDADERO SESGO Sepa hacia dónde quiere ir el mercado Vea la dirección del mercado en 6 marcos temporales a la vez. Un panel profesional que muestra el análisis de sesgo en tiempo real (M1, M5, M15, H1, H4, D1) con niveles de confianza, señales de negociación procesables y detección inteligente de puntos de control. Qué hace: Muestra la dirección del mercado para cada marco temporal con % de confianza - Verde = Comprar, Rojo = Vender, Gris = Esperar Proporciona acciones de negociación claras: CO

El indicador "Bloque de rechazo" de MetaTrader 5 ofrece a los operadores una herramienta completa para identificar y visualizar patrones de velas de rechazo, comúnmente conocidos como bloques de rechazo. Estos patrones son fundamentales para discernir posibles retrocesos o continuaciones del mercado, por lo que son muy valiosos para los operadores que buscan mejorar su análisis. Características principales: Detección de Bloques de Rechazo: El indicador escanea diligentemente los datos de precios
FREE

RSI Advanced - Eleve Su Análisis y Señales de Trading de Alto Potencial Descripción General RSI Advanced es un potente indicador personalizado para MetaTrader 5, diseñado para elevar su análisis técnico y proporcionar señales de trading confiables. Este indicador integra un Índice de Fuerza Relativa (RSI) estándar con un sofisticado sistema de Medias Móviles (MA) y Bandas de Bollinger (BB) aplicadas directamente a los datos del RSI. Además, incorpora capacidades avanzadas de detección de diverge
FREE
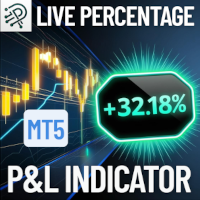
Controle rápidamente sus ganancias o pérdidas flotantes como porcentaje del saldo de su cuenta, en directo y siempre visible en su gráfico. Características principales: Cálculo en tiempo real: Calcula instantáneamente la ganancia o pérdida flotante combinada de todas las operaciones abiertas como porcentaje del saldo actual de su cuenta. Fácil visualización en el gráfico: El resultado se muestra convenientemente como una etiqueta en la esquina inferior derecha de su gráfico sin distracciones, s
FREE

Introducción Este indicador detecta patrones de dispersión de volumen para oportunidades de compra y venta. Los patrones incluyen patrones de demanda y de oferta. Puede utilizar cada patrón para operar. Sin embargo, estos patrones se utilizan mejor para detectar la zona de demanda (=zona de acumulación) y la zona de oferta (=zona de distribución). La pauta de demanda indica, por lo general, una posible oportunidad de compra. El patrón de oferta indica, por lo general, una posible oportunidad de
FREE
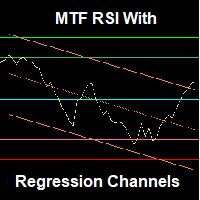
Un indicador RSI avanzado que muestra canales dinámicos de regresión lineal tanto en la ventana del indicador como en el gráfico de precios, con niveles horizontales predefinidos para detectar zonas de sobrecompra y sobreventa. Características principales (Resumen): Canales de regresión lineal sincronizados tanto en el precio como en el RSI Soporte multi-marco de tiempo Niveles horizontales inteligentes y listos para usar Diseño profesional con rendimiento optimizado Comentarios y soporte ¡Valor
FREE

Calendario de cuenta atrás de noticias de Phoenix (MT5)
Panel de cuenta atrás de noticias económicas en tiempo real para MetaTrader 5. Muestra los próximos eventos de alto impacto con temporizadores de cuenta atrás precisos para ayudar a los operadores a gestionar el riesgo en torno a los picos de volatilidad.
Objetivo
Las noticias económicas generan volatilidad, deslizamientos y caídas inesperadas. Operar a ciegas en eventos de alto impacto puede invalidar instantáneamente las configuracione
FREE

El XR Gartley Pattern MT5 es un indicador que muestra y alerta del patrón Gartley detectado en el gráfico de velas. También muestra operaciones potenciales con Take Profit y Stop Loss calculados. Después de comprar XR Gartley Pattern Indicator, puede descargar inmediatamente este indicador desde el Mercado MT4-MT5 y empezar a usarlo porque todas las características están configuradas por defecto, no es necesario cambiar ningún parámetro. Además, hemos creado un grupo privado para los clientes qu
FREE

Este indicador fue creado sobre la base de los mensajes de la fábrica de divisas hilo titulado No hay Magic Moving Average - Usted necesita sólo uno - por @andose2 a.k.a Andrei Florin. Si usted quiere saber acerca de cómo utilizar esta estrategia de negociación por favor vaya y lea https://www.forexfactory.com/thread/691864-there-is-no-magic-moving-average-you.
Nota: A continuación se presentan extractos de algunos de los mensajes .
Estabilice una tendencia, basándose en los Ciclos de Mercado,
FREE

Este indicador encuentra Doble techo y Doble fondo Ejemplo : Que es un Doble Tope Cuando el precio establece un nuevo máximo y luego cae, a continuación, revertir a la misma zona de la vela de alta entonces se considera un doble techo válido y viceversa para doble fondo. 1. 1. Traza un máximo y un mínimo en el gráfico visible si ChartChange está establecido en true, de lo contrario busca en la apertura de una nueva barra.
2. 2. Si se encuentra un doble techo y un doble suelo en la ventana visibl
FREE

Perfil del volumen de GEN Sessions Promotor: Gede Egi GEN Sessions Volume Profile es un indicador de MT5 diseñado para mostrar la distribución del volumen de cada sesión de negociación (diaria) en forma de Perfil de Volumen . Con esta herramienta, los operadores pueden ver fácilmente en qué niveles de precios se ha producido la mayor actividad de negociación durante una sesión, lo que facilita la identificación de las áreas clave del mercado. El indicador traza automáticamente las Cajas de Sesi
FREE

Este indicador puede enviar alertas cuando se produce un cambio de color Heiken Ashi Smoothed. Combinado con sus propias reglas y técnicas, este indicador le permitirá crear (o mejorar) su propio sistema poderoso. Características Puede enviar todo tipo de alertas. Opción de retrasar la alerta una o más barras para confirmar el cambio de color (tendencia). Parámetros de entrada Cambio de vela para alerta: el valor predeterminado es 1. Establecerlo en 0 le avisará sobre el cambio de color en la ve
FREE

Daily Support and Resistance Levels es un indicador profesional que calcula y muestra automáticamente los niveles clave de precio para el trading intradía mediante Puntos Pivote clásicos. Características principales: Cálculo automático del Punto Pivote (PP) 3 niveles de resistencia (R1, R2, R3) 3 niveles de soporte (S1, S2, S3) Máximo/Mínimo del día anterior Panel de información en tiempo real Sesgo del mercado (Alcista/Bajista) Distancia a los niveles más cercanos Colores y visualización person
FREE

Nota del Desarrollador:
Esta es la versión lite del Indicador Doble TMA con Bandas.
Usted puede encontrar la versión de pago que viene con alertas y flechas de señal en pantalla incorporadas aquí .
También voy a vender un EA basado en este sistema de comercio pronto una vez que todos backtesting y optimización se han completado.
¡Libere su potencial de trading con el Indicador de Doble TMA con Detección de Reversión!
Diseñado para swing y reversal trading, esta versátil herramienta integra
FREE

KC Multi-TF Unicorn Hunter es un Cuadro de Mando profesional Multi-Divisa y Multi-Tiempo diseñado para escanear todo el mercado desde un único gráfico. Deje de perder horas cambiando entre 20 gráficos diferentes. Este indicador monitoriza sus pares favoritos (Forex, Oro, Índices, Cripto) a través de 3 marcos temporales distintos simultáneamente y le alerta sólo cuando se produce una configuración "Unicornio " de alta probabilidad. ¿Qué es una configuración "Unicornio"? Los indicadores ordinarios
FREE

Monitor de patrones de velas Phoenix (MT5)
Herramienta de detección y monitoreo de patrones de velas en tiempo real para MetaTrader 5. Identifica automáticamente patrones de velas clásicos en múltiples símbolos y muestra estadísticas completas de los patrones a través de un panel visual.
Descripción general
Phoenix Candlestick Pattern Monitor detecta y rastrea los patrones Doji, Martillo, Estrella fugaz, Engullimiento alcista, Engullimiento bajista, Estrella matutina, Estrella vespertina, Tre
FREE

Acerca de:
La Envolvente de Nadaraya-Watson es un indicador técnico sofisticado pero práctico que ayuda a los operadores a identificar condiciones de sobrecompra y sobreventa utilizando métodos avanzados de regresión kernel. Esta es la versión para MT5.
Para la versión MT4 ir aquí: https://www.mql5.com/en/market/product/158640/
Características principales Bandas basadas en ATR: Tres bandas superiores y tres inferiores proporcionan zonas graduadas de sobrecompra/sobreventa Cálculo de escala l
FREE

DTFX Algo Zones son retrocesos de Fibonacci autogenerados basados en los cambios de la estructura del mercado.
Estos niveles de retroceso están destinados a ser utilizados como niveles de soporte y resistencia para buscar el rebote del precio para confirmar la dirección.
USO Figura 1 Debido a que los niveles de retroceso sólo se generan a partir de cambios identificados en la estructura del mercado, los retrocesos se limitan a partir de las zonas consideradas más importantes debido a la r

Indicador de número de vela para MetaTrader 5 El indicador de número de vela muestra una etiqueta numérica en cada vela, a partir de la barra más reciente. Esta herramienta ayuda a los operadores a seguir visualmente la progresión de las velas, lo que puede servir de apoyo a estrategias basadas en el tiempo, la estructura o la identificación de patrones.
Características: Numera cada vela desde la barra actual hacia atrás. Permite personalizar el color, la orientación horizontal o vertical del
FREE
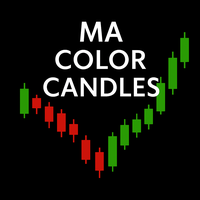
Indicador MA Color Candles MA Color Candles es un indicador para mostrar visualmente las tendencias del mercado coloreando las velas de los gráficos. No añade objetos ni distorsiona los datos de precios, sino que colorea las velas reales basándose en el estado de dos medias móviles. Esto permite una rápida evaluación de la tendencia y su uso como filtro en las estrategias de negociación. Cómo funciona Tendencia alcista: MA rápida por encima de MA lenta, MA lenta al alza (velas verdes). Tendenci
FREE

INDICADOR SUPERTREND MT5 Desarrollador: gedeegi Descripción general GEN SmartTrend Signal es un completo indicador técnico para MetaTrader 5 (MT5), centrado en la identificación de tendencias y la gestión automatizada del riesgo. Utiliza un algoritmo refinado basado en SuperTrend e impulsado por el Average True Range (ATR) para determinar la dirección de la tendencia principal. Lo que diferencia a este indicador son sus funciones integradas de gestión de operaciones que se muestran directamente
FREE

Este indicador MT5 proporciona actualizaciones en tiempo real de los clásicos gráficos Renko. Los gráficos Renko se centran en el movimiento del precio, filtrando el ruido y destacando las tendencias. Qué son las velas Renko? Los gráficos Renko muestran el movimiento del precio usando "ladrillos" de igual tamaño, ignorando el tiempo. Sólo se dibuja un nuevo ladrillo cuando el precio se mueve una determinada cantidad. Ayudan a visualizar tendencias eliminando el ruido basado en el tiempo.
Parám
FREE

Time Range Separator es una herramienta útil para mostrar un periodo separador en su plataforma.
Puedes ir a las propiedades del indicador, seleccionar el rango deseado y listo. Creemos que es una herramienta útil y necesaria que queremos compartir gratuitamente con todos nuestros seguidores. Valores de Entrada: TimeFrame = Separador de Periodos Separator_Color = Línea de Color Vertical Separator_Style = Estilo Color Vertical Separator_Width = Ancho de Línea Vertical Buen trading a todos y hast
FREE

El precio medio ponderado por volumen (VWAP) es utilizado por las instituciones financieras para colocar grandes operaciones a lo que se considera el valor justo de la sesión. Los canales de desviación estándar en torno al VWAP proporcionan posibles puntos de entrada para estrategias de reversión a la media o de ruptura, y el propio VWAP puede actuar como un nivel de salida de alta calidad. Si ha oído que el análisis basado en el volumen no funciona para el mercado de divisas y los CFD, pruebe a
FREE

Moving Average Alerts es un indicador simple y eficiente que contiene 4 medias móviles totalmente configurables, permitiendo al trader elegir períodos, métodos y configuraciones según su estrategia. Cada media móvil cuenta con dos alertas independientes, que pueden activarse o desactivarse por separado: Alerta cuando el precio cierra por encima de la media
Alerta cuando el precio cierra por debajo de la media Las alertas se activan únicamente al cierre de la vela, evitando señales repetidas o fa
FREE

Piense en el Indicador Super Fractal como el Indicador Bill WIlliams con esteroides. Habilidades del Indicador: 1. 1. Ajustar la Vela alrededor del Máximo o Mínimo Fractal. 2. 2. Ajustar el período de retrospectiva y sólo trazar para un número específico de velas de la historia evitando el desorden de su mesa de operaciones. 3. 3. El indicador utiliza buffers para que pueda llamarlo y utilizarlo desde cualquier EA.
Nota : Cuanto más altas sean las velas alrededor del Fractal, más fuerte será el
FREE

Este indicador está diseñado para detectar patrones de inversión de alta probabilidad: Dobles Tops/Bottoms con rupturas falsas . Esta es la versión GRATUITA del indicador: https://www.mql5.com/en/market/product/29957 La versión gratuita sólo funciona con EURUSD y GBPUSD. Los patrones de doble techo y fondo son patrones gráficos que se producen cuando el instrumento de negociación se mueve en un patrón similar a la letra "W" (doble fondo) o "M" (doble techo). Estos patrones suelen producirse al f
FREE
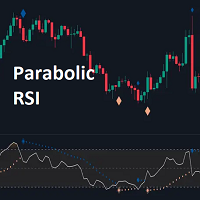
El indicador RSI Parabólico aplica el SAR Parabólico directamente al Índice de Fuerza Relativa (RSI) . Esta combinación ayuda a los operadores a identificar los cambios de tendencia y los posibles puntos de inversión dentro del marco del RSI. El indicador proporciona señales regulares y fuertes en función de si el SAR Parabólico cruza por encima o por debajo de los umbrales clave del RSI.
CARACTERÍSTICAS CLAVE
SAR Parabólico Aplicado al RSI - Rastrea los cambios de impulso dentro del indic
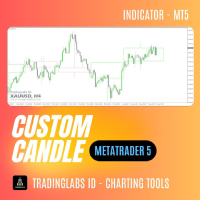
Custom Candle - Visualización Multi-Timeframe Analizar múltiples marcos temporales es esencial para tomar decisiones de trading precisas, pero cambiar de un gráfico a otro puede resultar incómodo e ineficaz. El indicador Custom Candle resuelve este problema mediante la superposición de velas de tiempo superior (HTF) directamente en su gráfico de tiempo inferior (LTF). Esto le permite ver el panorama general de un vistazo, alinearse con la tendencia superior y mejorar la precisión de las operacio
FREE

Introducción
El PF Maximizer es una herramienta técnica sin repintado que cambia las reglas del juego, diseñada para ayudar a los operadores a distinguir las auténticas señales de tendencia de las fluctuaciones erráticas del mercado. Mediante el empleo de sofisticados algoritmos y análisis de datos de vanguardia, este indicador filtra eficazmente el ruido no deseado, permitiendo a los operadores identificar los puntos precisos de inicio y finalización de los movimientos sustanciales del mercad
FREE

Descripción del indicador Harmonic Patterns + Fib
El indicador Harmonic Patterns + Fib es una herramienta de análisis técnico diseñada para MetaTrader 5 (MT5). Detecta y visualiza automáticamente patrones armónicos de precios en gráficos financieros, aprovechando los ratios de Fibonacci para identificar potenciales puntos de reversión en mercados como el de divisas, acciones, criptodivisas y materias primas. El indicador busca formaciones armónicas clásicas como Mariposa, Murciélago, Cangrejo,
FREE
Si operas en los mercados financieros, seguramente sabes lo importante que es el spread: esta diferencia entre el precio de compra (ask) y el de venta (bid) puede afectar seriamente tus ganancias. Spread Size es un indicador simple pero muy útil que muestra el spread actual directamente en el gráfico. ¡Ya no necesitas monitorear los datos manualmente constantemente: todo está justo frente a tus ojos! ¿Para qué sirve?
El spread no es solo un número. Es tu dinero real. Un spread bajo significa
FREE

Este indicador dibuja una línea en los niveles máximos y mínimos de X número de días. Es posible tener una alerta (en el software y la aplicación móvil) para cuando el precio rompe el máximo o mínimo del día actual. Configuraciones: Días - días pasados a calcular (1 = sólo día actual).
Alerta al alcanzar niveles - activar la alerta para niveles específicos o ambos.
Notificación Push - activar la alerta a la app móvil MT5.
Apariencia
Alto - color del nivel alto .
Bajo - color del nivel bajo .
T
FREE

Este Indicador Mt5 Señala cuando hay dos barras de dirección opuesta engullidas por la barra actual. tiene un cruce de medias móviles exponenciales reciente y la barra anterior estaba sobrevendida/comprada Expert Advisor Disponible en Comentarios Versión Gratuita Aquí : https://www.mql5.com/en/market/product/110114?source=Site Alertas completas para mt5 terminal , teléfono , correo electrónico, imprimir en archivo, imprimir en diario Señal de compra ( línea azul ) Cruce ema pasado ( fijad
FREE

La Media Móvil Ponderada por Volumen (VWMA) se calcula en base a los Precios y sus Volúmenes relacionados dando importancia a aquellas velas con más Volumen. Durante periodos de casi igual volumen distribuido a lo largo del periodo observado (comúnmente, en periodos de bajo volumen) la VWMA será gráficamente similar a una Media Móvil Simple. Utilizada junto con otras medias móviles una VWMA podría ser utilizada como alerta, filtro o lo que tu imaginación te permita...
CÓMO "LEER" ESTE INDICADOR
FREE

TRUE TIMER - Cuenta atrás de velas Cuenta atrás en tiempo real (MM:SS) que muestra los segundos hasta el cierre de la vela en cualquier marco temporal. Cuenta con mensajes de alerta que le avisan de nuevas velas. Características principales: Cuenta atrás precisa en tiempo de servidor. Detección automática de color (fondos claros/oscuros). Inteligente "Nueva Vela" y alertas de tiempo en grandes movimientos. Funciona en todos los marcos de tiempo M1 → Mensual. Perfecto para: Scalpers y sincronizac
FREE
El Mercado MetaTrader es la única tienda donde se puede descargar la versión demo de un robot comercial y ponerla a prueba, e incluso optimizarla según los datos históricos.
Lea la descripción y los comentarios de los compradores sobre el producto que le interese, descárguelo directamente al terminal y compruebe cómo testar el robot comercial antes de la compra. Sólo con nosotros podrá hacerse una idea sobre el programa, sin pagar por ello.
Está perdiendo oportunidades comerciales:
- Aplicaciones de trading gratuitas
- 8 000+ señales para copiar
- Noticias económicas para analizar los mercados financieros
Registro
Entrada
Si no tiene cuenta de usuario, regístrese
Para iniciar sesión y usar el sitio web MQL5.com es necesario permitir el uso de Сookies.
Por favor, active este ajuste en su navegador, de lo contrario, no podrá iniciar sesión.