适用于MetaTrader 5的技术指标 - 18

Stochastic indicator alerts when EA Available in comments , must have indicator installed buys stochastic main line is above signal line stochastic is below 30 rsi 5 is below 20 sell stochastic main line is below signal line stochastic is above 70 rsi 5 is above 80 ADD to chart Stochastic k 30 - d 9 - slowing 3, levels 30/70 rsi 5 lelels 20.80
Full alerts push, mobile , email ect All input settings variable feel free to contact for more information or alert sugestions
FREE
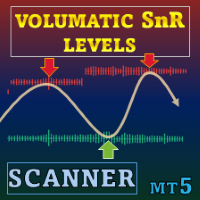
特别优惠 : ALL TOOLS ,仅 $35 一个! 新工具 将以 $30 在 第一周 或 前 3 笔购买 销售! Trading Tools Channel on MQL5 : 加入我的 MQL5 频道获取最新动态 Volumatic Support/Resistance Levels Scanner 是一款支撑/阻力指标,为价格结构加入成交量背景。通过显示交易活动在近期转折点附近的聚集情况,它帮助用户了解买入或卖出兴趣最活跃的位置。 查看 MT4 版本: Volumatic Support Resistance Levels MT4 Scanner 查看更多产品: All P roducts 1 · 概览 该指标从最近的高点和低点绘制价格区间,并为每个区间叠加成交量直方图。直方图厚度会随当前市场活动而扩展或收缩,使用户能够衡量市场对特定价格水平的关注度。 2 · 关键概念 价格区间 — 在最近价格转折点绘制的水平带。 成交量直方图 — 根据区间附近成交量百分位变化宽度的填充带。 高成交量标记 — 当区间成交量超过用户设定阈值时出现的圆圈。 Bars

Quantum Profile System is a fully-fledged professional trading system with advanced algorithms, combining everything needed for confident and stable trading. This indicator merges trend direction analysis, volume concentration at key levels, dynamic adaptation to market volatility, and generation of trading signals with no delay or repainting. Quantum Profile System integrates a Linear Regression Volume Profile with an adaptive ATR-based trend channel. It includes an extended Volume Profile modu

Description This technical indicator is designed to automate the analysis of market structure based on price action concepts. It identifies and labels key structural points, including Higher Highs (HH), Lower Lows (LL), Lower Highs (LH), and Higher Lows (HL), to assist traders in visualizing market trends. The indicator uses a configurable "Swing Strength" logic, checking a user-defined number of bars to the left and right of a pivot to confirm its validity. It also identifies Break of Structure
FREE
The Moving Average Ribbon is a technical indicator that overlays a series of moving averages (MAs) on a price chart to visualize trend direction, strength, and potential reversals or reentries. It supports both Exponential Moving Averages (EMA) and Simple Moving Averages (SMA), configurable via user input.
Key Features:
Ribbon Composition: Displays 18 moving averages with periods ranging from 5 to 90 in increments of 5 (e.g., MA5, MA10, ..., MA90), plus an internal MA100 for reference. The MA5
FREE

多货币和多时间框架指标 MACD。 仪表板可以显示传统(真实)MACD 和 MetaTrader 中内置的 MACD。
在面板上,您可以看到指标的当前状态 - MACD 线的移动方向、它们的交点以及带有指标图表的弹出窗口。 在参数中,您可以指定任何所需的交易品种和时间范围。 扫描仪还可以发送有关线相互交叉以及线穿过零电平的通知。 通过单击单元格,将打开给定的符号和句点。
您还可以看到价格和 MACD 线之间的差异(常规和隐藏),以及价格和直方图之间的差异。 因此,您可以轻松扫描所有时间范围的所有货币对和交易品种,以找到 MACD 主线和信号线或零水平的交叉点。
显示/隐藏仪表板的热键默认为“D”。 默认情况下,启用/禁用弹出图表的热键为“C”。 用于切换图表“1”和“2”上的箭头的热键. MACD(移动平均收敛/发散)指标(或“振荡指标”)是根据历史价格数据(最常见的是收盘价)计算得出的三个时间序列的集合。 这三个系列是:MACD 系列本身、“信号”或“平均”系列以及“背离”系列(两者之间的区别)。 MACD 系列是价格系列的“快速”(短期)指数移动平均线 (EMA) 和“慢速

This indicator calculates fibonacci levels via moving averages trend and draw these lines. You can change fast and slow Moving Averages settings for customization. Inputs:
Fast MA Time Period : 64 Fast MA Shift: 0 Fast MA Method: Smoothed Fast MA Apply To: Median Price Slow MA Time Period: 32 Slow MA Shift: 0 Slow MA Method: Smoothed Slow MA Apply To: Median Price ZigZag: False ZigZag Color: Red ZigZag Type: DashDot ZigZag Width: VeryThin Fibo Settings TrendFibonacci: True FiboTrendColor: Black
FREE

Draw and Sync Objects Multiple Charts 1. Draw objects by key press. ( You must: 1. Press Function key => 2. Click where you want to draw => 3. Draw it => 4. Press ESC to complete). (If you don't want to draw after pressing function key, you must press ESC to cancel). 2. Developing : Sync selected objects to multiple charts by button. 3. Developing: Hide objects that do not belong to the current symbol (Objects drawn with this indicator will belong to the symbol they are plotted on. When your c
FREE
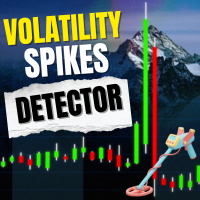
Volatility Monitor – 实时波动检测指标 概述 Volatility Monitor 是一款轻量级且专业的 MT5 指标,用于跟踪突发价格波动并实时提醒交易者。无论您交易外汇、黄金、日元货币对还是加密货币,该工具都能通过 ATR 自动检测或手动点数阈值提供清晰的市场波动信号。 它会在图表上直接标记蜡烛,并发送渐进式提醒,帮助交易者快速应对行情波动、新闻事件和突破行情。 主要功能 实时波动检测 – 即时识别市场波动。 灵活的检测模式 – ATR 自动模式或手动点数模式。 渐进式提醒 – 声音提示 (1–3 次),弹窗通知和推送提醒。 智能蜡烛标记 – 彩色圆点 (黄色/橙色/红色) 标示不同波动强度。 自动适配颜色 – 自动识别深色或浅色图表背景。 内置仪表盘 – 显示实时蜡烛范围、ATR 值、波动百分比及历史峰值。 通用支持 – 兼容外汇、黄金、日元货币对和加密货币。 输入与设置 检测模式: ATR 自动或手动点数。 历史回溯: 自定义分析蜡烛数量。 标记设置: 启用/禁用标记,选择大小和颜色模式。 提醒: 启用声音、弹窗、推送提醒。 仪表盘: 可调整位置,实时显示波
FREE

Interactive AVWAP Pro — TradingView 风格 MetaTrader 5 上最易用的锚定 VWAP。拖拽、释放、自动吸附。 终于,TradingView 的便捷体验现在来到了 MT5! 别再让垂直线弄乱您的图表,也不要在繁琐的设置中浪费时间。 Interactive AVWAP Pro 将直观的“拖放”(Drag & Drop)功能带入了 MetaTrader 5。 专为追求速度与精度的专业交易者设计。只需用鼠标抓住锚点,将其拖到任何高点或低点,指标即刻从该确切时刻自动计算成交量加权平均价格(VWAP)。 为什么这是市场上最好的 AVWAP: 交互式锚点:
不再有遮挡视线的垂直线!我们使用极简的 圆形锚点 (就像 TradingView 一样)。将其拖动到任何地方 — VWAP 瞬间重新计算。 智能磁吸技术 (Smart Magnet):
无需像素级的精确瞄准。锚点会自动“吸附”到最近 K 线的价格。 极致优化:
基于高性能 C++ 风格内核编写。即使在最大历史数据的 M1 图表上使用,也不会拖慢您的终端。拖拽操作流畅顺滑, 零延

Gann Hilo — Precision and Clarity in Trend YouTube Channel: @BotPulseTrading
GannHilo is a technical indicator designed to identify precisely and visually trend changes in the market. Combining price structure with Gann theory, this system draws dynamic lines that act as smart guides of direction and support . Its minimalist design and optimized algorithm allow for a clean and effective reading, showing exactly when momentum shifts direction without noise or unnecessary delays. Ideal for both
FREE
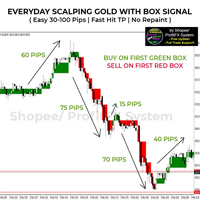
Always getting MARGIN CALLS again and again? Still haven’t found an indicator or technique that DELIVERS CONSISTENT DAILY PROFIT ? Tired of depositing funds and desperately wishing you could FINALLY WITHDRAWING ?
Don’t worry. I’m a REAL FULL TIME TRADER and I’ll share with you the very indicator I'VE BEEN USING MYSELF to successfully become a full-time trader.
STOP WASTING time with indicators that aren’t created by real traders and have no proven track record!
Start today with th
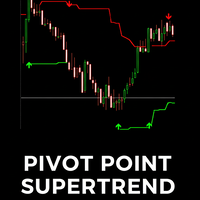
The Pivot Point Supertrend indicator is a technical analysis tool designed for the MetaTrader 5 (MT5) platform. It combines two popular analytical methods: Pivot Points: Uses significant historical price highs and lows to identify potential support and resistance zones. These points are objective and stable. Supertrend: A well-known trend-following indicator that helps identify the current market trend and provides dynamic stop-loss levels. Indicator's Goal: By using the stability of Pivot Point
FREE
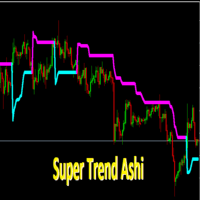
SuperTrendAshi Description SuperTrendAshi is an advanced and optimized version of the SuperTrend indicator that incorporates Heikin Ashi calculation to provide smoother and more reliable signals. This unique combination results in an indicator that reduces false signals and identifies trends with greater precision. Key Features Combines the strength of SuperTrend with Heikin Ashi smoothing More stable signals with less noise Intuitive color system (Aqua for uptrend, Magenta for downtrend) Custo
FREE

Description (English): Trend Test by Subho – Advanced Trend & Step Channel System Trend Test by Subho is a powerful all-in-one trend trading system designed to filter noise and provide clear market direction. This indicator combines two sophisticated algorithms: the Trend Test () and the Subho Step Channel into a single chart overlay. It also features a stylish Live Dashboard that alerts you to the current trend status in real-time. Key Features: Trend Test () Logic: An advanced tr
FREE

Shadow System Candles - AI Trend Visualization
Concept "Stop trading in the dark. Equip your chart with Night Vision."
Shadow System Candles is the visual core of the "Shadow Operation" project. It eliminates market noise and visualizes the true direction of the trend using AI-based logic (ADX + MA integration).
Note: This tool does not generate buy/sell arrows. It is designed to train your eyes to recognize "Active Trends" and "Dangerous Ranges.
Key Features ・AI Logic Coloring[/b]: Automat
FREE

Norion Smart Levels is a professional support and resistance indicator developed to help traders identify the most relevant price levels where the market historically reacts. The indicator analyzes price structure and market behavior to automatically plot key support and resistance levels, eliminating subjectivity and reducing chart noise. The result is a clean, objective, and easy-to-read visualization that adapts to different market conditions. Key Features: Automatic detection of support and
FREE

Utazima 001 Indicator AI Professional Market Structure & Opening Range System STOP GUESSING. START TRADING WITH STRUCTURE. Utazima 001 Indicator AI is a next-generation Market Structure & Opening Range Intelligence System , built for traders who want clarity, precision, and consistency . This is not a repainting signal tool.
This is institutional-grade logic , simplified and automated for retail traders. Designed by Utazima MentorCreate , this indicator reveals the most important price zo
FREE
ZIGZAG and FRACTAL CANDLE PRO ( Only candles, No RSI strength panel) " Suitable for QQE RITZ " > Check My Product is an advanced market structure visualization system built for precision trend detection, powered by dynamic fractal logic and adaptive swing validation.
It seamlessly identifies Higher Highs (HH), Lower Lows (LL), and key structural shifts — allowing traders to read the true rhythm of market transitions with institutional clarity. This system combines ZigZag precision , fractal
FREE

ChannelRSI5 具有超买和超卖区域动态水平的相对强弱指数 (RSI) 指标。
动态水平随指标和价格的当前变化而变化和调整,代表一种通道。
指标设置 period_RSI - 计算 RSI 指数的平均周期。 Applied_RSI - 应用价格。它可以是任何价格常数:PRICE_CLOSE - 收盘价,PRICE_OPEN - 开盘价,PRICE_HIGH - 期间的最高价,PRICE_LOW - 期间的最低价,PRICE_MEDIAN - 中间价(高 + 低) / 2, PRICE_TYPICAL - 典型价格(最高价 + 最低价 + 收盘价)/ 3, PRICE_WEIGHTED - 加权平均价,(最高价 + 最低价 + 收盘价 + 收盘价)/ 4。
period_channel - 超买超卖区域动态通道的计算周期。
FREE
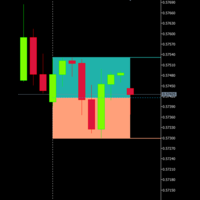
If you like this product, please give it a 5 star rating as a token of appreciation.
This indicator draws the premium and discount zones of a single candle from any timeframe on your chart.
You choose which candle (current or previous) using CandleOffset, and the indicator automatically retrieves that candle’s high, low, and midpoint.
It then visually displays:
Premium Zone (Upper 50%)
A shaded rectangle from the candle’s midpoint to high.
Discount Zone (Lower 50%)
A shaded rectangle from th
FREE

This indicator is especially for the binary trading. Time frame is 1 minutes and exp time 5 or 3 minutes only. You must be use martingale 3 step. So you must put lots size is 10 % at most. You should use Mt2 trading platform to connect with my indicator to get more signal without human working. This indicator wining rate is over 80% but you may get 100% of profit by using martingale 3 step. You should use MT2 Trading Platform to connect meta trader platform and binary platform . You can get mt2
FREE

FREE

The outside bar indicator shows a range of inside bars and the breakout up and down from the range. The breakout is always displayed at the start of a new range and is extended until another breakout. The calculation always takes place at the start of a new candle. So it is displayed accordingly in all time frames. In inside bar ( insidebar ) trading you can see the top and bottom of a range.
In outside bar ( outsidebar ) trading, the breakout from a range and thus the trend following.
The col
FREE
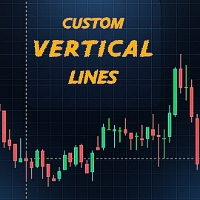
该指标会在您设定的时间自动绘制垂直线,并可选择性地在这些时刻的开盘价处添加水平线。它帮助交易者标记关键事件,例如市场开盘时间、策略时间或自定义的日内水平。 Features: 每天最多绘制 两条可自定义的垂直线 。 可选择从指定时间的开盘价绘制 水平线 。 完全可自定义 颜色、样式和线条宽度 。 轻量、快速,不会拖慢图表。 适用于任何 交易品种和周期 。 如果只需要 一条线 ,将第二个时间留空即可。 如果不想要任何线条,请将两个时间都留空。 How to Use: 将指标加载到任意图表。 在输入参数中设置所需时间(如 07:00, 14:30)。 调整线条的样式、颜色和宽度。 可选:选择哪个时间生成水平线。 如果需要更少甚至不需要线条,请留空输入。 该工具非常适合需要 清晰视觉标记 的交易者,用于标注交易时段、策略或日常操作。
FREE

This indicator displays buy or sell signals according to Bill Williams' definition of the Trading Zone. [ Installation Guide | Update Guide | Troubleshooting | FAQ | All Products ] Easy to use and understand Avoid trading flat markets Deterministic indicator with clear rules The indicator is non-repainting It implements alerts of all kinds It has straightforward trading implications. A blue arrow is a buy signal A red arrow is a sell signal According to Bill Williams trading in the zone helps t
FREE

GomerAI REGIME 指标是一款适用于 MetaTrader 5 的市场状况分类指标,旨在帮助交易者了解他们当前所处的市场环境类型。 REGIME 指标并非生成交易信号或执行交易,而是分析价格行为的三个维度——趋势强度、波动性和区间行为——将当前市场分为三种明确定义的市场状态之一: 平静期 – 低波动性,区间震荡
趋势期 – 方向性运动,波动性适中
极端期 – 波动性剧烈,可能出现趋势耗尽或转折区域
该指标以直方图的形式在图表下方的一个单独窗口中显示其输出。柱状图的颜色代表当前的市场状态,而柱状图的高度代表分类的置信水平(0-100)。 主要特点 市场状态分类(平静期/趋势期/极端期)
基于置信度的可视化(0-100)
非重绘,基于收盘价计算
适用于所有交易品种和时间周期
优化低CPU占用率
可选的遥测和许可集成
完全离线运行(独立模式)
专为提供市场背景信息而设计,而非执行交易
REGIME 指标不进行交易、管理头寸或提供入场/出场指令。它是一个提供市场背景信息的指标,旨在帮助交易者和智能交易系统根据当前市场状况调整策略。 不同的策
FREE

Daily Weekly Monthly High Low - Your Ultimate Tool for Precision Market Analysis
The 200 free download promotion has ended. The price has now been updated. Thank you, everyone!
Love it? Hate it? Let me know in a review! Feature requests and ideas for new tools are highly appreciated. :)
Try "The AUDCAD Trader":
https://www.mql5.com/en/market/product/151841 Overview:
Elevate your trading strategy with Daily Weekly Monthly High Low , a sophisticated MQL5 indicator designed to pinpoint c

- Displays horizontal lines for Previous Day High (PDH) and Previous Day Low (PDL) on the chart. - Customizable line colors via input parameters. - Sends sound alerts, pop-up notifications, and mobile push notifications upon the initial crossover of PDH or PDL. - Alerts are triggered only once per crossover event; they re-trigger only if the price moves away and re-crosses after a specified minimum interval. - Automatically updates the PDH/PDL levels at the start of each new day. - All indicator
FREE
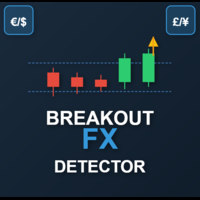
This is a powerful, session-aware breakout indicator designed for serious traders who thrive on volatility and structure. Engineered for precision, it identifies high-probability breakout zones during the London and New York trading sessions—where the market moves with intent. Key Features: Session Range Detection
Automatically detects and highlights the key price range of London and New York sessions. Breakout Confirmation
Identifies breakout candles after the session range, with clear bullis
FREE
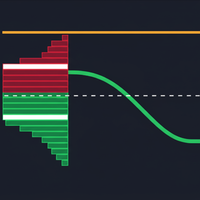
The "Volume Range Profile with Fair Value" (VRPFV) indicator is a powerful volume analysis tool designed to help traders better understand market structure and identify key price areas where significant institutional activity occurs. Instead of just looking at volume on individual candlesticks, VRPFV analyzes the distribution of volume by price level within a specific time range, providing deep insights into the "footprint" of smart money. VRPFV consists of the following core components: Upper &
FREE

If you love this indicator, please leave a positive rating and comment, it will be a source of motivation to help me create more products <3 Key Takeaways Provides both trend and momentum signals in a single view. Entry and exit signals are based on the crossover of the RSI and Signal Line. Market Base Line offers insight into the overall trend direction. Volatility Bands help identify overbought and oversold market conditions.
FREE

AI Forecasts MT5指标:
基于人工智能与深度学习(AI + ML)的未来预测系统
_ 主要特点: 基于动态数据分析,最多可预测未来20根K线 适用于剥头皮交易 多色预测图表反映置信度,当前买卖状态旁显示白色点计数器 概率区间显示预期价格路径及其概率变化范围与方向 主要基于Shock Pullback指标的多变量分析,包括: 回调区域、缺口开盘与收盘的计算研究 黄色箭头生成的斜率、加速、减速与反弹信号 曲折指标角度与突破/上升趋势区域计算 旗形与模式图谱等模型分析 累积区域与缺口的建模分析及其对未来走势影响 图表形态在预测计算中的整合 人工智能:
采用MQL5结构与环境设计的先进神经网络架构"注:学习与AI系统为内置式,不依赖Python等外部环境" _ 5层深度神经网络:
• 第一层:32个神经元(24个特征输入)
• 第二层:16个神经元
• 第三层:8个神经元
• 第四层:4个神经元
• 第五层:2个神经元(预测值与置信度输出) 智能注意力机制:
动态聚焦关键特征 基于集成计算与模型表现的权重自动更新系统 _ 分析特征(24项进阶特征): 订单流与多

Introduction
The PF Maximizer is a game-changing non-repainting technical tool engineered to help traders distinguish genuine trend signals from erratic market fluctuations. By employing sophisticated algorithms and cutting-edge data analysis, this indicator efficiently filters out unwanted noise, empowering traders to identify the precise starting and ending points of substantial market moves.
Signal
Potential buy signal is generated when moving average is going up and the blue line cross a
FREE
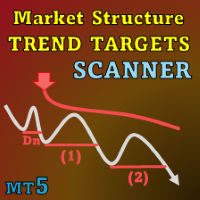
Special offer : ALL TOOLS , just $35 each! New tools will be $30 for the first week or the first 3 purchases ! Trading Tools Channel on MQL5 : Join my MQL5 channel to update the latest news from me I. 介绍
Market Structure Trend Targets Scanner 是一个强大的工具,用于分析市场趋势、识别突破点,并通过动态止损管理风险。通过跟踪之前的高点和低点以确定突破点,这个工具帮助交易者以直观的方式快速识别市场趋势和潜在的反转。 查看更多MT4版本: Market Structure Trend Targets MT4 Scanner 查看更多产品: 所有 产品 II. 主要特点 通过顺序编号识别突破点 清晰区分上升趋势 当价格突破之前的高点,以及下降趋势当价格突破之前的低点。 用入场价标记初始突破 ,而后续的突破标记为(1, 2,
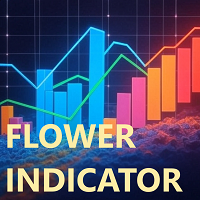
花形指标是一种技术分析工具,主要用于识别趋势并辅助剥头皮交易或日内交易策略。
花形指标是一种基于技术和价格动态分析的信号趋势指标。它使用彩色花朵直观地指示趋势——蓝色花朵表示上升趋势,红色花朵表示下降趋势。
每个水平线都可以充当支撑位和阻力位(注意图表上出现的+/- 200水平线和点)。
您可以将点设置为在突破超买/超卖静态水平线、伴随的波段、两者兼有或其中任何一者时出现。
该指标在识别吸筹/派发区域的同时,还能发现市场的潜在逆转。它兼容任何交易工具和时间框架,参数可根据需要调整。每个水平线都可以充当支撑位和阻力位。 花卉指標是一種技術分析工具,主要用於識別趨勢並協助剝頭皮交易或日內交易策略。
花指標是基於技術和價格動態分析的訊號趨勢指標。它使用彩色花朵直觀地表示趨勢——藍色花朵表示上升趨勢,而紅色花朵表示下降趨勢
每個等級都可以充當支撐和阻力(注意 +/- 200 等級和圖表上出現的點)
您可以將點設定為在突破超買/超賣靜態水平或伴隨的波段(兩者或其中任何一個)時出現。
此指標在識別累積/分佈區域的同時,也發現了市場的潛在逆轉。它與任何工具和時間範圍相容,參數可隨意
FREE
[ MT4 Version ] Are you tired of spending months on demo or live accounts to test your trading strategies? The Backtesting Simulator is the ultimate tool designed to elevate your backtesting experience to new heights. Utilizing Metatrader historical symbol information, it offers an unparalleled simulation of real market conditions. Take control of your testing speed, test ideas quickly or at a slower pace, and witness remarkable improvements in your testing performance. Forget about wasting tim
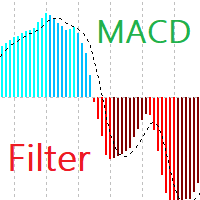
MACD Filter Introducing MACD Filter – a fresh take on the beloved MACD (Moving Average Convergence Divergence) indicator, developed specifically for the MetaTrader 5 platform. By applying the Fisher Transform for filtering and refining data, MACD Filter creates smoother lines, eliminating noise and providing clearer signals. Fisher Transform Filtering: Normalizes and smooths MACD data. This leads to smooth, less chaotic lines compared to traditional MACD, reducing false signals and simplifying
FREE

FREE

Level Breakout Indicator is a technical analysis product that works from upper and lower boundaries, which can determine the direction of the trend. Works on candle 0 without redrawing or delays.
In its work, it uses a system of different indicators, the parameters of which have already been configured and combined into a single parameter - “ Scale ”, which performs gradation of periods.
The indicator is easy to use, does not require any calculations, using a single parameter you need to select

AstroCycles: Advanced Financial Astronomy Indicator Overview AstroCycles is a sophisticated technical analysis tool developed for the MetaTrader 5 (MQL5) platform. It bridges the gap between orbital mechanics and financial market analysis by calculating precise astronomical cycles and visualizing them directly on your trading chart. Unlike standard indicators that rely on past price data, AstroMaster utilizes high-precision astronomical algorithms (Keplerian Elements and Brown’s Lunar Theory)
FREE

Gold TL MTF - this is a fine stock technical indicator. The indicator algorithm analyzes the movement of the asset price and reflects trend lines along the fractals of a specific timeframe (TF).
Benefits of the indicator: The indicator produces signals with high accuracy. The confirmed signal of the indicator does not disappear and is not redrawn. You can trade on the MetaTrader 5 trading platform of any broker. You can trade any assets (currencies, metals, cryptocurrencies, stocks, indices e
FREE

SuperTrend Alert with Email Notification – Your Smart Market Sentinel! Overview: SuperTrend Alert with Email Notification is a lightweight and powerful tool that helps traders stay ahead of trend changes in real-time . Built on the widely trusted SuperTrend indicator , this tool monitors price action and instantly notifies you via email when a new BUY or SELL signal is triggered – no more missed opportunities! ️ Key Features: SuperTrend-Based Signals Uses SuperTrend algorithm (ATR-base

RSI with moving average is great to see when the price is overbought and oversold instead of RSI only.
INPU T PARAME TERS : RSI:
Period - RSI period.
Price - RSI applied price.
Color scheme - RSI color scheme (4 available). MOVING AVERAGE:
Period - MA period.
Type - MA type.
Apply - MA applica tion.
Shift - MA shif t (correc tion). PRICE LINE:
Show - specify if line with price, only line or nothing.
Style - line style. OTHER:
Overbought level - specify the level .
Overbought descriptio
FREE

Weis Waves(魏斯波浪) 是由大卫·魏斯 (David Weis) 开发的技术指标,灵感来源于理查德·威科夫 (Richard Wyckoff) 的原理。
与传统逐根显示的成交量不同,Weis Waves 将成交量累积为连续的上涨或下跌“波浪”,当价格方向反转时重新开始计算。 这种方法使交易者能够清晰地看到市场运动的 真实力度 ,因为每一波浪都反映了支撑一系列K线的成交量强度。 主要特点: 将成交量分组为买入波浪和卖出波浪。 突出显示市场的主导力量(买方或卖方)。 有助于识别 趋势延续 或 潜在反转 。 基于威科夫方法论,被广泛应用于成交量与资金流分析。 Weis Waves 被众多专业交易者使用,用于分析价格与成交量之间的平衡,提供更深入的市场动态视角。
FREE

体验 "Demark Trends" 指标的威力,进行全面趋势分析和获取交易见解。 Demark 指标以其在评估市场趋势和耗尽点方面的有效性而闻名。我们的 "Demark Trends" 指标将此经验提升到新的水平,自动在您的图表上绘制精确的趋势线。通过可自定义的参数,包括计算中的蜡烛数量、警报设置和线条颜色,您可以完全掌控您的分析。无论您是新手还是经验丰富的交易者,我们的指标都可以简化趋势分析,节省您的时间和精力。 释放 "Demark Trends" 指标的潜力: 准确识别趋势: 使用自动绘制的精确趋势线,无缝分析市场趋势。 高效的交易策略: 评估当前趋势状态,预测潜在的耗尽点,做出明智的交易决策。 可自定义的参数: 通过调整蜡烛数量、警报设置和线条颜色,将指标定制为您的偏好。 用户友好的界面: 只需将指标拖放到您的图表上,即可立即可视化趋势线。 节省时间: 告别手动绘制趋势线,为战略性决策节省宝贵时间。 增强的模式识别: 在趋势线的背景下轻松识别模式,提升交易策略。 全面的趋势分析: 借助 "Demark Trends" 指标,深入了解市场趋势和潜在反转。 不要错过 "Demar
FREE

BEHOLD!!!
One of the best Breakout Indicator of all time is here. Multi Breakout Pattern looks at the preceding candles and timeframes to help you recognize the breakouts in real time.
The In-built function of supply and demand can help you evaluate your take profits and Stop losses
SEE THE SCREENSHOTS TO WITNESS SOME OF THE BEST BREAKOUTS
INPUTS
MaxBarsback: The max bars to look back
Slow length 1: Period lookback
Slow length 2: Period lookback
Slow length 3: Period lookback
Slow leng
FREE

I think you all know Donchian Channels. so I am not going to write about it.
With this indicator I tried to create Donchian Trend Ribbon by using Donchian Channels.
How it works ?
- it calculates main trend direction by using the length that is user-defined. so you can change it as you wish
- then it calculates trend direction for each 9 lower lengths. if you set the length = 20 then the lengths are 19, 18,...11
- and it checks if the trend directions that came from lower lengths is same
FREE

Dark Sprint is an Indicator for intraday trading. This Indicator is based on Trend Following strategy, also adopting the use of the atr to determine the right volatility. We can enter in good price with this Indicator, in order to follow the strong impulse on the current instrument.
Key benefits
Easily visible sprint lines Intuitive directional arrows Automated adjustment for each timeframe and instrument Easy to use even for beginners Never repaints, never backpaints, Not Lag 100% compatibl

No Demand No Supply This indicator identifies No Demand –No Supply candles to your chart and plots volume bars colored according to the signal. It can be applied to all timeframes or to a specific one only. It can also be used as regular volume indicator with exceptional future of WEIGHTED VOLUME. Furthermore is has an alert notification, sound and email when a signals occurs. The indicator does not repaint but the alert will come on two candles back due to the definition of No Demand No Su

【ZhiBiDW Trend】是一款简单、直观、有效的趋势和震荡的指标。它适合用在15分钟以上并且4小时以下的图表周期,适合所有市场品种。 Buy signal:出现蓝色向上箭头;箭头出现后会附带止损和止盈的预设价格。 Sell signal:出现红色向下箭头;箭头出现后会附带止损和止盈的预设价格。 参数设置说明: 【Send_Alert】:这是警报开关,设置成true,如果出现箭头就会自动警报提示;设置成false,则不会警报提示。 【Send_Email】:这是发送邮件的开关,设置成true,如果出现箭头就会发送邮件到你在MT4设置好的邮箱里面;设置成false,则不会发邮件。 【Send_Notification】:这是发送即时消息的开关,设置成true,如果出现箭头就会发送消息到你的移动设备;设置成false,则不会发消息。 更多好用的指标网址: https://www.mql5.com/en/users/zhengqiuyang/seller
FREE

A clean Bollinger Bands indicator with single-color filling designed to reduce chart clutter. What is This Indicator? This is a Bollinger Bands technical indicator designed with visual simplicity in mind. Unlike standard Bollinger Bands implementations that display multiple colored lines and bands, this indicator uses a single-color filled area to represent the trading bands. This approach minimizes visual clutter while maintaining full functionality for technical analysis. How It Works The ind
FREE

This indicator calculates gann support and resistance prices with use gann pyramid formulation and draw them on the chart. And If you want, Indicator can alert you when the current price arrive these pivot levels. Alert Options: Send Mobil Message, Send E-mail, Show Message and Sound Alert Levels: S1, S2, S3, S4, S5, R1, R2, R3, R4, R5 Inputs: GannInputPrice: Input price for gann pyramid formulation. GannInputDigit: How many digit do you want to use for calculation formula. (The number and the
FREE

Sessions are very important in trading and often good area where to look for setup. In SMC, ICT we will look for Asian session to serve as liquidity
This indicator displays: High & Low of the Asia session Midnight New York time opening line
Congifuration Line Style, color Label position, size, color Start of the level (Start of the day, Start of the session, Highest or Lowest point in the session)
Any questions or comments, send me a direct message here https://www.mql5.com/en/users/mvonline
FREE
VWAP 机器学习波段: 交易者的预测优势 使用 VWAP 机器学习波段,解锁市场分析的下一个层次——一款创新的 MQL5 指标,旨在提供对市场趋势、动态支撑/阻力以及高概率交易信号的无与伦比的洞察力。 该指标利用专有的自适应机器学习算法与成交量加权平均价格 (VWAP) 的强大功能相结合,超越了传统分析。它旨在为您提供真正的预测优势,帮助您在价格走势完全展开之前预测其动向并抓住市场机会。 为什么 VWAP 机器学习波段将成为您的首选指标: 智能自适应 ML-VWAP 核心: 体验真正动态的 VWAP 计算。我们独特的机器学习方法会根据实时波动性和市场状况自动调整其平滑度,提供比标准 VWAP 更灵敏、更准确的趋势表示。 专有预测引擎: 使用“预测”参数获得预见性。这项尖端功能将 ML 平滑的 VWAP 向前投影,让您能够强大地洞察潜在的未来价格路径,并帮助您为即将到来的市场变化做好准备。 波动率优化波段调整: 使用“Sigma”参数微调指标的灵敏度。精确控制波动率如何影响 ML 平滑和波段扩展,确保指标完美适应任何市场环境——从平静的盘整到爆发性趋势。 多层动态标准差波段: 精确识别

Volumized Breaker Blocks MTF Supreme Volumized Breaker Blocks MTF Supreme is a powerful and user-friendly multi-timeframe (MTF) indicator that automatically detects and visualizes Order Blocks (OB) and Breaker Blocks (BB) on your chart. This advanced tool is designed for both beginners and professional traders who want a clean, fast, and insightful way to identify key market levels with volume context. Key Features Multi-Timeframe Support : Instantly plot OB/BB zones from up to three customizab
FREE

Modern Spike Indicator Features:
1. Support and Resistance Lines: Displays dynamic horizontal dashed lines on the chart representing current support and resistance levels calculated from recent price swings.
2. Spike Detection Arrows: Shows up arrows (green) for potential upward spikes and down arrows (red) for potential downward spikes, triggered when price breaks S/R levels with RSI confirmation.
3. Trend Analysis: Incorporates ADX (Average Directional Index) to determine market trend stre

Precision Arrows – 内置止盈止损的智能交易信号 Precision Arrows 是一款功能强大的交易指标,专为追求 精准、清晰与稳定 的交易者设计。它能够识别高概率的买入和卖出信号,并自动生成 止盈(Take Profit) 和 止损(Stop Loss) 水平,帮助您在 外汇、指数、加密货币及合成指数 市场中实现纪律化、持续性的交易表现。 该指标结合了精准信号识别、智能过滤算法以及多周期趋势面板,为交易者提供一套适用于任何市场环境的完整交易解决方案。 限时优惠 Precision Arrows 指标现仅售 75 美元,终身使用 (原价 199.99 美元 )
(优惠已延长) 重要提示: 购买后请立即与我联系,以获取 使用说明与特别赠品 。 主要功能特点 三种交易模式
根据您的交易风格选择 Scalping(剥头皮) 、 Intermediate(中期) 或 Swing(波段) 模式。每种模式都会自动调整信号灵敏度与风险参数,以适应不同的市场波动情况。 内置止盈与止损
每个信号都附带预设的 TP 和 SL 水平,基于波动率与市场结构自动计算,确保稳定的交易管理并
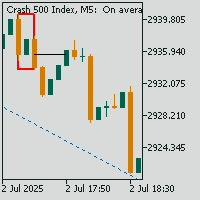
Crash Spike Mitigation Zone Pro
A professional spike pattern indicator built for synthetic traders who scalp and swing Crash 500/300/1000 with precision.
This indicator: Detects powerful 3-candle spike formations (Spike → Pullback → Spike) Automatically draws a clean box around the pattern Marks the entry price from the middle candle Extends a horizontal mitigation line to guide perfect sniper entries Automatically deletes & redraws the line once price touches it (mitigation)
FREE

Overview EMA Scalper is a technical indicator designed for the MetaTrader 5 platform. This tool helps traders identify potential trading signals based on the crossover between price and an Exponential Moving Average (EMA), combined with a dynamic price channel. The indicator is suitable for scalpers or day traders and works across various timeframes and financial instruments. How It Works The indicator's logic is based on two main components: EMA Crossover: The core signal is generated when the
FREE

這是最終的RVI指標。 添加警報箭頭 他可以確定潛在的阻力水平 額外的2個過濾器,以提高讀數 另外平滑以顯示良好的效果 它被配置為從m1到m30的短時間範圍 也不會很糟糕 我建議使用此指示器和屏幕截圖macd中的其他過濾器 這是最終的RVI指標。 添加警報箭頭 他可以確定潛在的阻力水平 額外的2個過濾器,以提高讀數 另外平滑以顯示良好的效果 它被配置為從m1到m30的短時間範圍 也不會很糟糕 我建議使用此指示器和屏幕截圖macd中的其他過濾器 這是最終的RVI指標。 添加警報箭頭 他可以確定潛在的阻力水平 額外的2個過濾器,以提高讀數 另外平滑以顯示良好的效果 它被配置為從m1到m30的短時間範圍 也不會很糟糕 我建議使用此指示器和屏幕截圖macd中的其他過濾器
FREE

中文说明(MT5) 暗影轨道专业版 – MT5 高级均值回归系统 本 MT5 版本针对 MT5 的 64 位多线程架构 做了优化,计算更流畅、回测更方便、可选周期更丰富。
依旧保持「收盘不重绘」的特点,并在此基础上加入实体突破逻辑、动态轨道算法和更严格的统计评估模式。 核心功能 针对 MT5 优化:计算更快、适合多品种、多周期同时运行 收盘不重绘:信号在 K 线收盘后锁定,便于回测与策略复盘 动态三层轨道:基于均线 + ATR 波动率构建上轨 / 中轨 / 下轨 买卖箭头 + 冷却机制:避免短时间内密集信号干扰判断 自动绘制 TP/SL 盈亏线:TP1–TP3、SL1–SL3,多层级风险收益结构一目了然 严格模式统计面板:统计胜率、盈利信号数、亏损信号数,用「数据」说话 图表皮肤选项:一键切换红涨绿跌样式,提升整体可读性 全参数可调:轨道周期、宽度系数、ATR 周期、价格类型、均线算法、TP/SL 启用开关等 完整中英双语界面,方便不同语言交易者使用 使用思路 将指标加载到 MT5,选择语言(English / 中文),设定轨道周期、ATR 周期及 TP/SL 倍数。 在趋势尾部或极端
FREE
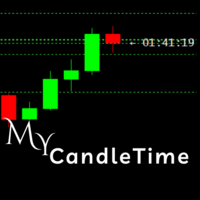
My CandleTime
This indicator displays the remaining time until the current candle closes directly on the chart.
It is designed to help traders keep track of candle formation without constantly checking the platform’s status bar. Main Features Shows countdown timer for the active candle. Works on any symbol and timeframe. Lightweight, does not overload the terminal. Adjustable font size and name. How to Use
Simply attach the indicator to a chart.
You can customize font size, color, and font to
FREE
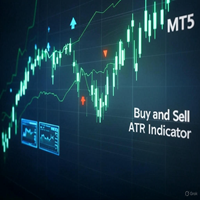
Buy and Sell ATR Indicator The Buy and Sell ATR Indicator is a powerful trend-following tool for MT5, combining ATR-based trend detection with RSI confirmation. It plots a dynamic trend line and generates clear buy (blue arrows) and sell (red arrows) signals when price action confirms a trend over a user-defined number of candles. A unique flat market filter, based on average ATR, prevents signals in low-volatility conditions. Customize ATR periods, RSI levels, signal thresholds, and arrow styl
FREE
Accurate Buy Sell System is a clean and reliable swing-based indicator designed to identify trend reversals and entry zones with high precision. The algorithm follows the original “Accurate Swing Trading System” concept from TradingView (by ceyhun) and has been fully re-engineered for MetaTrader 5. 1:1 match with TradingView behavior
Works on all symbols and timeframes
Clean non-repainting signals when used after candle close
Visual BUY/SELL arrows + colored dynamic trendline
Popup al
FREE
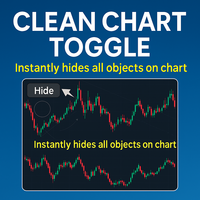
清晰图表切换 是一个用户友好的指标,专为提升 MetaTrader 5 (MT5) 图表体验而设计,通过简单的方式管理图表上指标和对象的可见性。只需位于图表窗口左上角的单个按钮,用户即可立即隐藏或显示所有指标和绘图对象,减少杂乱,提升对价格走势或特定分析需求的专注。 主要功能 一键切换按钮:位于 MT5 图表窗口左上角的按钮,允许用户通过一次点击快速隐藏或显示所有指标和绘图对象。 可自定义可见性:在显示所有指标和对象或清除图表以获得简洁视图之间切换,非常适合专注于原始价格数据。 无缝 MT5 集成:完全兼容 MetaTrader 5,确保在平台内轻松设置和流畅性能。 用户友好设计:直观的界面,最小化设置,适合所有经验水平的交易者。 性能优化:轻量高效,确保不影响 MT5 图表性能或平台速度。 优势 提升图表清晰度:快速整理 MT5 图表,专注于关键价格走势,避免多个指标或绘图的干扰。 节省时间:无需手动隐藏或显示单个指标,简化 MT5 中的工作流程。 改善决策:清晰的图表视图帮助交易者专注于关键价格走势,提升分析和交易决策。 多用途使用:适合使用 MT5 的短线交易者、日内交易者和长期
FREE

Ignition Candle Guard is a visual indicator for MetaTrader 5 designed to identify candles with excessive movement relative to the ATR. The indicator highlights candles whose range (High–Low) exceeds a configurable ATR multiple, helping traders avoid late entries after overextended price movements. This indicator does not generate buy or sell signals , does not repaint , and does not execute automated trades .
It works as a visual risk filter and can be used with any strategy, asset, or timeframe
FREE

If you love this indicator, please leave a positive rating and comment, it will be a source of motivation to help me create more products <3 How to use QQE? Determine trend when RSI MA above 50 indicate a bullish market, while RSI MA below 50 indicate a bearish market and can server as a trend filter. Identify short-term up/down momentum, when the RSI MA crosses up Smoothed signals bullish momentum, and when the RSI MA crosses down Smoothed signals bearish momentum. It is also possible to
FREE
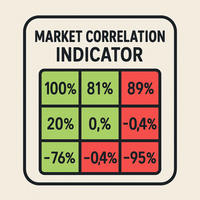
总体描述
该指标实时计算多个金融工具之间的皮尔逊相关系数。它显示一个动态相关性矩阵,用于展示货币、指数、股票和大宗商品之间关系的强度和方向。 主要参数 SymbolsList : 需要比较的工具列表(用逗号分隔) BarsToAnalyze : 用于计算的历史K线数量 TimeFrame : 相关性分析的时间周期 相关性解释 接近 +1.00 的值表示强正相关 接近 -1.00 的值表示强负相关 接近 0.00 的值表示弱相关或无相关 交易优势 监控持仓之间的相关性以降低过度暴露风险 识别投资组合中的多样化机会 支持对冲和套利策略 通过跨市场分析验证交易信号 重要提示
该指标适用于交易终端中的所有金融工具,支持日内、日线及更高级别的时间周期。内置的颜色编码系统可帮助快速识别强相关、弱相关和负相关。 关键词
mt5相关性指标, 外汇相关性, 相关性矩阵, 跨市场分析, 货币对相关性, 市场相关性, 多资产交易, 风险管理, 投资组合多样化, 外汇对冲, 套利交易, 指数相关性, 股票相关性, 大宗商品相关性, 负相关性, 正相关性, 皮尔逊系数, 金融工具相关性, 交易相关性分析
FREE

This indicator shows colored candles when price are strongly distorted in relation to their averages.
A good time for buy can be seen after the closing of a silver candle. The pattern becomes more reliable if the purchase is opened when the price of the candle after the silver candle is above the maximum price of the silver candle.
A good time for sell can be seen after the closing of a pink candle. The pattern becomes more reliable if the sale is opened when the price of the candle after
FREE
您知道为什么MetaTrader市场是出售交易策略和技术指标的最佳场所吗?不需要广告或软件保护,没有支付的麻烦。一切都在MetaTrader市场提供。
您错过了交易机会:
- 免费交易应用程序
- 8,000+信号可供复制
- 探索金融市场的经济新闻
注册
登录