Conheça o Mercado MQL5 no YouTube, assista aos vídeos tutoriais
Como comprar um robô de negociação ou indicador?
Execute seu EA na
hospedagem virtual
hospedagem virtual
Teste indicadores/robôs de negociação antes de comprá-los
Quer ganhar dinheiro no Mercado?
Como apresentar um produto para o consumidor final?
Indicadores Técnicos para MetaTrader 5 - 18

This is one of the most popular and highly rated volatility index (VIX) indicators on the market. It provides the same readings as the VIX does for stock indexes. However, this indicator works across all asset classes. VIX Fix Finds Market Bottoms. This indicator is not for inexperienced traders. Use it for day and swing trading. MT4 Version - https://www.mql5.com/en/market/product/112238 Join To Learn Market Depth - https://www.mql5.com/en/channels/suvashishfx
Bernard Baruch summe
FREE

** All Symbols x All Timeframes scan just by pressing scanner button ** Discount: The price is $50$, But now it is just $39, Limited time offer is active.
*** Contact me to send you instruction and add you in "Trend Reversal group" for sharing or seeing experiences with other users. Introduction: Trendlines are the most famous technical analysis in trading . Trendlines continually form on the charts of markets across all the different timeframes providing huge opportunities for traders

MT5 Version : Pre Note : The indicator uses the Open price value for calculations.
This indicator represents a genuine momentum oscillator according to the true definition of "Momentum", and as realised by the techniques of digital filters. Scholarly papers on the subject by the current developer can be found here and here , but in this description we shall borrow only the minimum of conceptual and mathematical framework needed. In the process, we expose some long-held myths about indica
FREE

SETTINGS Make sure to select Chart shift option in the chart.
(Right click in the chart ---> Properties (dialog box) ----> Select Chart Shift)
Kindly rate and comment about the product for upgradation & Support
When using candlestick timers, keep in mind that the timing of candlestick patterns can play a crucial role in your trading strategy. For instance, different timeframes (such as 1-minute, 5-minute, hourly, ) can provide varying insights into price movements and trends. Make sure to i
FREE

O Solarwind No Repaint é um oscilador técnico que aplica a Transformação de Fisher aos dados de preços normalizados, criando um indicador baseado em histograma que identifica potenciais pontos de virada do mercado. Este indicador converte movimentos de preços em uma distribuição normal gaussiana, tornando padrões cíclicos e mudanças de momentum mais visíveis para os traders. Como Funciona O indicador processa dados de preços através de várias etapas computacionais: Análise Alto-Baixo : Calcula a
FREE

Bem-vindo ao RSI Colored Candles, um indicador inovador projetado para aprimorar sua experiência de negociação integrando o Índice de Força Relativa (RSI) diretamente em seu gráfico de preços! Ao contrário dos indicadores RSI tradicionais, o RSI Colored Candles utiliza um esquema de quatro cores para representar os níveis de RSI diretamente em suas velas, fornecendo insights valiosos com apenas um olhar! Características e Benefícios: Design Economizador de Espaço: Adeus às janelas de indicadores
FREE
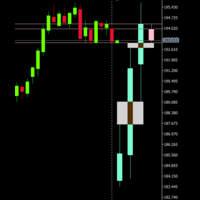
If you like this product, please give it a 5 star rating as a token of appreciation. This indicator projects Higher-Timeframe (HTF) candles onto the current chart and optionally shows their OHLC lines and Fair Value Gaps (FVGs) using ICT 3-candle logic.
Projects multiple higher timeframe candles.
Accurately preserves HTF OHLC on any lower timeframe.
Allows spacing adjustment between projected candles.
Optionally displays OHLC horizontal reference lines.
Automatically detects and draws HTF Fair
FREE

Indicador único que implementa uma abordagem profissional e quantitativa para significar negociação de reversão. Ele capitaliza o fato de que o preço desvia e retorna à média de maneira previsível e mensurável, o que permite regras claras de entrada e saída que superam amplamente as estratégias de negociação não quantitativas. [ Installation Guide | Update Guide | Troubleshooting | FAQ | All Products ]
Sinais de negociação claros Incrivelmente fácil de negociar Cores e tamanhos personalizáveis

No Wick Candles is a powerful price action indicator that identifies candles with no upper or lower wick (also known as Marubozu candles ) and automatically draws horizontal compensation lines from their open price with a "Compensation" label . These wickless candles represent strong momentum and are often used by professional traders as key support/resistance zones . The indicator helps you visualize potential reversal or continuation zones instantly. Key Features Detects Bullish (no lower wick
FREE

ICT Silver Bullet
If you are searching for a reliable indicator to trade the ICT Silver Bullet concept, or ICT concepts, Smart Money Concepts, or SMC, this indicator will respond to your need! Before version 2.2, this indicator was focused only on ICT Silver Bullet, but moving forward, we will include the different elements for smart money concept trading. This indicator will help you identify the following: FVG - fair value gaps Market structure: BOS and CHOCH. It is based on swing high and l

Profissional de entrada de tendência premium
TZ Trade Logics, apresenta a você a versão aprimorada da entrada de tendência Premium
Este lançamento traz a você um estado de negociação muito mais relaxado com recursos avançados para filtragem de tendências e tempos de entrada de sinais premium.
Para nós, não é a criação do produto que importa! mas continuada manutenção e educação aos usuários. por meio de nossos meios dedicados de chegar até nós, você terá um guia detalhado sobre como usar o p
FREE

This indicator draws price channels. Easy to use. It has various settings, for example, you can configure it to show channels only for buy or sell, you can display trend lines instead of channels. There are many trading strategies that are based on trading in channels, you can trade on the rebound from the borders of the channels, or the breakdown of the channel. Parameters History - the maximum number of bars for building channels; Distance - the minimum distance from one maximum (or minimum

Introduction to Fractal Pattern Scanner Fractal Indicator refers to the technical indicator that makes use of the fractal geometry found in the financial market. Fractal Pattern Scanner is the advanced Fractal Indicator that brings the latest trading technology after the extensive research and development work in the fractal geometry in the financial market. The most important feature in Fractal Pattern Scanner is the ability to measure the turning point probability as well as the trend probabil

Structure Blocks: a structured way to analyze market structure
This indicator is for you if you are a price action or smart money concept trader. It identifies market trends' ultimate highs and lows and intermediaries' swing lows and highs. It adjusts based on candles' body where most of the volume is, disregarding wicks. Need help or have questions? I am Lio , don't hesitate to reach out! I am always available to respond, help, and improve. How it works:
Each block consists of a move with
FREE

This is a Market Depth (DOM - Depth of Market) Indicator for MetaTrader 5 that displays real-time order book data in a visual ladder format. The DOM provides a comprehensive view of market depth with clear visual cues for volume imbalances, making it useful for both scalping and swing trading decisions This indicator provides traders with a professional-grade market depth visualization that can be customized to match individual trading preferences and strategies. You can easily switch betwe
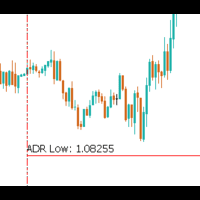
The Average Daily Range (ADR) is a powerful tool for traders, especially those focused on intraday and scalping strategies. It provides valuable insights into the expected price movement for the day and how price action is behaving relative to historical trends. The ADR indicator shows the following key information: Today's ADR : The typical range of price movement for the current trading day, based on historical data. 3x Today's ADR : Three times the current ADR, showing potential price moveme
FREE

Este indicador pode enviar alertas quando ocorre uma mudança de cor Heiken Ashi Smoothed. Combinado com suas próprias regras e técnicas, este indicador permitirá que você crie (ou aprimore) seu próprio sistema poderoso. Recursos Pode enviar todos os tipos de alertas. Opção de atrasar o alerta em uma ou mais barras para confirmar a mudança de cor (tendência). Parâmetros de entrada Mudança de vela para alerta: o padrão é 1. Configurá-lo para 0 irá alertá-lo sobre a mudança de cor na vela atual. Is
FREE

Desenvolvimento da versão anterior do indicador ZigZag WaveSize MT4 ZigZag WaveSize - indicador padrão ZigZag modificado com informações adicionais sobre o comprimento da onda em pontos, níveis e diferentes lógicas de alerta
Melhorias gerais: Adaptação do código para MetaTrader 5 Otimizada a operação com objetos gráficos Novidades: Níveis horizontais nos extremos Seleção do tipo de níveis: horizontal/raios/segmentos Filtro de níveis líquidos (não quebrados pelo preço) Buffer para rupturas: aju
FREE

HiLo Activator é um indicador de análise técnica desenvolvido por Robert Krausz, um renomado trader húngaro que faz carreira nos EUA.
Ele é um indicador de tendência que ajuda você a prever a mudança da tendência atual. Em uma tendência de alta ele é exibido na parte inferior das velas; já numa tendência de baixa ele é exibido na parte superior.
Sua única configuração é o período de cálculo.
É possível ter alertas quando uma nova tendência começa a se formar. Faça bom uso! Este é um indicador gr
FREE
FiboPivot TrendLines - Comprehensive Market Analysis Indicator
This powerful indicator combines Fibonacci pivot point analysis with automatic trend line detection, providing traders with a complete technical analysis toolkit in a single tool.
Key Features : - Fibonacci Pivot Points: Automatically calculates and displays R1-R3, Pivot, and S1-S3 levels using previous day's data - Fractal-Based Trend Lines: Automatically draws channel trend lines based on fractal patterns - Interactive
FREE

This indicator was created based on posts from forex factory thread titled There is no Magic Moving Average - You need only one - by @andose2 a.k.a Andrei Florin. If you want to know about how to use this trading strategy please go and read https://www.forexfactory.com/thread/691864-there-is-no-magic-moving-average-you.
Note: Below are extracts some of the posts .
Estabilish a trend, based on Market Cycles, then go only long in the Markup Phase and only short in the Decline phase , st
FREE

The "Rejection Block" MetaTrader 5 Indicator offers traders a comprehensive tool for identifying and visualizing rejection candlestick patterns, commonly known as rejection blocks. These patterns are pivotal in discerning potential market reversals or continuations, making them invaluable for traders seeking to enhance their analysis. Key Features: Rejection Block Detection: The indicator diligently scans price data, pinpointing instances of rejection candlestick patterns. These patterns typical
FREE

Koala Trend Line atualizado para a versão 1.2
Última atualização de melhoria: Novo parâmetro adicionado que permite ao usuário conectar a linha de tendência ao 2º, 3º ou Xº ponto mais alto ou mais baixo.
Meu pedido :
** Prezados clientes, por favor, liberem sua avaliação sobre a linha de tendência Koala e deixe-me melhorar com seus comentários.
POR QUE O KOALA TREND LINE É INDICADOR GRÁTIS?
Acredito que o indicador livre deve ser uma ferramenta qualificada.
E OS OUTROS PRODUTOS GRATUITOS?
FREE

O indicador exibe gráficos minimizados de qualquer símbolo em qualquer período de tempo. O número máximo de gráficos exibidos é 28. Os gráficos podem ser localizados na janela principal e inferior. Dois modos de exibição: velas e barras. A quantidade de dados exibidos (barras e velas) e os tamanhos dos gráficos são ajustáveis. Para trabalhar com um minigráfico, você deve primeiro colocar o (s) indicador (es) desejado (s) em um gráfico regular, depois salvá-lo como um modelo e aplicar um modelo p
FREE

# DAILY SUPPORT AND RESISTANCE LEVELS - SEO OPTIMIZED DESCRIPTION
## SHORT DESCRIPTION (160 characters max)
```
Free pivot points indicator with daily support resistance levels for MT5. Perfect for intraday forex day trading and scalping strategies.
```
**Character count:** 159
**Keywords included:** pivot points, support, resistance, MT5, forex, day trading, scalping, free
---
## FULL DESCRIPTION (HTML Formatted for MQL5)
### Main Title
**Daily Support and Resistance Levels - Free Pivot
FREE

Farto de ficar na dúvida sobre as suas entradas? O Sniper Entry Signal é um sistema de trading profissional desenvolvido para resolver um problema específico: o timing.
Ao contrário dos indicadores padrão que apresentam atraso ou repintam, esta ferramenta utiliza um sofisticado "Mecanismo de Consenso de 3 Timeframes". Analisa os timeframes M1, M5 e M15 simultaneamente. Um sinal é gerado APENAS quando os três timeframes concordam com a direção da tendência.
O resultado? Filtra o ruído do merca
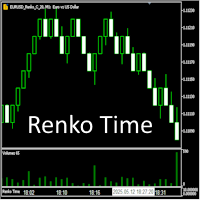
Индикатор предназначен для работы с ренко-графиками, построенными Renko Maker PRO или Renko Maker DEMO . Особенность реализации ренко-баров в терминале MetaTrader 5 такова, что из-за их вневременной природы (формирование новых баров зависит исключительно от изменения цены, а не от временных интервалов), время открытия каждого ренко-бара в истории оказывается искусственно сдвинутым в прошлое. Поэтому, чтобы видеть время открытия ренко баров, нужно воспользоваться этим индикатором Renko Time.
FREE
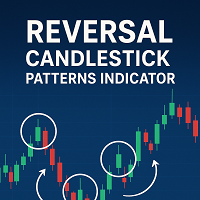
Reversal Candlestick Patterns Indicator — Free Version This MT5 indicator identifies common bullish and bearish candlestick reversal patterns and displays them directly on the chart.
It can be used on any market and timeframe, providing traders with clear visual references for potential reversal points. Main Features Automatic detection of well-known candlestick reversal patterns Works on all available MT5 timeframes Can be applied to Forex, Stocks, Commodities, Indices, and Cryptocurrency char
FREE
DRX SPREAD MONITOR é um utilitário profissional projetado para visualizar e analisar os spreads da corretora em tempo real. Ele ajuda os traders a identificar custos ocultos causados pelo aumento do spread durante eventos de notícias, rollovers ou sessões de baixa liquidez. Esta ferramenta é essencial para Scalpers e traders de Ouro que precisam garantir a qualidade da execução e evitar entrar em negociações quando os custos são estatisticamente muito altos. Principais Recursos Histograma em Tem
FREE

TRUE BIAS Know Where The Market Wants To Go See market direction across 6 timeframes at once. A professional dashboard displaying real-time bias analysis (M1, M5, M15, H1, H4, D1) with confidence levels, actionable trading signals, and smart control point detection. What It Does: Shows market direction for each timeframe with confidence % - Green = Buy, Red = Sell, Gray = Wait Provides clear trading actions: STRONG BUY, BUY, SELL, STRONG SELL, LONG SWING, SHORT SWING Automatically detects key su
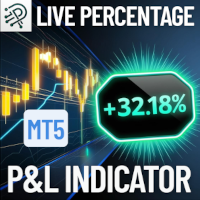
Quickly monitor your floating profit or loss as a percentage of your account balance live and always visible right on your chart! Key Features: Real-Time Calculation: Instantly calculates the combined floating profit or loss from all open trades as a percentage of your current account balance. Easy On-Chart Display: The result is conveniently shown as a label in the lower-right corner of your chart no distractions, always visible. Clear Color Coding: Green for profit, red for loss for immediate
FREE

The Turtle Trading Indicator implements the original Dennis Richards and Bill Eckhart trading system, commonly known as The Turtle Trader. This trend following system relies on breakouts of historical highs and lows to take and close trades: it is the complete opposite to the "buy low and sell high" approach. The main rule is "Trade an N-day breakout and take profits when an M-day high or low is breached (N must me above M)". [ Installation Guide | Update Guide | Troubleshooting | FAQ | All Pr
FREE

Hi-Lo é um indicador cuja finalidade é auxiliar de maneira mais precisa as tendências de um determinado ativo — indicando assim, o possível melhor momento para compra ou venda. O que é o Hi-lo? Hi-Lo é um termo derivado do inglês, onde Hi está ligado à palavra High (Alto) e Lo à palavra Low (baixo). Ele é um indicador de tendência usado para avaliação da negociação de ativos no mercado financeiro. Sendo assim, a sua utilização é dada para identificar se um determinado ativo está apresentando u
FREE

GEN Sessions Volume Profile Developer: Gede Egi GEN Sessions Volume Profile is an MT5 indicator designed to display the volume distribution for each trading session (daily) in the form of a Volume Profile . With this tool, traders can easily see at which price levels the highest trading activity has occurred during a session, making it easier to identify key market areas. The indicator automatically plots Session Boxes, Point of Control (POC), Value Area High (VAH), Value Area Low (VAL), and Va
FREE

O principal objetivo do indicador é determinar e marcar sinais de negociação no histograma do Accelerator Oscillator, que foram descritos por Bill Williams em seu livro "New Trading Dimensions". A lista de sinais: O sinal de compra quando o histograma do indicador está abaixo da linha zero. O sinal de venda quando o histograma do indicador está abaixo da linha zero. O sinal de venda quando o histograma do indicador está acima da linha de zero. O sinal de compra quando o histograma do indicador e
FREE

FVG Smart Zones – Edição Gratuita Indicador de Detecção de Gap de Valor Justo para MetaTrader 5 (MT5) Está procurando uma ferramenta de trading real – não apenas mais um indicador qualquer?
FVG Smart Zones – Edição Gratuita oferece uma visão profissional do mercado detectando automaticamente Gaps de Valor Justo (FVG) e destacando zonas de trading de alta probabilidade diretamente no seu gráfico. Criado para traders que seguem:
Conceitos de Smart Money (SMC)
Conceitos de Trading ICT
FREE

Calendário de contagem regressiva de notícias da Phoenix (MT5)
Painel de contagem regressiva de notícias económicas em tempo real para MetaTrader 5. Exibe os próximos eventos de alto impacto com temporizadores de contagem regressiva precisos para ajudar os traders a gerir o risco em torno dos picos de volatilidade.
Objetivo
Os comunicados de notícias económicas criam volatilidade, slippage e drawdown inesperados. Negociar cegamente em eventos de alto impacto pode invalidar instantaneamente as
FREE

The HighLow Alarm indicator automatically displays the High and Low values of the previous trading day on your chart. This tool helps you visually assess key daily levels, from which the price often bounces or which it breaks, and it works on any timeframe. How It Works The indicator accesses the daily timeframe (D1) data and, for each bar on the current chart, calculates the High and Low of the previous daily session. The result is displayed as two horizontal lines: Green line — The High leve
FREE

KC Multi-TF Unicorn Hunter is a professional Multi-Currency & Multi-Timeframe Dashboard designed to scan the entire market from a single chart. Stop wasting hours switching between 20 different charts. This indicator monitors your favorite pairs (Forex, Gold, Indices, Crypto) across 3 distinct timeframes simultaneously and alerts you only when a high-probability "Unicorn" setup occurs. What is a "Unicorn" Setup? Ordinary indicators generate too many false signals. A "Unicorn" setup is a rare, hi
FREE

Description of the Harmonic Patterns + Fib Indicator
The Harmonic Patterns + Fib indicator is a technical analysis tool designed for MetaTrader 5 (MT5). It automatically detects and visualizes harmonic price patterns on financial charts, leveraging Fibonacci ratios to identify potential reversal points in markets such as forex, stocks, cryptocurrencies, and commodities. The indicator scans for classic harmonic formations like Butterfly, Bat, Crab, Shark, Gartley, and ABCD, drawing them with lin
FREE
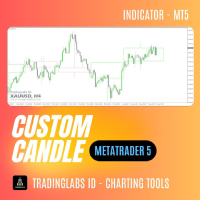
Custom Candle – Multi-Timeframe Visualization Analyzing multiple timeframes is essential for accurate trading decisions, but switching between charts can be inconvenient and inefficient. The Custom Candle indicator solves this problem by overlaying higher-timeframe (HTF) candles directly onto your lower-timeframe (LTF) chart. This allows you to see the bigger picture at a glance, align with the higher trend, and improve trade accuracy—without leaving your current chart. Key Features Multi-Timefr
FREE

Este indicador desenha uma linha na máxima e mínima de um número X de dias. É possível ter um alerta (no software e app) para quando o preço romper a máxima ou mínima do dia atual. Configurações: Days - dias passados para calcular (1 = somente dia atual)
Alert when reach levels - ativa o alerta para níveis específicos ou ambos.
Push notification - habilita os alertas para o aplicativo móvel do MT5.
Aparência
High - cor do nível superior.
Low - cor do nível inferior.
Size actual day - espessura
FREE

The indicator synchronizes eight types of markings on several charts of one trading instrument.
This indicator is convenient to use in conjunction with "Multichart Dashboard" or other similar assistant that allows you to work with several charts at the same time.
"Multichart Dashboard" can be found under the link on my youtube channel.
Settings:
enable vertical line synchronization
enable horizontal line synchronization
enable Trend Line synchronization
enabling Fibonacci Retracement synchron
FREE

If you like to use traditional Moving Averages (like SMAs and EMAs) to provide your trades for dynamic levels of Support and Resistance, you will love the Adaptive Moving Average (AMA). Created in 1995 by Perry Kaufman and presented to the world in his book " Smarter Trading : Improving Performance in Changing Markets ", the Adaptive Moving Average (also known as KAMA - Kaufman Adaptive Moving Average) has the goal to be the perfect companion for following a trend without noise, but s
FREE
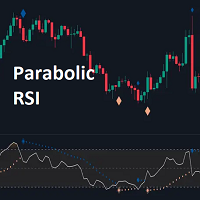
The Parabolic RSI indicator applies the Parabolic SAR directly to the Relative Strength Index (RSI) . This combination helps traders identify trend shifts and potential reversal points within the RSI framework. The indicator provides both regular and strong signals based on whether the Parabolic SAR crosses above or below key RSI thresholds.
KEY FEATURES
Parabolic SAR Applied to RSI – Tracks momentum shifts within the RSI indicator.
Dynamic SAR Dots – Plots SAR levels

Este indicador colocar Fibonacci nas pernas do indicador zigzag
Parâmetros:
ZigZag Show Depth Deviation Backstep Fibonacci Show Invertido (trabalhar com o fibonacci invertido) niveis (separe as porcentagens com ",") cor estilo largura da linha usar raio o parâmetro níveis (levels) pode ser modificador com qualquer valor de porcentagem, e os valores podem ser separados por virgula Se você se interessar por esse indicador deixe um comentário para eu continuar melhorando ele
FREE

Please check the " What's new " tab regularly for a complete and up-to-date list of all improvements + parameters. FREE indicator for my trading utility Take a Break . This indicator allows you to manage multiple other EAs with just one Take a Break EA instance. Simply specify the corresponding Chart Group in the indicator(s) and Take a Break EA settings and you are good to go.
Setup examples (Indicator + EA)
As a prerequisite, add the URL https:// trading.custom-solutions.it to the list of a
FREE
Entry Point M5 — a complete trading system. Entry Point M5 is a powerful indicator designed as a fully functional trading system suitable for any currency pair. It analyzes the price structure, identifying key moments of market reversals and the emergence of new impulses. The indicator can adapt to different market phases — from strong trending movements to sideways ranges — providing visually clear signals without the need for additional filters or auxiliary tools. Trading with this system is e

[ZhiBiDW Trend] é um indicador simples, intuitivo e eficaz de tendências e choques. É adequado para períodos de gráfico de mais de 15 minutos e menos de 4 horas, adequado para todas as variedades do mercado.
Sinal de compra: aparece uma seta azul para cima, a seta aparecerá com um preço predefinido para Stop Loss e Take Profit.
Sell signal: Uma seta vermelha para baixo aparece, a seta aparecerá com um preço pré-definido para Stop Loss e Take Profit.
Descrição da configuração de parâmetros:
[
FREE

Take full control of the market rhythm! The OHLC & Sessions Indicator is a precision analysis tool for MetaTrader 5, specifically designed to make the most important price levels and trading hours visible at a glance. Instead of cluttering the chart with messy lines, this indicator provides a clean, highly professional visualization of daily price action and global trading sessions. Why this Indicator? Real-Time Precision: Instantly identify the Daily High and Low as well as the exact start of t
FREE

Capital Vault System is a professional technical analysis suite for MetaTrader 5 engineered to identify market structure and adaptively filter market volatility. Unlike static indicators, this system integrates three mathematical models— Maximum Entropy Spectral Analysis (MESA) , Fractal Dimension , and Harmonic Geometry —to distinguish between directional trends and non-linear consolidation ranges. It includes an embedded Risk Management Dashboard designed to assist traders in real-time positio

Pivot Classic, Woodie, Camarilla, Fibonacci and Demark Floor/Classic Pontos pivô, ou simplesmente pivôs, são úteis para identificar possíveis níveis de suporte/resistência, faixas de negociação, reversões de tendência e sentimento do mercado, examinando os valores alto, baixo e de fechamento de um ativo. Os Pontos Pivot Floor/Classic podem ser calculados da seguinte forma. Pivot Point (P) = (High + Low + Close)/3 S1 = P * 2 - High S2 = P - (High - Low) S3 = Low – 2*(High - P) R1 = P * 2 - Low R2
FREE

O indicador ADX é usado para determinar a tendência e sua força. A direção do preço é mostrada pelos valores +DI e -DI, e o valor ADX mostra a força da tendência. Se +DI estiver acima de -DI, então o mercado está em tendência de alta, se ao contrário, está em tendência de baixa. Se o ADX estiver abaixo de 20, não há uma direção definida. Assim que o indicador ultrapassa este nível, começa uma tendência de força média. Valores acima de 40 indicam uma tendência forte (tendência de baixa ou tendên

TRUE TIMER - Candle Countdown Real-time countdown timer (MM:SS) showing seconds until candle close on any timeframe. Features hint messages that alert you on new candles. Key Features: Precise server-time countdown. Auto color detection (light/dark backgrounds). Smart "New Candle" & timing alerts on huge movements. Works on all timeframes M1 → Monthly. Perfect for: Scalpers & precise entry timing. Please share your experience via Reviews :)
FREE
VWAP (Volume Weighted Average Price) indicator with ±1σ and ±2σ bands calculated from real traded volume. The start and end times of the session are fully configurable, as well as the standard deviation levels and the number of bands displayed. It shows the day’s volume-weighted average price and helps traders identify value areas, price extremes, and intraday trading opportunities with precision.
FREE

Heiken Ashi Dynamic é um indicador para MetaTrader 5 que exibe velas Heiken Ashi diretamente no gráfico. É possível escolher entre o modo clássico ou suavizado, tornando as mudanças de cor mais claras e fáceis de acompanhar. Verde indica movimento de alta, vermelho indica movimento de baixa. O modo Clássico reage rapidamente para ajudar a identificar reversões cedo, enquanto o Suavizado deixa tendências longas mais limpas e contínuas. Os pavios são preservados para manter a forma real do mercad
FREE

Time Range Separator is a useful tool to display a separator period on your platform.
You could go in the properties of the indicator, select the desired range and that's ALL. We believe it is a useful and necessary that we wish to share with you for free all our followers. Input Values: TimeFrame = Period Separator Separator_Color = Vertical Color Line Separator_Style = Vertical Color Style Separator_Width = Vertical Line Width Good trading to all and see you soon. Same indicator for MT4 here
FREE
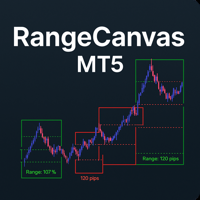
Daily Range Boxes : The indicator draws rectangular boxes around each day's high and low prices, creating a clear visual boundary for the daily trading range. Color-Coded Logic : Green boxes when the current price (or close) is above the daily open Red boxes when the current price is below the daily open Percentage Level Lines : Inside each box, it draws three horizontal lines at: 25% of the daily range 50% of the daily range (midpoint) 75% of the daily range Range Information : Each box displa
FREE

Monitor de Padrões de Velas Phoenix (MT5)
Ferramenta de detecção e monitoramento de padrões de velas em tempo real para MetaTrader 5. Identifica automaticamente padrões clássicos de velas em vários símbolos e exibe estatísticas abrangentes de padrões por meio de um painel visual.
Visão geral
O Monitor de Padrões de Velas Phoenix detecta e rastreia os padrões Doji, Martelo, Estrela Cadente, Engolfamento de Alta, Engolfamento de Baixa, Estrela da Manhã, Estrela da Tarde, Três Soldados Brancos e
FREE

Bem-vindo ao HiperCube Renko Velas Código de desconto de 25% na Darwinex Zero: DWZ2328770MGM Este indicador fornece informações reais do mercado e transforma-o em Renko Candle Style.
Definição Os gráficos Renko são um tipo de gráfico financeiro que mede e traça as variações de preços, utilizando tijolos (ou barras) para representar os movimentos de preços. Ao contrário dos gráficos de velas tradicionais, os gráficos Renko não exibem informações baseadas no tempo, concentrando-se apenas nas flu
FREE

Descrição Geral O Indicador Fair Gap Value identifica e destaca “fair value gaps” no gráfico do MetaTrader 5. Um fair gap ocorre quando há um vazio de preço entre a mínima de uma vela e a máxima de outra, separadas por uma vela intermediária. O indicador desenha retângulos coloridos (de viés altista e baixista) para ressaltar essas áreas, oferecendo suporte visual claro para estratégias de price action. Principais Funcionalidades Detecção de gap altista : realça gaps entre a mínima da vela atual
FREE

Volume Weighted Average Price is used by financial institutions to place large trades at what is considered the fair value for the session. Standard deviation channels around VWAP provide potential entry points for mean reversion or breakout strategies, and the VWAP itself can act as a high quality exit level. If you've heard that volume-based analysis doesn't work for forex and CFDs, try looking at VWAP with standard deviation bands on a chart, and note the frequency with which price reacts to
FREE
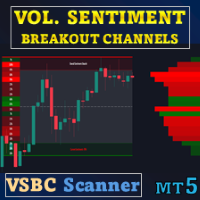
Oferta especial : ALL TOOLS , apenas $35 cada. Novas ferramentas custarão $30 na primeira semana ou para as primeiras 3 compras ! Trading Tools Channel on MQL5 : Junte-se ao meu canal na MQL5 para receber as novidades mais recentes Volume Sentiment Breakout Channels é um indicador que visualiza zonas de rompimento com base no sentimento do volume dentro de canais de preço dinâmicos. Em vez de enxergar o rompimento apenas como um evento técnico de preço, ele foca em como o volume

VWAP Diária — Referência Institucional de Valor Intradiário A VWAP Diária é um indicador profissional baseado no Preço Médio Ponderado pelo Volume (VWAP) , projetado para revelar o verdadeiro equilíbrio entre preço e volume ao longo da sessão de negociação. Diferente de médias móveis tradicionais, a VWAP Diária incorpora o peso do volume em cada negociação, oferecendo uma referência muito mais fiel ao comportamento de traders institucionais e grandes participantes do mercado. O que o indicador e
FREE

This indicator calculates fibonacci levels via moving averages trend and draw these lines. You can change fast and slow Moving Averages settings for customization. Inputs:
Fast MA Time Period : 64 Fast MA Shift: 0 Fast MA Method: Smoothed Fast MA Apply To: Median Price Slow MA Time Period: 32 Slow MA Shift: 0 Slow MA Method: Smoothed Slow MA Apply To: Median Price ZigZag: False ZigZag Color: Red ZigZag Type: DashDot ZigZag Width: VeryThin Fibo Settings TrendFibonacci: True FiboTrendColor: Black
FREE

This indicator is designed to detect high probability reversal patterns: Double Tops/Bottoms with fake breakouts . This is the FREE version of the indicator: https://www.mql5.com/en/market/product/29957 The free version works only on EURUSD and GBPUSD! Double top and bottom patterns are chart patterns that occur when the trading instrument moves in a similar pattern to the letter "W" (double bottom) or "M" (double top). The patterns usually occur at the end of a trend and are used to signal tren
FREE

O indicador analisa o gráfico e identifica os castiçais Doji. Mostra sua aparência e sinaliza a aparência de tal vela (se permitido nos parâmetros). Além disso, este indicador mostra a força da reversão na forma de barras de cores diferentes (quanto mais verde, mais provável é o crescimento, mais vermelho - a queda no preço). A direção do sinal depende da direção das velas anteriores, pois o Doji sinaliza uma reversão ou correção. Nas configurações do indicador, você pode alterar os parâmetros
FREE
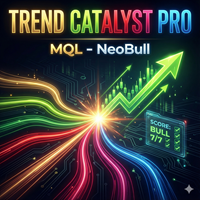
Trend Catalyst Pro Indicador Profissional Multi-Tendência com Confirmação 7 vezes, Alertas Inteligentes, Visão Geral de Notícias e Painel Integrado para MetaTrader 5. O Trend Catalyst Pro combina os sinais de sete indicadores de mercado comprovados em uma única pontuação clara. Em vez de analisar cada indicador individualmente, você obtém um resultado visível na vela do gráfico: Setas e texto como "6/7 LONG" ou "7/7 SHORT" Velas codificadas por cores com base na força do sinal Um painel mostran
FREE

Blahtech Moving Average indicator is a multitimeframe version of the standard Moving Average indicator. It is also enhanced with customisable alerts, period breaks and other configuration options. The 50 day and 200 day moving averages are widely followed by investors and traders, with breaks above and below the MA lines considered to be signals of interest. Links [ Install | Update | Training | All Products ]
Feature Highlights Up to three timeframes Configurable calculation variabl
FREE

Uma ferramenta projetada para oferecer uma visão clara e objetiva do cenário de mercado em tempo real .
Seu painel Multi-Timeframe dinâmico permite acompanhar simultaneamente diferentes períodos gráficos, ajudando o trader a tomar decisões de forma antecipada e estratégica . Descrição da Ferramenta O Brute Force Trend é um indicador avançado, desenvolvido a partir de transformações matemáticas precisas , que proporciona: Análise de Tendência Multi-Timeframe em tempo real Histograma Adaptativo ,
FREE
O Mercado MetaTrader é a única loja onde você pode baixar um robô demonstração de negociação gratuitamente para testes e otimização usando dados históricos.
Leia a visão geral e opiniões de outros clientes sobre os aplicativos, faça o download para o seu terminal e teste um robô de negociação antes de comprá-lo. Apenas no Mercado MetaTrader você pode testar um aplicativo de forma absolutamente gratuita.
Você está perdendo oportunidades de negociação:
- Aplicativos de negociação gratuitos
- 8 000+ sinais para cópia
- Notícias econômicas para análise dos mercados financeiros
Registro
Login
Se você não tem uma conta, por favor registre-se
Para login e uso do site MQL5.com, você deve ativar o uso de cookies.
Ative esta opção no seu navegador, caso contrário você não poderá fazer login.