MetaTrader 4용 기술 지표 - 18
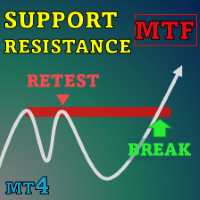
Special offer : ALL TOOLS , just $35 each! New tools will be $30 for the first week or the first 3 purchases ! Trading Tools Channel on MQL5 : Join my MQL5 channel to update the latest news from me 끊임없이 변화하는 금융 거래 환경에서 지원 및 저항 수준을 정확하게 식별하고 분석하는 것은 정보에 입각한 투자 결정을 내리는 데 필수적입니다. SnR Retest and Break Multi-Timeframe , 거래 분석을 향상시키기 위해 설계된 지원 및 저항 지표입니다. 혁신적인 Timeframe Selector 기능을 활용하여 이 도구는 여러 시간대에 걸친 시장 동향에 대한 포괄적인 보기를 제공하고, 정확한 거래 선택을 돕습니다. 더 많은 MT5 버전 보기: SnR Retest and Break MT5

Flat Reminder Overview Flat Reminder is a powerful technical analysis tool that identifies and highlights price consolidation zones on your chart. It detects when price action slows down and moves sideways, indicating potential reversal points, continuation setups, or key decision zones in the market. Key Features Consolidation Detection : Automatically identifies flat price zones where market momentum decreases Range Measurement : Calculates and displays the exact range of each consolidation in
FREE

Unleash Your Trading Edge with TrendSight Pro! Tired of lagging indicators and confusing charts? TrendSight Pro: Signal Paint Engine is the solution you need. This smart indicator cuts through the market noise, giving you clear, high-probability trade signals right on your chart. It's designed to make your trading simpler, faster, and more profitable by combining quick momentum analysis with a powerful long-term trend filter. Key Advantages and Features Crystal-Clear Trade Signals: Forget compl
FREE

표시기는 두 부분으로 구성됩니다. 1부: 색상 양초가 주요 추세를 보여줍니다. 컬러 캔들(Color Candles)은 컬러 캔들스틱으로 시장 상태를 파악하는 것입니다. 스크린샷에서 보듯이, 색상이 아쿠아(Aqua)라면 시장은 매수 주문을 해야 하거나 매도 주문을 종료해야 하는 상태입니다. 색상이 토마토라면 짧은 주문을 하거나 긴 주문을 종료할 때입니다. 색상이 변경되는 경우 완료될 때까지 기다리는 것이 좋습니다(현재 막대가 닫힐 때까지). 파트 II: 밴드 그리기 안쪽 밴드는 안전 구역으로 정의되고, 바깥쪽 밴드는 마감 주문용으로 정의됩니다. 아래와 같은 거래 전략: 색상이 아쿠아이고 가격이 내부 밴드에 있는 경우 장기 주문을 하고, 가격이 외부 밴드를 넘으면 주문을 마감할 시간입니다. 색상이 토마토이고 가격이 안쪽 밴드에 있으면 짧은 주문을 하고, 가격이 바깥쪽 밴드를 넘으면 주문을 마감할 시간입니다. 참고 : 가격이 내부 밴드에 있을 때 진입 시장에만 해당됩니다. 이는 매우

Pipfinite creates unique, high quality and affordable trading tools. Our tools may or may not work for you, so we strongly suggest to try the Demo Version for MT4 first. Please test the indicator prior to purchasing to determine if it works for you. We want your good reviews, so hurry up and test it for free...we hope you will find it useful.
Combo Razor Scalper with Trend Laser Strategy: Scalp in the direction of the trend Watch Video: (Click Here)
Features Scalping indicator using a confirme

All-in-one trading powerhouse: trend, reversal, and exhaustion detection
This indicator is a personal implementation of the famous Traders Dynamic Index, which uses RSI, moving averages and volatility bands to find trends, reversals and price exhaustions. However, this particular implementation supports not only RSI, but many others. It is suitable for scalping, day trading, and swing trading and aims to provide a full picture of the current market conditions. [ Installation Guide | Update Guid
FREE
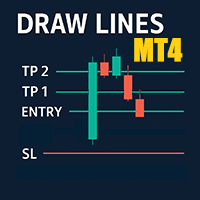
차트에 진입가, 테이크프로핏, 스탑로스를 쉽게 표시하여 트레이딩 신호를 분석하고 추적할 수 있습니다. 주요 기능 진입가, TP1, TP2, TP3, SL 값을 손쉽게 입력 신호 발생 시간을 표시하는 수직선 옵션 각 선에 대한 맞춤 라벨 및 색상 설정 가능 신호의 정확도와 손익비를 시각적으로 평가 모든 심볼 및 모든 시간대에서 사용 가능 리페인팅 없음, 지연 없음 — 선명하고 안정적인 라인 표시 사용 사례 텔레그램, WhatsApp 등에서 받은 신호를 시각화 과거 신호를 분석하고 시장 반응을 학습 커뮤니티나 고객에게 명확한 시그널 세팅 제공 수동 또는 자동 전략과 함께 사용 가능 키워드 신호, 라인 표시, 진입, 테이크프로핏, 스탑로스, 외환, 텔레그램, 시각적 신호, 수동 트레이딩, 신호 분석, TP, SL, 차트, 레벨, 평가, 교육, 인디케이터, 도구
FREE

The indicator is based on the classic CCI indicator. I recommend watching my advisor - Night Zen EA Doesn't redraw its signals. There are alerts for the incoming signal. It contains 2 strategies: Entry of the CCI line into the overbought zone (for buy trades ) / into the oversold zone (for sell trades ) Exit of the CCI line from the overbought area (for sell trades) / from the oversold area (for buy trades)
Settings: Name Setting Description Period Period of the classic CCI indicator Price Ch
FREE

The Simple ICT Concepts Indicator is a powerful tool designed to help traders apply the principles of the Inner Circle Trader (ICT) methodology. This indicator focuses on identifying key zones such as liquidity levels, support and resistance, and market structure, making it an invaluable asset for price action and smart money concept traders. Key Features Market Structure : Market structure labels are constructed from price breaking a prior swing point. This allows a user to determine t
Introduction:
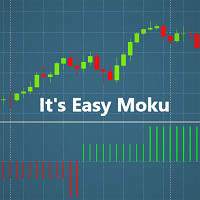
Welcome dear Users, This indicator has been developed in order to help traders who are daily struggling to find a strategy . I have always been acctracted by Ichimoku Strategy, however took me sometime figure out how it does work. Easy Moku makes Ichimoku Simple!
Aspect:
Easy Moku shows 2 principal ICHIMOKU signals: kijun sen/tenken sen sen crossover Span A Span B + Kijun sen/tenken sen Get Rid of all the Ichimoku Lines!
On the Mt4 Chart the Easy Moku paints an Histogram: (
FREE

The Silent Edge of Smart Money
"It's not about how much you do, but how much love you put into what you do that counts." – Mother Teresa
They say the real money in trading is made in the shadows—where inefficiencies hide and only the most perceptive capitalize. That’s exactly where the Arbitrage Thief Index (ATI) thrives. For years, this tool has been my personal advantage , silently identifying low-risk, high-reward trades before the crowd even notices. It’s the kind of edge top fund managers

It would be good to always be aware of the "struggle" between buyers and sellers. Then it would be much easier to determine the best direction to go in order not to lose out. This indicator offers an original solution to this problem: the supply and demand values are compared with the High and Low prices for the selected period, thus trying to determine the market movement towards the stronger side without ignoring the strength of the opposite side. All this is displayed in a separate window usi

**Squeeze Box Indicator** Squeeze Box is a powerful technical analysis indicator developed for the MetaTrader 4 platform, designed to support day trading strategies. This indicator analyzes market movements to detect bullish and bearish breakout signals, enabling traders to capture trends early. With its customizable features and user-friendly interface, it is ideal for both novice and experienced traders.
### Features and Functions - **Bullish and Bearish Signals**: Identifies market break
FREE
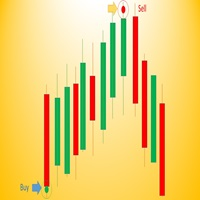
Wave Entry Alerts In Gold is a custom indicator developed by Azad Gorgis for MetaTrader 4. This indicator is designed to provide alerts based on ZigZag patterns, specifically tailored for trading on the Gold (XAU/USD) symbol.
Key Features: - Chart Window Indicator: The indicator is designed to be displayed on the main chart window. - Arrow Signals: The indicator generates arrow signals on the chart, indicating potential reversal points based on ZigZag patterns. - Customizable Parameters: Trade
FREE

SMC 래리 윌리엄스 구조는 유명 트레이더 래리 윌리엄스의 베스트셀러 "단기 거래의 장기적 비밀"에서 사용된 방법을 사용하여 가장 중요한 스윙 포인트를 구축하고 연결하는 가격 차트 구조를 분석하기 위한 지표로, 스마트 머니 개념을 사용하여 시장 구조를 적응시키고 대규모 참가자의 관심 영역을 분석하기 위한 견고한 기반을 마련합니다. 스윙을 구성하는 기본 논리는 간단하고 명확합니다. 연속된 3개의 봉 중 중간 봉이 이웃 봉보다 명확한 고점 또는 저점을 형성하는 로컬 극점을 포착합니다. 래리 윌리엄스 방법의 특징은 빌 윌리엄스의 고전적 프랙탈과 달리 추가 규칙이 있다는 점입니다. 중간 봉이 로컬 고점을 형성한다면(High가 양옆 봉의 High보다 높음), 그 Low도 옆 봉들의 Low보다 높아야 하며, 반대편에 '바닥'이 형성됩니다. 이와 유사하게, 로컬 저점은 중간 봉의 Low가 옆 봉의 Low보다 낮고, High는 옆 봉의 High보다 높아야 합니다. 이 조건은 중요한 스윙을 보다 명

Buy Sell Magic AI – Dynamic Trend Line & Bollinger Bands for MT4 Buy Sell Magic AI is a professional indicator for MetaTrader 4 that combines the power of Bollinger Bands with a dynamic central midline that acts as a real-time trend line . It delivers clear entry signals, visual trend confirmation, and automatic Stop Loss placement—plus a built-in candle timer for precise trade timing. My indicators for free. I only ask that leave your feedback to help me improve them or as a thank you. Have
FREE

Trend Arrow Reaper is a trend-following indicator that provides clear buy and sell signals using arrows. It analyzes price action and identifies potential reversal points, displaying entry signals directly on the chart. Key Features: Arrow Signals: Blue Up Arrow – Buy signal (potential bullish reversal). Red Down Arrow – Sell signal (potential bearish reversal). Reduced False Signals – Advanced filtering to minimize noise. Works on All Timeframes – Suitable for scalping, day trading, a

기관 유동성 압축 지표 (Institutional Liquidity Compression Indicator) 이 지표는 볼린저 밴드의 표준화된 폭, 거래량 및 평균 스프레드를 기반으로 실시간 유동성 축소를 측정하여 가격 돌파 전의 압축 단계를 식별합니다. 표시 형식:
전문가용 별도 창에 “Compression Score” 히스토그램과 “Threshold” 기준선을 표시합니다. 주요 특징 조기 감지: 가격 변동 전 유동성 축소 구간을 식별합니다. 다중 요소 측정: 표준화된 볼린저 밴드 폭, 거래량, 평균 스프레드를 결합합니다. 실시간 업데이트: 현재 캔들의 틱마다 갱신됩니다. 명확한 시각화: “Compression” 히스토그램과 점선 “Threshold” 표시. 호환성: MT4 및 MT5 버전 모두 지원합니다. 사용 방법 분석하려는 종목의 차트에 지표를 추가합니다. 변동성과 거래 세션에 따라 임계값 및 가중치를 조정합니다. 해석: 점수가 높을수록 유동성 압축 단계임을 의미합니다. 잠

Fixed Time AVWAP (Free) — Basic Fair Price Analysis The Fixed Time AVWAP indicator is a crucial tool for any trader, based on the Volume-Weighted Average Price (VWAP) concept. We provide you with an accurate and reliable AVWAP line, calculated from a user-fixed time, which is essential for determining the current fair value of an asset. Understanding VWAP: Why You Need This Indicator? VWAP is the average price at which an instrument has traded, adjusted by volume. It highlights wher
FREE

The Pivot Point indicator automatically calculates and displays the pivot point line and support and resistance levels. Pivot can be calculated according to the Classic, Floor, Fibonacci, Woodie, Camarilla or DeMark formula. It is also possible to select the period for calculating the indicator. A trader can choose from daily, weekly, monthly, or user-defined periods.
Types of pivots Classic Floor Fibonacci Woodie Camarilla DeMark
Main features The indicator shows the current and historic
FREE

Rua Pinbar This is an indicator to help you quickly identify pinbar candles in the chart. Can be used on any currency pair and any time frame you want. This indicator is often used to determine entry points. You can refer to the product here: https://www.mql5.com/en/users/phamruacoder/seller
A product of Ruacoder Get code indicator and robot (EA) as required.
FREE

This indicator tool provides mini charts, with adjustable symbol/tf that can be dragged into place. Lightweight operation with multiple mini charts are supported.
Chart features: adjustable symbol and tf draggable multiple mini charts color styling and font sizing, foreground/background colors candle coloring candle styles; candles, bars, line, high-low channel
zoom in/out
FREE

This indicator identifies swing highs and swing lows in the price chart by comparing the Highs and lows of each candle to a specified number of candle before and after it. Once it has identified the swing highs and swing lows, it can use them to determine potential support and resistance levels. A support level is formed when the price drops and bounces back up from a swing low, indicating that there is buying pressure at that level. A resistance level is formed when the price rises and reve
FREE

I recommend you to read the product's blog (manual) from start to end so that it is clear from the beginning what the indicator offers. This multi oscillator, multi time frame and multi symbol indicator identifies when a divergence occurs between price and an oscillator/indicator. It identifies both regular/classical (trend reversal) and hidden (trend continuation) divergences. It has moving average, RSI/Bollinger, ADX, pin bar and engulfing filter options which makes it possible to filter

CPR Pivot Lines It Will Draw Pivot Point R1,R2,R3 S1,S2,S3 Tc Bc Best Part Is That You Can Even Add Values Of High,Low,Close Manually Also To Get Your All Levels On Chart. So If Your Broker Data Of High ,Low ,Close Is Incorrect Then You Don’t Have To Depend On Them Anymore. You Can Even Modify All Lines Style. It Will Show Line In Floating Style And Not Continues Mess.
FREE
Market Structure Order Block Dashboard MT4 – MetaTrader 4용 ICT / Smart Money Concepts 인디케이터 Market Structure Order Block Dashboard MT4 는 Smart Money Concepts (SMC) 와 ICT 접근법을 사용하는 트레이더를 위해 설계된 고급 MetaTrader 4 인디케이터입니다. 시장 구조, Order Blocks , BOS / ChoCH , Fair Value Gaps (FVG) , 유동성 구역 (Liquidity Zones) , Kill Zones(세션) , Volume Profile 까지 하나의 시각적 대시보드에 모두 담았습니다. 이 도구는 EA가 아니며 자동으로 포지션을 열거나 관리하지 않습니다. 순수 기술적 분석용 인디케이터 로서, Forex , 지수 , 골드(XAUUSD 등) 에서 가격 구조를 읽고 트레이딩 아이디어와 시나리오를 만드는 데 도움을 줍니다. 주요 기

Behaving in a similar fashion as the price action of a chart, the indicator uses " Trix " to opportune itself to the exposure of divergency, flat/low market volume, and price action expansion . The TRIX indicator nicknamed after the Triple-Exponential-average, is a momentum-based oscillator that filters minor price changes and fluctuations that are considered insignificant for forex trading whilst providing money making opportunities! Overall, TRIX is a leading indicator that shows diverge
FREE

Your Chart 인디케이터로 트레이딩 경험을 향상시키세요! 이 무료이면서 고도로 커스터마이징 가능한 도구는 여러 시간대를 하나의 깔끔한 캔들 차트로 통합하여 원본 차트를 변경하지 않고 표시할 수 있습니다. Your Chart를 사용하면 각 맞춤형 캔들에 대한 바의 개수를 설정할 수 있습니다. 예를 들어, M1 차트의 18개 캔들을 하나로 결합하여 시장 트렌드를 더 넓은 시각으로 볼 수 있습니다. 주요 기능: 맞춤형 캔들 생성 : 하나의 캔들로 합칠 바의 개수를 선택하여 유연한 시장 뷰를 제공합니다. 비침투적 디자인 : 원본 차트 데이터는 그대로 유지되며, 맞춤형 캔들은 오버레이로 그려져 캔들의 본체와 그림자를 표시합니다. 색상 사용자 정의 : 상승 및 하락 방향의 캔들 색상을 원하는 대로 설정할 수 있습니다. 간소화된 트레이딩 : 차트 뷰를 맞춤화하여 트레이더는 독특한 인사이트와 보다 개인화된 가격 움직임에 대한 시각적 관점을 얻을 수 있습니다. MetaTrader 4의 단순성을
FREE

Please check the " What's new " tab regularly for a complete and up-to-date list of all improvements + parameters. FREE indicator for my trading utility Take a Break . This indicator allows you to manage multiple other EAs with just one Take a Break EA instance. Simply specify the corresponding Chart Group in the indicator(s) and Take a Break EA settings and you are good to go.
Setup examples (Indicator + EA)
As a prerequisite, add the URL https:// trading.custom-solutions.it to the list of a
FREE
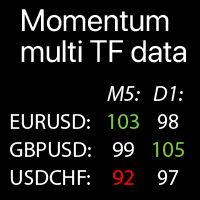
선택한 심볼에 대한 다중 시간대 모멘텀 값: 현재 시장 추세 비교 이 지표는 선택한 모든 시간대 및 심볼의 모멘텀 지표 값을 하나의 표에 표시하여 현재 시장 가격 추세를 빠르게 분석할 수 있습니다.
나의 다기능 도구 : 66+ 기능 | 문의 사항 연락 | MT5 버전 각 심볼 은 사용자 정의 가능합니다: 제거 / 교체. 최대 40개 심볼 추가 가능. 패널은 차트의 어느 곳으로나 이동 가능합니다 (드래그).
설정 에서 다음을 구성할 수 있습니다: 모멘텀 지표 설정: 기간, 적용 가격 유형 . 각 시간대 활성화 / 비활성화 가능 . 강조 옵션: 활성화 시 - 주요 수준이 사용자 정의 색상으로 강조 표시됩니다. 극값 (주요 수준) : 높은 값과 낮은 값; 알림 : 극값 수준에 대해 활성화 가능: 높은 모멘텀 / 낮은 모멘텀 / 둘 다. 시각적 스타일: 크기, 어두운 / 밝은 테마, 강조 색상. 모멘텀 지표 (Momentum) 는 특정 기간 동안 자산 가격의
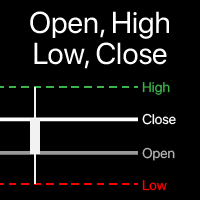
차트에서 시가, 고가, 저가, 종가 레벨의 시각화 현재 타임프레임뿐만 아니라 모든 타임프레임을 선택할 수 있습니다 . 계산된 바의 오프셋 을 조정할 수 있습니다: 현재 (플로팅) 바, 또는 지정된 수의 이전 바 . 다기능 유틸리티 : 66+ 기능 포함 | 질문이 있으면 연락주세요 | MT5 버전 지표 설정에서 다음을 구성할 수 있습니다: 계산된 바의 오프셋 : 0 = 현재 바, 1 = 이전 바, 2 = 2 바 전... " 여러 바 포함 " 옵션:
만약 > 0: 그러면 여러 바가 결합되어 최고가와 최저가를 결정합니다. 계산된 타임프레임 . 각 레벨(OHLC)은 개별적으로 활성화/비활성화 할 수 있습니다. 라인의 시각화 : 색상, 스타일, 크기, 배경 옵션. 추가 정보: 비활성화 가능; 라인 가격만; 라인 정보만; 둘 다: 정보 + 가격; 글꼴 크기 및 스타일('추가 정보'가 활성화된 경우). 프로그램 파

Check my p a id tools they work perfect please r ate Adjustable PIN BAR indicator is usefull tool alowing to search for pin bars you wish to find on the price chart, it has 2 parameters to filter out what type of pin bars you wish to search for: 1) MinTailProc 75% (default) which means to show pin bars that has minimum size of the Nose (Tail) as 75% of full candle size. If Upper Nose (Tail) size of the candle is minimum 75% of the candle size fully than candle is painted in RED. If Lower Nose
FREE
Unveiling Quantum Signal Pro: Your Edge in the Market! Are you tired of second-guessing your trading decisions? Do you wish you had a clearer, more precise way to spot market trends and potential reversals? Look no further! Quantum Signal Pro is here to transform your trading experience, offering a sophisticated yet easy-to-understand system that cuts through the market noise to deliver actionable insights. Imagine having a reliable partner that guides you to high-probability trade setups, confi
FREE

Pattern Detector can detect the most common 1, 2 and 3 candlestick patterns and send notifications when detected. Demo version working on AUDNZD can be found https://www.mql5.com/en/market/product/29189
How does it work Add the indicator to the chart you want to analyze and select which patterns to detect, the indicator will draw the detected patterns. You can also be notified via alert, app and email when a new pattern is detected.
Parameters Indicator Name - Used to draw the graphical object
FREE

All traders should know the trend before making their decision when placing the buy or sell orders. The first step always starts with supply and demand , rising and falling channels , trend lines, engulfing candles etc. All the above contribute to what is called “Price Action” and that is the best and most reliable way in trading and catching the trend and making profits, without stress. The Investment Castle Trend Line Indicator will automatically draw the trend lines on the MT4 for you. An
FREE

This trend scanner indicator is using two main indicators to identify trends. Frist the EMAs to provide a view on Bullish / Bearish momentum. When the shorter EMA (calculated off more recent price action) crosses, or is above, the slower moving EMA (calculated off a longer period of price action), it suggests that the market is in an uptrend. Second the Stochastic RSI, When RSI is < 20 it is considered oversold, and when > 80 it is overbought. These conditions suggests that momentum is very str
FREE

Master the market: harness the power of statistical arbitrage
This indicator showcases the price action of multiple instruments on a single chart, enabling you to compare the fluctuations of different assets and seamlessly implement statistical arbitrage strategies. Its main usage is to find correlated symbols which are temporarily out of whack.
[ Installation Guide | Update Guide | Troubleshooting | FAQ | All Products ]
Find overbought or oversold currency pairs easily Plot up to six currency
FREE

This indicator shows the latest untouched support and resistance as horizontal lines. The indicator can show support/resistance from higher timeframes. With this indicator you can e.g. easily see the support/resistance of the timeframes H4, D1 and W1 on a H1 chart, which can be a big advantage while time your entry on H1. This is the FREE version of the indicator: Support Resistance Multi Time Frame The free version works only on EURUSD and GBPUSD!
Parameters referenceTF: the timeframe from whi
FREE

The indicator draws price channels. It can be customized so that only buy or sell channels are displayed. Also, trend lines can be displayed instead of channels. This indicator is easy to use, but nevertheless, there are many trading strategies based on channel trading. Advisor based on this indicator: https://www.mql5.com/en/market/product/37952 Parameters History - maximum number of bars to build channels; Distance - minimum distance from one High (or Low) to another when constructing a chann
FREE

This indicator is a simple tool to spot a possible trend.
When the ribbon below the price bars, It will turn to Green color and the trend is seen to be bullish When the ribbon above the price bars, it will turn to Red color and the trend is seen to be bearish. It can be used a either Entry Signal Exit Signal or trailing stop, so it is very versatile. By default color : Green is UP trend and Red is Down trend and this work perfect with Bar4Colors.ex4
FREE
Non-Repainting Indicator dont; s forget this;s work well stronger trend fast markert lower time frame How to trade with SL Scalping Arrow * this system trend trading system we trade 15M chart using day tp,if you want identify Accumulation Distribution (H4) i am reccomend my SL Currency Strength Meter 28 Pair monthy weekly strenght you can easy filter best rank symbol list weekly monthy * we dont;s trade trend change time waiting trade next day pullback * if you want golden entry find. SL Cur

User Manual For more information pm me SL Currency28 Pair Dashboard is even used by the Banks to make profits. They take a strong currency and pitch against a weak currency This strategy i am made my other indicator SL Currency Strength Meter 28 Pair more improvement We can easily study the financial strength of multi-faceted trading SL Currency28 Pair Dashboard strength meter which creates multiple charts in a single window based on the price action of each currency in relation to

It predicts the most likely short-term price movement based on advanced mathematical calculations.
Features Estimation of immediate price movement; Calculation of the real market trend; Calculation of the most important support and resistance levels; Algorithms optimized for making complex mathematical calculations with a minimal drain of system resources; Self-adjusting for better performance, so it’s able to work properly at any symbol (no matter how exotic it is) and any timeframe; Compatibl
FREE

Lisek Stochastic oscillator indicator with Alarm, Push Notifications and e-mail Notifications. The Stochastic indicator is a momentum indicator that shows you how strong or weak the current trend is. It helps you identify overbought and oversold market conditions within a trend. The Stochastic indicator is lagging indicator, which means it don't predict where price is going, it is only providing data on where price has been !!!
How to trade with Stochastic indicator: Trend following: As long
FREE
이것은 무료 제품이므로 필요에 따라 사용하시면 됩니다!
긍정적인 별 5개 평가를 남겨주시면 정말 감사하겠습니다! 감사합니다!
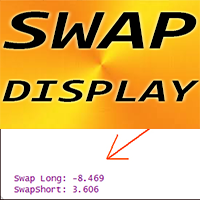
여기를 클릭하여 고품질 트레이딩 로봇과 지표를 확인하세요! ........................................................................ MT4용 외환 지표 SWAP 디스플레이, 훌륭한 보조 거래 도구.
- SWAP 디스플레이 지표는 외환 쌍의 롱 및 숏 거래에 대한 현재 SWAP을 첨부된 위치에 표시합니다. - 차트의 어느 모서리에서나 SWAP 디스플레이 값을 찾을 수 있습니다. - 색상과 글꼴 크기도 설정할 수 있습니다. - 각 거래자는 1일 이상 거래를 열어 둘 때 SWAP을 알아야 합니다. 이 MQL5 웹사이트에서만 제공되는 오리지널 제품입니다.
FREE

Currency Strength Gauge incicator
The currency strength gauge is an indicator to measure of the strength or weakness of currencies in the Forex market. Comparing the strength of currencies in a graphic representation will lead to a good overview of the market and its future trends. You will see in a graphic chart both the strength of the currencies and their correlation, and this will help you in your decisions to get better trades. -To easy detection of over Overbought and Oversold points,

This indicator shows the breakeven line level for the total number of open positions of the current symbol with P/L value and total volume. This indicator is helpful to decide the exit level when using a trading grid strategy. The style of the breakeven line is customizable to choose the color, line shape and font size of the positions description. Send mobile notification when crossing a positive P/L target
FREE
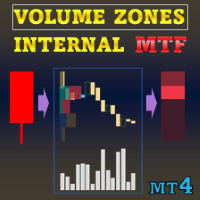
특별 할인 : ALL TOOLS , 각각 $35 에 제공합니다! New tools will be $30 for the first week or the first 3 purchases ! Trading Tools Channel on MQL5 : Join my MQL5 channel to update the latest news from me Volume Zones Internal Visualizer Multi-Timeframe 는 상위 차트에서 거래하면서도 하위 차트의 상세한 거래량 활동을 파악할 수 있도록 도와주는 최고의 솔루션입니다. 다중 시간대(Multi-Timeframe)를 지원하는 강력하고 직관적인 거래량 분석 도구를 찾고 계시다면, 바로 이 제품이 적합합니다! MT5 버전 더 보기: Volume Zones Internal Visualizer MT5 Multi TF 다른 제품 더 보기: All P roducts Why Choose Volume Z

What is G Force Trend? G Force Trend is a technical analysis indicator developed for the MetaTrader 4 platform. It analyzes price movements to identify trend direction and generates buy/sell signals. The indicator creates a dynamic channel to track price behavior within the channel and visualizes trend changes. What Does It Do? Trend Detection : Determines whether the price is in a bullish or bearish trend. Buy/Sell Signals : Generates clear buy and sell signals when the price crosses the channe
FREE
Our modernized version of the popular channel TMA_TRUE indicator for MT4, which provides information on the main points of trend reversal and momentum exhaustion by drawing a channel on the chart, also draws arrows of signals for buy and sell. As a result, traders can identify bullish and bearish price reversal zones and BUY and SELL accordingly.
This indicator works well on all instruments and on all Timeframes.
This indicator is the basis of our Channel Trigger EA, which you can buy in MQL
FREE
This indicator was developed to support multiple timeframe analysis. In the indicator settings, the user can set the color, width, and style of the horizontal lines for each timeframe. This way, when the horizontal lines are inserted into the chart, they will be plotted with the timeframe settings.
MTF Lines also allows visibility control of another objets like rectangles, trend lines and texts.
This is a product developed by Renato Fiche Junior and available to all MetaTrader 4 and 5 users!
FREE
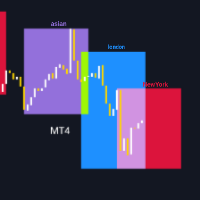
이 지표의 기능을 살펴보기 전에, 이 제품을 평가 하고, 경험을 공유하기 위해 댓글 을 남기고, 제 페이지를 구독 하여 최신 출시 및 도구에 대한 정보를 받아보세요. 여러분의 지원은 매우 중요하며 제 작품을 지속적으로 개선하는 데 도움이 됩니다! 설명: TradingSessionVisualizer 는 MetaTrader 4용 강력한 지표로, 차트에서 주요 거래 세션을 명확하고 사용자 정의 가능한 방식으로 시각화합니다. 이 도구를 사용하면 아시아, 런던 및 뉴욕의 거래 세션을 쉽게 구별할 수 있으며, 이러한 핵심 기간 동안의 시장 움직임을 더 잘 이해하는 데 도움이 됩니다. 주요 기능: 거래 세션 표시: 차트에서 아시아, 런던 및 뉴욕의 거래 세션을 색상이 지정된 직사각형으로 명확하게 시각화합니다. 사용자 정의 가능한 매개변수: 각 세션의 색상, 선 너비 및 직사각형의 채우기 여부를 조정할 수 있습니다. 동적 표시: 지표는 선택한 날짜 수에 따라 자동으로 조정됩니다 (최대 3일). 쉬
FREE

Overview Market Structure Analysis Indicator MT4 Structure Analysis Indicator automatically identifies Market Structure based on Smart Money Concepts (SMC). It clearly displays Break of Structure (BoS), Change of Character (CHoCH), Higher Highs, Higher Lows, Lower Highs, and Lower Lows in real-time. Key Features Automatic Market Structure Detection Break of Structure (BoS) - Price breaks previous structure in trend direction Change of Character (CHoCH) - Trend reversal sig

Basic Theme Builder: 차트 맞춤화를 간편하게 Basic Theme Builder 지표로 거래 경험을 혁신하세요. 이 다용도 도구는 MetaTrader 4 에서 차트의 외관을 간편하게 사용자 맞춤화할 수 있도록 설계된 직관적인 패널을 제공합니다. 다양한 테마와 색상 스킴을 간단히 전환하여 거래 환경의 시각적 매력과 기능성을 향상시킬 수 있습니다. Free MT5 version Basic Theme Builder 지표는 MetaTrader 4 차트를 손쉽게 개인화하려는 거래자에게 최적의 도구입니다. 간단한 패널 인터페이스와 다양한 테마 프리셋을 통해 거래 스타일이나 기분에 맞게 차트의 외관을 빠르게 조정할 수 있습니다. 클래식한 룩부터 현대적인 미학까지, Basic Theme Builder는 시각적 경험을 향상시키고 집중력을 높이는 데 도움이 되는 다양한 옵션을 제공합니다. 오늘 이 실용적이고 사용하기 쉬운 지표로 거래 환경을 최적화하세요. 주요 기능: 간편
FREE
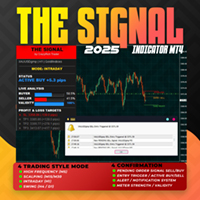
Overview The Signal Premium System for All Pairs is a smart trading assistant designed for Forex, Gold (XAUUSD), and Indices.
It automatically adapts to any timeframe and provides clear entry, Stop Loss, and Take Profit levels to support consistent and confident trading. This indicator helps traders identify high-probability setups across multiple markets and trading styles — whether you prefer scalping, intraday, or swing trading. Core Features 1. Smart Signal Status Waiting for Signal:
FREE

이 지표는 TradingView의 "ATR Based Trendlines - JD" by Duyck를 MetaTrader 4용으로 변환한 버전입니다. 작동 방식
이 지표는 가격뿐만 아니라 ATR이 감지한 변동성을 기반으로 자동적·지속적으로 추세선을 그립니다. 따라서 추세선의 각도는 ATR(의 일정 비율)에 의해 결정됩니다. 추세선의 각도는 피벗 포인트가 감지되는 순간의 ATR에 따라 가격 변화를 따라갑니다. ATR 백분율은 추세선이 ATR 변화율을 그대로 따를지(100%), 일부만 반영할지(<100%), 아니면 배수로 반영할지(>100%)를 결정합니다. 입력 매개변수 Lookback depth: 피벗 발생 여부를 확인할 캔들 수 설정 ATR target percentage: 추세선 방향에 대한 ATR 효과의 민감도 조정 Draw lines from wicks or real bodies: 피벗 및 ATR 계산 시 캔들 몸통 또는 심지 사용 여부 선택 추세선 방향 (상승, 하락, 또는
FREE

The MP Andean Oscillator is used to estimate the direction and also the degree of variations of trends. It contains 3 components: Bull component, Bear component and Signal component. A rising Bull component indicates that the market is up-trending while a rising Bear component indicates the presence of down-trending market. Settings: Oscillator period: Specifies the importance of the trends degree of variations measured by the indicator. Signal line per: Moving average period of the Signal line
FREE

I recommend you to read the product's blog (manual) from start to end so that it is clear from the beginning what the indicactor offers. This indicator for Metatrader 4 identifies when a divergence occurs between price and an oscillator/indicator. It identifies both bullish and bearish divergences. It has a RSI filter option which makes it possible to filter out only the strongest setups. The indicator also offers options to wait for an Engulfing formation, Donchian channel breakout or for p

Ants Lite ATR allows you to enter and manage your trades based on the market volatility, giving you safer entries and better exits. Based on the work by Daryl Guppy.
Features Ability to define the bar the Long and Short calculation starts from. Can be used to generate both entry or exit signals. Customizable ATR period and multiplier. GMMA is a tried and tested indicator with a long pedigree. Volatility based entry and exit signal rather than time based.
How To Use Simply drag the indicator fr

Session Killzone Indicator
Indicator that helps you to identify the killzone times of both London and NewYork sessions which usually is the most times for high volatility and taking liquidity from the market. Killzone times are configurable through indicator parameters. The indicator adjusts the range of the killzones based on the daily trading range.
FREE

OneShotFX is a scalping arrow signals type indicator, an all in one arrow system with money management and filtered signals. How to trade Buy : when up arrow prints on the chart open buy trade, set your tp and sl on colored tp and sl lines above and below the arrow signal candle. Sell: when up arrow prints on the chart open sell trade, set your tp and sl on colored tp and sl lines above and below the arrow signal candle. Why is it a good choice Plenty of signals : no need to wait for long per
FREE
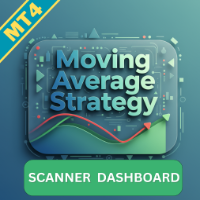
이동 평균 멀티커런시 스캐너 대시보드 MT4 는 사용자 정의 가능한 이동 평균선을 사용하여 여러 통화 쌍과 시간 프레임을 모니터링하도록 설계된 강력한 거래 도구입니다. 심볼과 시간 프레임(M1에서 MN1까지)을 기준으로 신호를 정리하는 그리드 형식으로 제공됩니다. 트레이더는 전략에 맞게 특정 시간 프레임을 활성화하거나 비활성화할 수 있습니다. MT5 버전은 여기에서 확인할 수 있습니다: Moving Average Multicurrency Scanner MT5 자세한 문서는 여기에서 클릭하세요: 문서 주요 기능: 이동 평균선 통합: 주기, 이동, 방법(SMA, EMA 등), 적용 가격 등의 조정 가능한 매개변수를 가진 두 개의 이동 평균선을 지원하여 효과적인 추세 분석과 교차 식별을 가능하게 합니다. 컨플루언스 경고: 여러 시간 프레임이 동일한 방향으로 정렬될 때 컨플루언스 신호를 강조하여 거래 설정의 신뢰도를 높입니다. 사용자 정의 경고: 팝업,MENU 이메일 또는 푸시 알림

표시기는 지정된 수의 양초를 분석하고 고가를 기준으로 피보나치 수준을 표시합니다. 레벨이 재정렬되기 때문에 범위의 오른쪽에 관심이 있습니다. 가격은 레벨을 자화하고 터치에 반응합니다. 이 도구를 사용하여 수정 후 추세 진입점을 찾습니다. 왼쪽에서 레벨이 완벽하게 상승한 것을 보면 극한 지점에서 움직임의 끝을 발견했다고 가정할 수 있습니다. 모든 선은 버퍼 또는 개체를 통해 그려집니다(선택 사항).
입력 매개변수.
Bars Count - 계산 범위.
Visual Button - 버튼 표시(활성화/비활성화). Corner - 버튼 앵커 각도. X indent - 픽셀의 수평 패딩. Y indent - 픽셀의 수직 패딩.
Label Visual - 디스플레이 레벨 레이블. Label Font Size - 글꼴 크기. Label Shift Bars - 비문의 들여쓰기(촛불의 수). Label Tooltip - 레벨 위의 커서 아래에 텍스트 표시.
Draw Lines
FREE

This indicator finds the "Double Bottom" and "Double Top" technical analysis patterns, shows them on the chart of the currency pair and can signal if the pattern was formed recently. These patterns are reversal, often after the emergence of the trend turns back or a correction occurs. In order not to search for them yourself, it is enough to add the indicator to the chart, after that, you can change different timeframes in order to quickly find such figures on one of the timeframes. There are so
FREE

The Pipsometer Pro Indicator is an essential, minimalist tool designed for the disciplined trader who requires immediate, at-a-glance financial feedback. It functions as a dedicated, real-time display that continuously calculates and shows your current floating profit or loss, measured exclusively in **pips**, for every open trade on the active chart. This focus on pips rather than monetary value allows traders to assess market performance and price movement directly, stripping away the emotion
FREE

Didi Index indicator with visual buy and sell alert, with confirmation alert.
Buy or sell alerts, on screen and for mobile phones, with a visual description in colors of the direction on the screen!
A warning in the color of the current direction of the graph on the screen quickly informs you if the pair is bought or sold by Didi Index.
With configurable text position and size, making it easier to follow the trend of the pair.
FREE

Time Range Separator is a useful tool to display a separator period on your platform. You could go in the properties of the indicator, select the desired range and that's ALL. We believe it is a useful and necessary that we wish to share with you for free all our followers.
Input Values: TimeFrame Period Separator GMT_Hour (ex. +1 or -1) to move the lines at Period Time +/- tot hours in input Hide_dates to show or hide the datetime on vertical lines VLine_Color = Vertical Color Line VLine_Style
FREE

BuySell Volume is an indicator that approximates Buy and Sell volumes based on price movement. Input Description: applied_model: Choose the applied model. In low reversal mode, price is considered receive low bearish pressure during bullish candle's creation (high bearish pressure on high reversal model. In other words, Bullish Marubozu candles has really high Buy Volumes in low reversal model than in high reversal one.
Output Description: Buy and Sell Volume: Determines how many Buy and Sell vo
FREE

MAD Bands (Moving Average Deviation Bands) MAD Bands are intended to be used when you want to visually check the behavior of price volatility in relation to a moving average.
MAD_Bands (MQL4 version) parameter description This document explains the MT4 parameter input screen for each setting item (input parameter). Group: Main (basic settings) Period Default : 20 Explanation : The number of candlesticks used to calculate the moving average (Mid) and band width. The larger the value,
FREE
Tipu Parabolic SAR Panel is the modified version of the original Parabolic SAR indicator published by MetaQuotes here . Dashboard Panel (multi symbol) version for this indicator is available here .
Features An easy to use Panel that shows the Parabolic SAR trend and signals of selected timeframe. Customizable Buy/Sell alerts, push alerts, email alerts, or visual on-screen alerts. Customizable Panel. The panel can be moved to any place on the chart or minimized to allow more space. To enable the
FREE
MetaTrader 마켓은 거래 로봇과 기술 지표들의 독특한 스토어입니다.
MQL5.community 사용자 메모를 읽어보셔서 트레이더들에게 제공하는 고유한 서비스(거래 시그널 복사, 프리랜서가 개발한 맞춤형 애플리케이션, 결제 시스템 및 MQL5 클라우드 네트워크를 통한 자동 결제)에 대해 자세히 알아보십시오.
트레이딩 기회를 놓치고 있어요:
- 무료 트레이딩 앱
- 복사용 8,000 이상의 시그널
- 금융 시장 개척을 위한 경제 뉴스
등록
로그인
계정이 없으시면, 가입하십시오
MQL5.com 웹사이트에 로그인을 하기 위해 쿠키를 허용하십시오.
브라우저에서 필요한 설정을 활성화하시지 않으면, 로그인할 수 없습니다.