YouTubeにあるマーケットチュートリアルビデオをご覧ください
ロボットや指標を購入する
仮想ホスティングで
EAを実行
EAを実行
ロボットや指標を購入前にテストする
マーケットで収入を得る
販売のためにプロダクトをプレゼンテーションする方法
MetaTrader 4のためのテクニカル指標 - 18

This indicator presents an alternative approach to identify Market Structure. The logic used is derived from learning material created by DaveTeaches (on X) Upgrade v1.10: add option to put protected high/low value to buffer (figure 11, 12)
When quantifying Market Structure, it is common to use fractal highs and lows to identify "significant" swing pivots. When price closes through these pivots, we may identify a Market Structure Shift (MSS) for reversals or a Break of Structure (BOS) for co

Descption: The Volume Profile displays detailed informations of historical trading activities at certain price levels (Market Profile). So you can locate the areas with the best prices in the market and get an advantage about other market participants.
Features: Customizable Volume Profile / Market Profile Shows the "fair" Value Area with 70% of all Volume
Shows critical low volume zones
Shows VPOC, VAL and VAH Points Works on all timeframes Also available for MT5 ( https://www.mql5.com/en/mark

AIS 正しい平均インジケーターを使用すると、市場でのトレンドの動きの始まりを設定できます。インジケーターのもう 1 つの重要な品質は、トレンドの終わりの明確なシグナルです。指標は再描画または再計算されません。
表示値 h_AE - AE チャネルの上限
l_AE - AE チャンネルの下限
h_EC - 現在のバーの高予測値
l_EC - 現在のバーの低い予測値
インジケーターを操作するときのシグナル 主な信号は、チャネル AE と EC の交差点です。
l_EC ラインが h_AE ラインより上にある場合、上昇トレンドが始まる可能性があります。
h_EC ラインが l_AE ラインを下回った後、下降トレンドの始まりが予想されます。
この場合、h_AE ラインと l_AE ラインの間のチャネル幅に注意する必要があります。両者の差が大きければ大きいほど、トレンドは強くなります。 AEチャンネルによる局所的な高値・安値の達成にも注意が必要です。この時、価格変動のトレンドが最も強くなります。
カスタマイズ可能な指標パラメータ インディケータを設定するには、時間枠に応じて

Balance Levels は、わかりやすい売買シグナルと動的な価格レベルを提供する、使いやすいトレードインジケーターです。トレーダーが自信を持ってエントリーとエグジットを計画するのに役立ちます。 このツールは非常に柔軟で、 単独の戦略 として使用することも、既存のトレーディングシステムに組み込むことも可能です。 すべての時間足およびすべての市場 で動作します:FX、ゴールド、株価指数、暗号資産、株式など。 Balance Levels はあらゆるトレードスタイルに対応します。 スキャルピング や デイトレード から スイングトレード 、さらには長期投資まで。視覚的なシグナルとバランスゾーンにより、チャートがより明確になり、不要な「ノイズ」を取り除きます。 購入後は、ツールを最大限に活用し、トレードスタイルにうまく統合するための ガイドと追加資料 を受け取ることができます。 初心者でも経験豊富なトレーダーでも、Balance Levels は実用的で低コストなソリューションとして、市場での意思決定を改善することができます。 購入前に無料デモ版をダウンロードして、ご自身のチャートで B
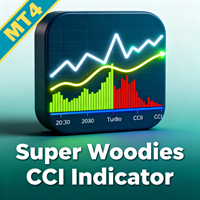
取引の優位性を高めるために、Super Woodies CCI Indicator MT4 を使用してください。これは、ケン・ウッドの有名な Woodies CCI システムに着想を得た先進的なモメンタムオシレーターで、2000 年代初頭にデイトレーダー間で人気を博したデュアル CCI アプローチにより、循環パターンと高確率セットアップを検出します。外汇、株式、商品のトレーダーに広く支持され、このインジケーターは Commodity Channel Index (CCI) を活用してオーバーボート/オーバーソールド状態、トレンド継続、リバーサルを検出、Forex Factory や TradingView などのコミュニティフォーラムが偽信号の削減における効果を強調—Zero Line Rejects や Trend Line Breaks などの明確な視覚的手がかりを通じてモメンタムベースの戦略で勝率を 15-25% 向上させることが多いです。その持続的な魅力は複雑な市場ダイナミクスを簡素化し、ボラティルセッション中の正確なエントリーを可能にし、感情的な取引を最小限に抑える点にあり、

エグジットエリアアルティメットは、 チャート上に毎日の 平均トゥルーレンジ(ATR) と 平均日次レート(ADR) のレベルを示すことにより、取引の意思決定を強化するように設計されたテクニカル指標です。これらのレベルを理解することで、トレーダーは 1 日を通しての資産の平均的な動きを簡単に評価できます。この多用途のインジケーターは、デイトレーダーにとってさまざまな目的に役立ち、注文の発注を支援し、日中の傾向を特定し、トレーリングストップロスレベルを設定し、毎日のテイクプロフィットレベルを確立します。 この指標の重要な特徴の 1 つは、市場のボラティリティと価格帯に関する貴重な洞察を提供する ATR 指標と ADR 指標への依存です。トレーダーはこの情報を使用して適切なテイクプロフィットとストップロスのレベルを決定し、リスク管理戦略を最適化できます。このインジケーターは、表示されたレベルに基づいて残りのピップも計算するため、潜在的な利益または損失を迅速に評価できます。 Exit Area Ultimate はあらゆるシンボルと互換性があり、トレーダーは幅広い資産に適用できます。さらに、各

The Colored MACD indicator is a versatile and powerful tool designed to enhance your technical analysis by providing an intuitive visualization of market momentum and trend changes. Built on the foundation of the popular Moving Average Convergence Divergence (MACD) indicator, this version introduces color-coded histograms to easily distinguish between bullish and bearish momentum. Key Features: Color-Coded Visualization : The indicator features a lime-colored histogram when the MACD is above the
FREE

取引の精度を向上させるために、WaveTrend Oscillator Indicator MT4 を使用してください。これは、LazyBear の 2014 年 TradingView スクリプトから適応された momentum ベースのツールで、市場反転と momentum シフトの検出精度で有名です。10 年以上にわたり取引コミュニティで広く祝賀され、このオシレーターは RSI と MACD に似た要素を組み合わせ、過買い/過売り状態を検出します。これを forex、暗号通貨、株式、商品のトレーダーにとって必須のものにします。その人気は、ボラティル市場でノイズをフィルタリングする信頼できるクロスオーバー信号から生まれ、ユーザーがトレンド反転と強さを活用し、偽の動きを最小限に抑えるのを助けます—高確率エントリーを求めるスキャルパー、日中トレーダー、スイング戦略に理想的です。 WaveTrend Oscillator Indicator MT4 は、動的ライン(主オシレーターの緑)を通じて momentum を視覚化し、信号線(赤の点線)と相互作用し、過買いバンド(赤 60/53)と

. Simple Trading System Update !!! Follow this link to see our Strategy !!! (With auto trade indicator)
Description This is an indicator Free Version and showing only history signals, Not real time. Binary Deal Trading Indicator is an indicator on MT4 for Binary Option Trading. It forecasts the overbought / oversold level, Reversal and Fractal point. This indicator will help you to decide a reversal price on any time frame (Recommend M1, M5 and M15). The expiry time is 5-15 minutes after rec
FREE

Full Stochastic - is Stochastic Oscillator which displays all three essential lines: %K Slow K %D Standard Stochastic Oscillators displays only Slow K and %D.
Why it is important to analyze all three lines in SO? Standard SO users must choose if they want to use fast or slow SO. In case of fast SO traders set the slowing parameter typically to 1 or 2, or if they want to use slow SO, they set the slowing parameter usually to 3 or more. With Full Stochastic you can have both!
Full Stochastic Par
FREE

The tool is used to calculate the size of the position that can be opened with the previously assumed risk. The risk can be defined as: percentage value of the account (%), nominal value, expressed in the account currency. The size of position is determined by the distance of the planned SL (red line).
Input Parameters Lost_in_Money - if true, the value of the acceptable loss is determined by the parameter "Acceptable_loss", else acceptable loss is determined by the parameter "Acceptable_Risk_P

一目均衡表マルチカレンシースキャナーダッシュボード MT4 は、一目均衡表(Ichimoku Kinko Hyo)を使用して複数の通貨ペアと時間枠を監視するために設計された強力な取引ツールです。シグナルはグリッド形式で整理され、ベース通貨と時間枠(M1からMN1まで)でグループ化されます。トレーダーは、戦略に合わせて特定の時間枠を有効または無効にできます。 このツールは、以下の戦略に基づいてシグナルを表示します: Kijun Cross Strategy: 価格が基準線(Kijun-sen)をクロスする際にシグナルを生成します。
Kumo Breakout Strategy: 価格が雲(Kumo)をブレイクアウトするに基づくシグナル。
Chikou Span Confirmation Strategy: 遅行スパン(Chikou Span)を使用してシグナルを確認します。
Tenkan-Kijun Cross Strategy: 転換線(Tenkan-sen)と基準線(Kijun-sen)のクロスに基づく短期シグナル。
Kumo Twist Strategy: 雲(Kumo)のねじれを
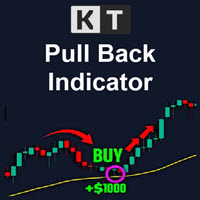
KT Pull Back Arrows は、RSI(相対力指数)を使用して、買われすぎや売られすぎのゾーン内で適切なプルバックエントリーのエリアを特定し、矢印で表示するインジケーターです。このインジケーターは、RSIのしきい値を活用することで、プルバック取引を開始するための好機を正確に捉えます。 トレンドフォロー戦略は、FX市場で最も利益を出しやすい戦略の1つとされています。波に乗るように、市場の流れに従い、モメンタムを活用して利益を狙います。ただし、タイミングが重要です。遅れてトレンドに乗ることは、崖から飛び降りるようなもので、リスクが高く、損切りで終わる可能性もあります。 そこで重要となるのが、トレンドの押し目や戻りを狙うプルバックの技術です。ただし、トレンドの調整幅を正確に予測するのは簡単ではありません。フィボナッチリトレースメントを使っても、正確なエントリーポイントを見つけるのは針を干し草の山から探すようなものです。ですが、このインジケーターがその問題を解決してくれます。
機能
RSIの値をカスタマイズでき、銘柄や時間足に応じて最適なプルバック検出が可能です。 買い・売りの両

KT MACD Alerts は、MetaTrader に搭載されている標準の MACD インジケーターをベースにした、独自のカスタムバージョンです。以下の 2 つの重要なイベント発生時に、アラートを出し、チャート上に垂直線を描画します: MACD がゼロラインを上抜けたとき。 MACD がゼロラインを下抜けたとき。
主な機能 あらゆる時間足に対応したマルチタイムフレームスキャナーを内蔵し、それぞれの時間足における MACD の方向を確認できます。 MACD のゼロラインをまたぐクロスに注目した取引を行うトレーダーに最適です。 アラートと同時にクロスの位置に垂直線を描画し、視認性を高めます。 動作が非常に軽く、システムのメモリやリソースをほとんど消費しません。 MetaTrader が対応するすべての通知形式(ポップアップ、音声、モバイル、メールなど)に対応しています。
MACD の歴史 MACD(移動平均収束拡散法)は、テクニカル分析において非常に広く使われているインジケーターです。1970 年に Gerald Appel 氏によって開発され、価格トレンドの強さ・モメンタム・持
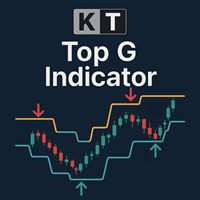
KT Top G は、価格アクションに基づいたインジケーターで、スマートなチャネル分析を組み合わせることで、潜在的な市場の天井と底を識別します。反転の可能性が検出されると、チャート上に太くて見やすい矢印を表示し、市場が反転する前に事前に通知します。 大きな矢印: 価格の勢いの変化や消耗を検出して、高確率な天井と底を示します。 小さな矢印: 低確率の反転ポイントを示しますが、市場が実際に反転する前に突破されることが多いです。
特徴 幅広い互換性: 通貨ペアはもちろん、株式、ETF、インデックスなどの他の金融商品でも使用可能です。 マルチタイムフレーム対応: スキャルピング用のM1とM5、スイングトレード用のH1、H4、D1でも優れたパフォーマンスを発揮します。 ミッドライン付きのチャネル内蔵: 矢印とともに、現在のレンジとトレンド方向を示す動的な価格チャネルを表示します。 リペイントなし: 矢印が一度表示されると消えることはなく、信頼性のあるシグナルを提供します。 ボラティリティへの適応性: チャネルの長さとスムージング係数を調整することで、急激な値動きにも対応できます。 個別アラート

ストップアウト&マージンコー ルレベル – あなたのリスク管理アシスタント このインジケーターを使えば、ストップアウト、マージンコール、フリーマージン、そして任意のカスタムレベルをチャート上にリアルタイムで視覚的に表示できます。高いレバレッジや全資金を投入する戦略を使用するトレーダーにとっては、ほんのわずかな価格変動でも大きな影響を受ける可能性があるため、こうしたリスク管理ツールは非常に重要です。 完全にカスタマイズ可能 – 各ラインの色、スタイル、太さ、表示の有無を個別に設定可能です。 柔軟な構成 – アラートの発動レベルや更新間隔も自由に調整できます。 スマートな動作 – 複数の銘柄でポジションを保有している場合でも、現在のエクスポージャーに基づいて自動的にレベルが調整されます。 リスクを先回りして察知し、冷静かつ論理的な判断で取引を成功に導きましょう。もう勘に頼る必要はありません。

数列の一つに「森林火災数列」があります。これは、最も美しい新しいシーケンスの 1 つとして認識されています。その主な特徴は、このシーケンスが線形トレンドを回避することです。最短のものであってもです。この指標の基礎を形成したのはこのプロパティです。 財務時系列を分析する場合、この指標は可能なすべての傾向オプションを拒否しようとします。そして失敗した場合にのみ、トレンドの存在を認識し、適切なシグナルを発します。このアプローチにより、新しいトレンドの始まりの瞬間を正しく判断できます。ただし、偽陽性の可能性もあります。それらの数を減らすために、このインジケーターに追加のフィルターが追加されました。新しいバーが開くとシグナルが生成されます。いずれの場合も再描画は発生しません。 指標パラメータ: Applied Price - 適用価格定数; Period Main - インディケータのメイン期間、その有効な値は 5 ~ 60 です。 Period Additional - 追加の期間。このパラメーターの有効な値は 5 ~ 40 です。 Signal Filter - 追加の信号フィルター、有効
FVG ゾーン インジケーターは、 市場における公正価値ギャップ (FVG) を特定し、公正価値と市場価格の間の価格不均衡を浮き彫りにするために設計された強力なツールです。このギャップの正確な特定により、トレーダーは潜在的な市場参入および市場退出ポイントを見極めることができ、情報に基づいた取引決定を行う能力が大幅に向上します。 FVG ゾーン インジケーターは、直感的でユーザー フレンドリーなインターフェイスを備えており、チャート上の公正価値ギャップを自動的にスキャンして、価格チャートにこれらのゾーンをリアルタイムでマークします。これにより、トレーダーは、今後の価格修正やトレンドの継続を示唆する可能性のある潜在的な価格の不均衡を迅速かつ簡単に認識できます。 主な機能は次のとおりです。 リアルタイムギャップ検出: FVG が現れると自動的に識別してマークします。 ギャップのサイズをピップ単位で表示: このインジケーターは、識別された各ギャップのサイズをピップ単位で表示し、トレーダーがギャップの重要性を理解するのに役立ちます。 現在の価格からのピップ距離: 特定された公正価値ギャップか
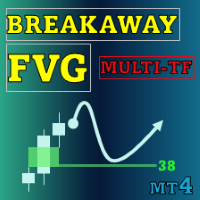
Special offer : ALL TOOLS , just $35 each! New tools will be $30 for the first week or the first 3 purchases ! Trading Tools Channel on MQL5 : Join my MQL5 channel to update the latest news from me Breakaway Fair Value Gaps (FVG) ツールは、トレーダーが価格がバランスから逸脱した領域を特定し、修正の可能性に関する詳細な洞察を提供するために設計された最先端のソリューションです。このツールは重要なシグナルを強調するだけでなく、意思決定の精度を向上させるための高度な機能も含まれています。 MT5バージョンはこちら: Breakaway Fair Value Gaps MT5 その他の製品を見る: すべての 製品 Breakaway FVGの主な特徴 1. Breakaway Fair Value Gapとは何ですか? 定義:
Bre

ブームおよびクラッシュスパイク検出器インジケーターは、主に価格のブームおよびクラッシュを検出するための高度な戦略に基づいてコーディングされています。 価格の高確率のブームとクラッシュを検出するために、複雑なアルゴリズムが組み込まれました。 ブームまたはクラッシュフェーズの可能性について警告します。
ブームフェーズ:価格の上昇が速すぎる場合。 クラッシュフェーズ:価格の低下が速すぎる場合。
期間限定オファー:インジケーターは30ドルと生涯でのみご利用いただけます。
主な機能
プッシュ通知を携帯電話に送信します コンピューターまたはラップトップでポップアップしてアラートを鳴らします 再描画されない矢印を表示します(潜在的なブームの場合は上向きの矢印、潜在的なクラッシュの場合は下向きの矢印) すべてのペアでの作業。
おすすめ
時間枠:H1およびH4 ペアの推奨:トレンドフェーズのペア。
コンタクト
ご不明な点がある場合やサポートが必要な場合は、プライベートメッセージでご連絡ください。
著者
SAYADI ACHREF、fintechソフトウェアエンジニアおよびFinansyaの

Introduction to Fractal Moving Average Fractal Moving Average indicator was designed as part of Fractal Pattern Scanner. Inside Fractal Pattern Scanner, Fractal Moving Average Indicator was implemented as multiple of chart objects. With over thousands of chart object, we find that it was not the best and efficient ways to operate the indicator. It was computationally too heavy for the indicator. Hence, we decide to implement the indicator version of Fractal Moving Average indicator to benefit o
FREE
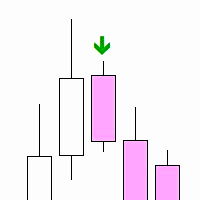
"Inside Bar PA" is a technical indicator designed to determine the inner bars on the chart. An internal bar is a bar or candle, the maximum and minimum of which are completely contained in the previous bar. This may signal a potential reversal or continuation of the trend, depending on the context.
Features: Automatic detection of internal bars. Visual marking of internal bars with arrows on the chart. The ability to adjust the distance of the mark from the bar. How to use: Attach the indicato
FREE

Moving Average Trend Alert is a triple MA indicator that helps traders to identify potential market trends based on 3 MAs alignment and crossover.
Moving Average Trend Alert features: Customizable short-term, medium-term, and long-term MAs. Option to filter signals based on a minimum distance between moving averages to avoid premature MAs alignment. Optional Filter of signals with RSI indicator overbought/oversold levels. Optional Filter of signals with ADX indicator. Popup, email, and phone no
FREE

Volume Delta is a very powerful indicator that reads the supply on the Market. It calculates the Delta from movement of the price and the difference of BUY and SELL Tick volumes. Its special structure allows you to get all timeframe values available on the MT4 platform. A good observation of this instrument can suggest great entry points and possible reversal. We are confident that this tool will help you to improve your trading timing. See also for MT5: https://www.mql5.com/en/market/product/5
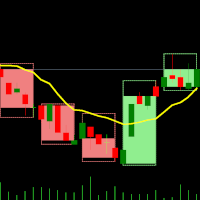
MT4用デュアルタイムフレームインジケーター – キャンドル・イン・キャンドル 概要 キャンドル・イン・キャンドル・インジケーターは、MT4専用に設計されたマルチタイムフレームのビジュアルツールです。低タイムフレームのチャート上に高タイムフレームのキャンドルを重ねて表示することで、小さなキャンドルが大きなキャンドル内でどのように動くかを確認できます。この手法により、市場構造の分析が向上し、トレンドの識別が正確になり、価格アクションが明確になるため、チャートを切り替える手間が省けます。 動作方法 低タイムフレームを選択:
分析したいタイムフレーム(例:M1、M5、M10)でMT4チャートを開きます。 乗数を適用:
高タイムフレームのキャンドル構造を動的に生成するための乗数を選択します。 例: M1チャートで乗数5 → M1キャンドルがM5キャンドル内に表示されます。 M10チャートで乗数6 → M10キャンドルがH1キャンドル内に表示されます。 高タイムフレームのキャンドル表示:
インジケーターは、高タイムフレームのOHLC(始値、高値、安値、終値)を現在のチャートに直接プロットし
FREE

Lot Size Calculator – ポジションサイズ計算ツール このインジケーターは、選択したリスク割合とストップロスの距離に基づいてロットサイズを計算します。これは、Forex、金属、指数、商品、および暗号通貨の取引向けに設計されています。
主な機能 口座残高 / 有効証拠金とリスク%に基づいたポジションサイズ計算 成行注文と指値注文に対応 チャート上にエントリー、ストップロス、テイクプロフィットを表示 リスクリワード比を表示 ストップロス距離に応じて自動的にロットを調整 チャートに損益額を表示 使い方 インジケーターをチャートに追加します。 入力設定でリスク%を選択します。 リスク計算基準を選択(口座残高または有効証拠金)。 注文モードを選択(成行または指値)。 エントリー、ストップロス、テイクプロフィットのラインを調整します。 計算されたロットサイズで取引を実行します。 パラメータ リスク% :0.1% ~ 100% 計算方法 :口座残高 / 有効証拠金に基づくリスク% 表示内容 :エントリー、ストップロス、ターゲットラインと損益値
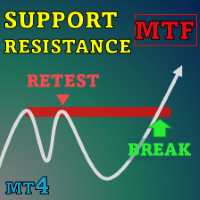
Special offer : ALL TOOLS , just $35 each! New tools will be $30 for the first week or the first 3 purchases ! Trading Tools Channel on MQL5 : Join my MQL5 channel to update the latest news from me 絶えず変化する金融取引の世界では、サポートとレジスタンスレベルを正確に識別し分析することが、情報に基づいた投資判断を下すために不可欠です。 SnR Retest and Break Multi-Timeframe は、取引分析を強化するために設計されたサポートとレジスタンスのインジケーターです。革新的な Timeframe Selector 機能を利用して、このツールは複数のタイムフレームにわたる市場動向の包括的なビューを提供し、正確な取引選択を支援します。 詳細なMT5バージョンはこちら: SnR Retest and Break MT5 Multi Timefra
XAU Scalper MT4 MT5 バージョン ゴールドペアにおける 短期的な価格変動 を観察するための分析ツール。 XAU Scalper インジケーターは、ローソク足の安定性、RSI、および短期的な勢いに基づいて 売買シグナル を提供します。これは、トレーダーが XAU ペアの短い市場変動中に 潜在的なエントリーポイント を特定するのに役立つように設計されています。 特徴 ローソク足安定性指数 ( Candle Stability Index ): ローソク足の実体とヒゲの比率を測定し、値動きの信頼性を評価します。 RSI 指数 ( RSI Index ): 相対的な強さを追跡し、潜在的な買われすぎまたは売られすぎの状態を示します。 ローソク足デルタ長 ( Candle Delta Length ): 方向性の変化を検出するために分析される直近のローソク足の数を定義します。 シグナルフィルタリング ( Signal Filtering ): 集中したチャート分析のために、繰り返しの警告を回避するオプション。 アラート ( Alerts ): ポップアップ、サウンド、メール、およ

インジケーターには 2 つの部分が含まれています。
パート I: カラーキャンドルが主要なトレンドを示す
カラーローソク足とは、ローソク足の色で相場の状態を識別することです。
スクリーンショットに示されているように、色がアクアの場合、市場はロング注文を発注するか、ショート注文を終了する必要がある状態です。色がトマトの場合は、ショート注文を行うか、ロング注文を終了する時期です。
色が変化している場合は、その完了を (現在のバーが閉じるまで) 待つことをお勧めします。
パート II: バンドを描く
内側のバンドは安全領域として定義され、外側のバンドはクローズオーダー用です。
以下のような取引戦略:
色がアクアで、価格が内側のバンド内にある場合は、ロング注文を出します。価格が外側のバンドを超えたら、注文を閉じる時期です。 色がトマトで、価格が内側のバンドにある場合は、ショート注文を出します。価格が外側のバンドを越えたら、注文を閉じる時期です。 注:価格が内側のバンドの場合のみエントリーマーケットです。これは非常に重要です。
入力パラメータ ShowColorCandle

The intention of the dashboard is to provide a quick overview of the daily, weekly and monthly range of configured assets. In "single asset mode" the dashboard shows you possible reversal points directly in the chart, thus making statistics directly tradable. If a configured threshold is exceeded, the dashboard can send a screen alert, a notification (to the mobile MT4) or an email. There are various ways of using this information. One approach is that an asset that has completed nearly 100% of
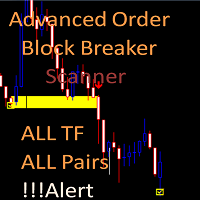
Advanced Order Block Breaker Scanner
This Scanner is free to download but is dependent on you owning the advance order block breaker indicator. Need to purchase the indicator here: https://www.mql5.com/en/market/product/59127
MT5 version: https://www.mql5.com/en/market/product/62769
The Scanner will show you on a single chart all the timeframes (M1 to Monthly) with their own status for the indicator: advance order block breaker Scan all time frame and all symbol: breaker's smart algor
FREE
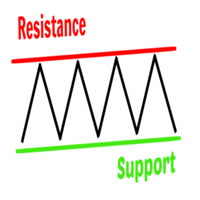
Support and resistance levels are the key factors that determine the price movement from one zone to another. They are levels for trend reversal/breakout signals forex traders look out for before making a trade decision. The Support and Resistance Indicator is a custom trading tool for MT4 developed to plot support/resistance zones from past price actions. The indicator also helps a trader evaluate optimal zones to place a BUY/SELL order or to exit a trade. In other words, it assists traders to
FREE

This masterpiece blends cutting-edge Advance MA, HMA, and Momentum logic into stunning gold star signals, giving you the power to spot market shifts without the guesswork. Perfect for every trader—beginner or expert—this tool turns your XAUUSD charts into a goldmine of opportunity. Don’t just trade—thrive!
Why You’ll Love It
Crystal-Clear Signals : Gold star alerts highlight key market moments, guiding your decisions with ease. Smart Moving Average : Pair with the Advance MA to confidently de
FREE
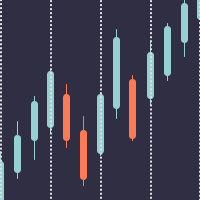
Better Period Separators For MetaTrader 4 The built-in period separators feature doesn’t allow users to specify the time period, so you can use this indicator to create more customizable period separators. On intraday charts, you could place period separators at a specific time, you could also place extra period separators at a specific time on Monday to mark the start of a week. On higher timeframe charts, this indicator works the same as the built-in period separators, On the daily chart, peri
FREE
トレーダーに市場のダイナミクスと取引機会に関する貴重な洞察を提供する強力なテクニカル指標である、 Awesome Oscillator Alert の紹介です。包括的な機能とユーザーフレンドリーなインターフェイスを備えたこのインジケーターは、市場で優位性を獲得したいトレーダーにとって不可欠なツールです。
Awesome Oscillator Alert の際立った機能の 1 つは、すべての通貨ペアと時間枠との互換性です。主要通貨ペアでもエキゾチック通貨でも、このインジケーターは取引戦略にシームレスに統合できます。さらに、ユーザーフレンドリーなインターフェイスによりパラメータを簡単にカスタマイズできるため、個々の取引の好みに合わせてインジケーターをカスタマイズできます。
リアルタイムのアラートは取引を成功させるための重要な要素であり、Awesome Oscillator Alert はそれらを正確に提供します。ポップアップ、サウンド、モバイル アラートを介して即座に通知を受け取り、重要な入退出信号を常に通知します。このリアルタイムのフィードバックにより、タイムリーな取引決定を行い

The Simple ICT Concepts Indicator is a powerful tool designed to help traders apply the principles of the Inner Circle Trader (ICT) methodology. This indicator focuses on identifying key zones such as liquidity levels, support and resistance, and market structure, making it an invaluable asset for price action and smart money concept traders. Key Features Market Structure : Market structure labels are constructed from price breaking a prior swing point. This allows a user to determine t
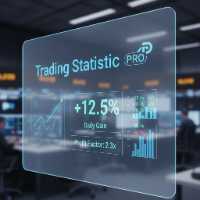
The statistical indicator for the metatrader 5 TradingStatisticPro collects statistical data on your trade, which makes it easier to assess the effectiveness of trading, the profit received and the risks. The indicator is compactly placed in the corner of the main chart of the terminal and displays the following information: 1. The profit earned. 2. Maximum drawdown. 3. The recovery factor. 4. Profit factor. 5. The ratio of profitable and unprofitable transactions (winrate). 6. Average profit a
FREE

The Silent Edge of Smart Money
"It's not about how much you do, but how much love you put into what you do that counts." – Mother Teresa
They say the real money in trading is made in the shadows—where inefficiencies hide and only the most perceptive capitalize. That’s exactly where the Arbitrage Thief Index (ATI) thrives. For years, this tool has been my personal advantage , silently identifying low-risk, high-reward trades before the crowd even notices. It’s the kind of edge top fund managers

It would be good to always be aware of the "struggle" between buyers and sellers. Then it would be much easier to determine the best direction to go in order not to lose out. This indicator offers an original solution to this problem: the supply and demand values are compared with the High and Low prices for the selected period, thus trying to determine the market movement towards the stronger side without ignoring the strength of the opposite side. All this is displayed in a separate window usi

Indicator. Zones of support and resistance levels The most reliable tool in the hands of any technical analyst is support and resistance levels.It is these levels that magically work in the market, because the price then bounces off them, on the contrary, gaining maximum acceleration, punching them and striving for a new price point.However, in practice, many beginners face enormous difficulties in building them.This is due to the fact that the price may react quite differently to them, and ofte
FREE

With this easy to set up indicator you can display and set alerts for the following candlestick formations: Bull Breakout, Bear Breakout, Hammer, Pin, Bullish Engulfing, Bearish Engulfing. I'd appreciate if you would review the indicator
Input parameters: ShortArrowColor: The color of the Arrows, displaying a Bearish candle formation LongArrowColor: The color of the Arrows displaying a Bullish candle formation BullishEngulfing: Disabled/Enabled/EnabledwithAlert BearishEngulfing: Disabled/Enab
FREE

Based on famous and useful indicator - Super Trend, we add some features to make this Indicator much easier to use and powerful. Ease to identify the trend of any chart. Suitable for both Scalping & Swing Better to use in the trending market be careful in sideway market, it might provide some fake signals Setting: ATR Multiplier ATR Period ATR Max Bars (Max 10.000) Show UP/DOWN node Nodes size Show Pull-back signals Pull-back filter ratio Period of MA1 Mode of MA1 Period of MA2 Mode of MA2 A
FREE

With this system you can spot high-probability trades in direction of strong trends. You can profit from stop hunt moves initiated by the smart money!
Important Information How you can maximize the potential of the scanner, please read here: www.mql5.com/en/blogs/post/718109 Please read also the blog about the usage of the indicator: Professional Trading With Strong Momentum This FREE Version of the indicator works only on EURUSD and GBPUSD. The full version of the indicator can be found here:
FREE

機関投資家向け流動性圧縮インジケーター このインジケーターは、ボリンジャーバンドの幅、出来高、平均スプレッドを正規化してリアルタイムで流動性の引き締まりを測定し、価格ブレイクアウト前の圧縮フェーズを検出します。 表示:
プロフェッショナル仕様の独立ウィンドウに「Compression Score」ヒストグラムと「Threshold」基準線を表示。 主な特徴 早期検出: 価格の急変前に圧縮ゾーンを特定。 多要素分析: 正規化されたボリンジャーバンド幅、出来高、平均スプレッドを組み合わせ。 リアルタイム更新: 現在のバーでティックごとに更新。 明確な可視化: 「Compression」ヒストグラムと点線の「Threshold」ライン。 互換性: MT4 および MT5 に対応。 使用方法 対象銘柄のチャートにインジケーターを追加します。 ボラティリティやセッションに合わせて閾値と重みを調整します。 解釈: スコアが高い場合は流動性圧縮フェーズを示します。価格のブレイクアウトを注視してください。 パラメーター BB_Period / BB_Dev: ボリンジャーバンド幅の計算。 Norm_

''Trendlines'' is an Indicator, that every Trader need and shows Trendline and Support and resistance levels in all Timeframe's. Also In 1-hour, 4-hour and daily time frames and Current timeframes, support, and resistance levels are specified and trend lines are drawn so that the trader can see all levels on a chart. In Properties it is possible to turn off unnecessary Lines.
In ' Tendency indicator '' , as full package of Predictions that every Trader need, there is also the Predict
FREE

Some short but nice algo giving signals and some ideas for stops. Five moving averages are used to find cross overs and create a zone. All periods and methods are adjustable but default values are optimized already. If you have lags on long history you can reduce MaxBars to make it work faster. Please comment if need to explain the parameters. Also any improvement ideas are welcome.
FREE

* All Symbols x All Timeframes scan just by pressing scanner button ** *** Contact me to send you instructions and add you in "Candle Scanner group" for sharing or seeing experiences with other users. Introduction: Candles tell their story. When looking at a candle, it’s best viewed as a contest between buyers and sellers. Candlestick patterns are used to predict the future direction of price movement. Candlesticks are an easy way to understand the price action. You can use candlesticks to decid
FREE
XE Forex Strengh Indicator MT4 displays visual information about direction and strength of a signal for current pair and chosen timeframes (M5, M15, M30 and H1). Calculations are based on multiple factors and results are shown as a colored panel with scale bar, numerical values and arrows. There are also displayed values of current price and spread on the pair. There can be activated an alert (as a mail or pop-up window with sound) for each available timeframes which send a message when the dir
FREE

Detailed blogpost: https://www.mql5.com/en/blogs/post/766378
Key Features
Adaptive Upper/Lower bands Smooth Center Line Customizable Length (sensitivity) Non-Repainting (only current ongoing bar is updated every "Refresh After Ticks" number of ticks) Multiple Price Sources - Choose from close, open, high, low, median, typical, or weighted close Components:
The Basis Line The smooth center line represents the weighted average of price. Think of this as the "true" price level when all the noise
FREE

This indicator signals about crossing of the main and the signal lines of stochastic (lower stochastic) in the trend direction which is determined by two stochastics of higher time frames (higher stochastics). It is not a secret that stochastic generates accurate signals in a flat market and a lot of false signals in a protracted trend. A combination of two stochastics of higher time frames performs a good filtration of false signals and shows the main tendency. The indicator is recommended for
FREE

I recommend you to read the product's blog (manual) from start to end so that it is clear from the beginning what the indicator offers. This multi oscillator, multi time frame and multi symbol indicator identifies when a divergence occurs between price and an oscillator/indicator. It identifies both regular/classical (trend reversal) and hidden (trend continuation) divergences. It has moving average, RSI/Bollinger, ADX, pin bar and engulfing filter options which makes it possible to filter

H I G H - P R O B A B I L I T Y - B R E A K O U T T R E N D L I N E I N D I C A T O R This is no ordinary trendline indicator. It has a highly-probability algorithms incorporated in the script to display only trendlines that may give a very high chance of price breakout. The indicator is not a stand alone indicator. Trader should interpret it together with their very own analysis technique to come up with a more efficient trading strategy. You can use with it other trend indica
FREE
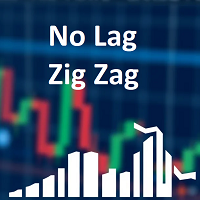
Classic ZigZag formula. But no lags and repaints. You can see on screenshots that it shows values between peaks and it is useful to test strategies based on indicator. Because sometimes people find a good idea about it but don't understand that repainting indicators have some things to keep in mind. The parameters are the same as original ZigZag indicator: Depth, Deviation and Backstep.
FREE

Please check the " What's new " tab regularly for a complete and up-to-date list of all improvements + parameters. FREE indicator for my trading utility Take a Break . This indicator allows you to manage multiple other EAs with just one Take a Break EA instance. Simply specify the corresponding Chart Group in the indicator(s) and Take a Break EA settings and you are good to go.
Setup examples (Indicator + EA)
As a prerequisite, add the URL https://trading.custom-solutions.it to the list of al
FREE
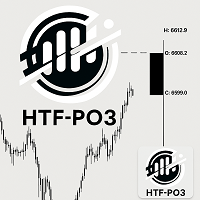
HTF Power of Three (ICT) - MT4 Indicator Overview The HTF Power of Three indicator is a professional implementation of the Inner Circle Trader's (ICT) Power of Three concept, inspired by Larry Williams. This indicator visualizes higher timeframe (HTF) candle development in real-time on any lower timeframe chart, making it an essential tool for ICT traders who study institutional price movement patterns. What is Power of Three (PO3)? Power of Three represents a three-staged Smart Money campa

It is a custom non-repaint indicator to identify trade opportunities in swing action as prices move within an upper and lower band. Inspired by the Keltner Channel, the most popular channel Indicator introduced by Chester Keltner. It is different with a Bollinger Bands. It represents volatility using the high and low prices, while Bollinger's studies rely on the standard deviation. The algorithm for this indicator is also available in the EntryMaximator EA. Including the option to use it or not.
FREE
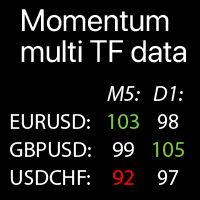
選択したシンボルのマルチタイムフレームモメンタム値:現在の市場トレンドを比較 この インジケーター は、 選択した すべての タイムフレーム と シンボルの モメンタム インジケーター の 値を 1つの テーブルに 表示し、 現在の 市場 価格 トレンドを すばやく 分析 できます。
私の 多機能ツール : 66+ 機能 | ご質問は お問い合わせください | MT5版 各 シンボル はカスタマイズ可能です:削除/置換。最大40シンボルまで追加できます。 パネルはチャート上の任意の場所に移動できます(ドラッグしてください)。
設定 で以下を構成できます: モメンタムインジケーター設定: 期間、適用価格タイプ 。 各タイムフレーム を有効/無効にできます 。 ハイライト オプション:有効にすると、キーレベルがカスタムカラーで強調表示されます。 極値(キーレベル) : 高値と低値; アラート : 極値レベルで有効にできます:高モメンタム / 低 モメンタム / 両方。 視覚的 スタイル:サイズ、ダーク/ライトテーマ、ハイライトカラー。 モメンタム指標 (
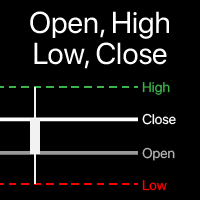
チャート上の 始値、高値、安値、終値 レベルの 可視化 任意の 時間枠 を選択 でき、 現在の 時間枠 だけでなく 。 計算 バーの オフセット は 調整可能: 現在 (フローティング) バー, または 設定 された 数の 過去 バー 。 多機能ユーティリティ : 66+機能を含む | 質問がある場合は連絡してください | MT5バージョン インジケーターの設定で以下を設定できます: 計算バーの オフセット : 0 = 現在のバー, 1 = 前のバー, 2 = 2バー前... " 複数のバーを含める "オプション:
もし > 0: ならば 複数の バーが 結合され 最高値と 最安値を 決定します。 計算された 時間枠 。 各レベル(OHLC)は 個別に有効/無効 にできます。 ラインの 可視化 : 色、スタイル、サイズ、背景オプション。 追加 情報: 無効に可能; ライン価格のみ; ライン情報のみ; 両方: 情報 + 価格; フォント サイズとスタイル('追加情報'が有効な場合)。 プログラムフ

VR ティックは、 スキャルピングベースの戦略のための特別なインジケーターです。このインジケーターのおかげで、トレーダーは金融商品のメインチャート上でティックチャートを直接見ることができます。ティック チャートを使用すると、できるだけ正確に市場にポジションを入力したり、市場でポジションを決済したりできます。 VR Ticks は、方向に応じて色が変わる線の形で目盛りデータをプロットします。これにより、目盛りの状況を視覚的に理解し、評価することができます。ティック チャートの利点は、時間枠を考慮せず、価格の変化に基づいて構築されることです。 VR Ticks は可能な限り最小限のチャートを作成します。 設定、設定ファイル、デモ版、説明書、問題解決方法は [ブログ] でご覧いただけます
[リンク] でレビューを読んだり書いたりできます。
[MetaTrader 5] のバージョン ティックは 1 つの値動きです。 1 つの価格変動に対して、価格は 1 ポイントまたは数ポイント変化する可能性があります。 ティックは動きである ことを理解することが重要です。 このインジケーターには、右下にアス
FREE

Check my p a id tools they work perfect! "Period Cross RSI" Is a New indicator idea that shows crosses of two RSI lines with different periods which creates ascending and descending zones for confirmation of long and short trading. This indicator is brend new and will be upgraded further, for now I recommend to use it as a confirmation, filter indicator for determination of long/short trading zones, not as a signaler indicator for now. Further upgrades can make it as a signaler indicator as w
FREE

ブルとベアの強さインジケーター 更新 1.3
ブルとベアには、指定されたバー範囲内で最も強いボリュームの領域を検出するための内蔵のボリュームプロファイルが追加されました。この設定は、ブルとベアの強さを最高ボリュームで専門的に検出するために、さらにカスタマイズできます。
これにより、以下のような利点があります: 早期の検出と精密なエントリーの機会 反転の検出 戻り(リトレースメント)の検出 概要:
ブルとベアの強さインジケーターは、トレーダーに決定的な優位性を提供するために設計された、柔軟で直感的なツールです。このインジケーターは、ブルとベアの力のバランスを捉え、あらゆる時間足やインストゥルメントにおける市場のセンチメントと勢いに関する実行可能な洞察を提供します。ブルとベアの強さインジケーターは、モメンタムとボリュームがピークに達した領域を視覚化します。レンジ内で強さの領域を強調表示します。シンプルでありながら強力な機能を持つインジケーターで、市場の全体的な視点を提供し、強力な反転の潜在的なチャンスを捉えることができます。 作成者からのメッセージ このインジケーターを作った理由:

Round Numbers Levels indicator for MT4 Round Numbers indicator is a simple but useful indicator to draw 00 and 50 price levels in your chart.
These levels act as supports and resistances, and therefore should be taken into account when trading.
These levels can be used as profit targets or entry points.
Inputs of the indicator are:
TGridColor00: color to be used for xx00 levels GridStyle00: line style to be used for xx00 levels GridWidth00: line width to be used for xx00 levels GridColor50:
FREE

What is the ADX_DI Indicator? ADX_DI is an advanced technical analysis indicator developed for MetaTrader platform. It combines Average Directional Index and Directional Indicator components to analyze market trend strength and direction. What Does It Do? Measures Trend Strength : ADX line shows the strength of market trends Determines Direction : DI+ (green) and DI- (red) lines identify trend direction Detects Trend Changes : DI+ and DI- crossovers provide trend reversal signals Automatic Alert
FREE

The Donchian channel is an indicator that takes a series of user-defined periods and calculates the upper and lower bands. Draw two lines on the graph according to the Donchian channel formula. This straightforward formula is based on:
The top line is the highest price for the last periods n The bottom line is the lowest price for the last periods n
Trend systems follow periods when support and resistance levels are broken. in this case when the price breaks the upper line or the lower line o
FREE
Advanced UT BOT ALERTS for MT4 プロフェッショナル多重フィルター型トレンド検出システム|強化版 UT BOT エンジン 私たちは高品質なインジケーターのみを提供します。 Advanced UT BOT はプロフェッショナル向けに設計されており、安定したシグナルロジックと安全な計算構造によって遅延や誤更新を防止します。
過去のシグナルを 再描画・修正・削除することはありません 。
すべての BUY / SELL シグナルは ローソク足の確定後に生成され固定されます 。
リアルタイム取引中に 再描画は一切なく 、足が確定した時点で即座に表示されます。
期間限定オファー — 次回価格は 49 ドルになります。
価格が上がる前に今すぐ入手してください。 製品概要 Advanced UT BOT ALERTS は、 UT BOT のコアロジックに基づいて再構築された次世代のトレンドシグナルシステムです。
MT5 に完全対応し、複数のフィルター、動的ビジュアル化、高精度アラートを統合しています。
UT Bot インジケーターはもともと Yo_adrii
Precision Entry Arrows: Never Miss a High-Probability Trade Again! Stop guessing and start trading with confidence. The Precision Entry Arrows indicator is a sophisticated, all-in-one tool designed to deliver high-quality, non-repainting Buy and Sell signals directly on your chart. It expertly combines the power of MACD , Stochastic , and a unique EMA 5 Cross to pinpoint exact entry moments , then filters everything through a long-term EMA 200 to ensure you are always trading with the major tre
FREE

Simple ATR Stop Loss :市場のボラティリティを示す羅針盤です。トレーディングの荒波を乗り切り、より賢い ストップロス を設定し、トレーディングの忍者のように見せてくれます(マントは含まれません)。 トレーディング愛好家と市場の達人の皆さん、注目してください! Simple ATR Stop Loss インジケーターの登場です – 荒々しいトレーディングの世界における新しい親友です。 2ピースパズルよりも簡単で、カフェイン漬けの牛が陶器店に入ったときよりも強力です。 ATRトレーディングチートシート(または市場の波に乗って沈まない方法)️: ATR:市場のムードデコーダー ️️ ATRを市場のTwitterフィードだと考えてください。高い値?ツイートの嵐モードです。 低い値?サイレントモードです。 この情報を使って、飛び込むか岸から見守るか決めましょう。️ サイジングと狙いを正確に ATRをあなたのトレーディングの仕立て屋とターゲット練習のコーチにしましょう。 弟や妹の服を着ているような感
FREE

All-in-one trading powerhouse: trend, reversal, and exhaustion detection
This indicator is a personal implementation of the famous Traders Dynamic Index, which uses RSI, moving averages and volatility bands to find trends, reversals and price exhaustions. However, this particular implementation supports not only RSI, but many others. It is suitable for scalping, day trading, and swing trading and aims to provide a full picture of the current market conditions. [ Installation Guide | Update Guid
FREE

BuySell Volume is an indicator that approximates Buy and Sell volumes based on price movement. Input Description: applied_model: Choose the applied model. In low reversal mode, price is considered receive low bearish pressure during bullish candle's creation (high bearish pressure on high reversal model. In other words, Bullish Marubozu candles has really high Buy Volumes in low reversal model than in high reversal one.
Output Description: Buy and Sell Volume: Determines how many Buy and Sell vo
FREE

THE PRICE ACTION INDICATOR! This program finds candlestick absorption patterns and a false breakdown, after which it draws the entry points with arrows.
Input parameters:
1. PPR_Arrow The On parameter/Off display of the absorption model arrows. By default, it is set to true.
2. FB_Arrow Everything is the same as the first parameter, only for false breakdown models. By default, it is set to true.
Sincerely, Novak Production.
FREE
MetaTraderマーケットは、他に類のない自動売買ロボットやテクニカル指標の販売場所です。
MQL5.community ユーザーメモを読んで、取引シグナルのコピー、フリーランサーによるカスタムアプリの開発、支払いシステムを経由した自動支払い、MQL5Cloud Networkなど、当社がトレーダーに対して提供するユニークなサービスについて詳しくご覧ください。
取引の機会を逃しています。
- 無料取引アプリ
- 8千を超えるシグナルをコピー
- 金融ニュースで金融マーケットを探索
新規登録
ログイン