Regardez les tutoriels vidéo de Market sur YouTube
Comment acheter un robot de trading ou un indicateur
Exécutez votre EA sur
hébergement virtuel
hébergement virtuel
Test un indicateur/robot de trading avant d'acheter
Vous voulez gagner de l'argent sur Market ?
Comment présenter un produit pour qu'il se vende bien
Indicateurs techniques pour MetaTrader 4 - 18

Indotrend is a Smart indicator to detects the Trend and also view support & resistance, multiple timeframe to get validate the trend. it can be use for Forex,Index,Metal,Stock and Crypto. Parameters: Alerts - show popup alert message on Metatrader Hi Lo H1 Timeframe - Show LIne Hi/Low Price base on H1 timeframe Show Fibonaci level - Show Fibonaci retracement level
Show Support Resistance, - Show Support & Resistance H1 timeframe.
FREE

This indicator presents an alternative approach to identify Market Structure. The logic used is derived from learning material created by DaveTeaches (on X) Upgrade v1.10: add option to put protected high/low value to buffer (figure 11, 12)
When quantifying Market Structure, it is common to use fractal highs and lows to identify "significant" swing pivots. When price closes through these pivots, we may identify a Market Structure Shift (MSS) for reversals or a Break of Structure (BOS) for co

Descption: The Volume Profile displays detailed informations of historical trading activities at certain price levels (Market Profile). So you can locate the areas with the best prices in the market and get an advantage about other market participants.
Features: Customizable Volume Profile / Market Profile Shows the "fair" Value Area with 70% of all Volume
Shows critical low volume zones
Shows VPOC, VAL and VAH Points Works on all timeframes Also available for MT5 ( https://www.mql5.com/en/mark

L'indicateur AIS Correct Averages vous permet de définir le début d'un mouvement de tendance sur le marché. Une autre qualité importante de l'indicateur est un signal clair de la fin de la tendance. L'indicateur n'est pas redessiné ou recalculé.
Valeurs affichées h_AE - limite supérieure du canal AE
l_AE - limite inférieure du canal AE
h_EC - Valeur prédite haute pour la barre actuelle
l_EC - Valeur prédite basse pour la barre actuelle
Signaux lors du travail avec l'indicateur Le signal pr

Balance Levels est un indicateur de trading facile à utiliser qui fournit des signaux clairs d’achat et de vente ainsi que des niveaux de prix dynamiques, aidant les traders à planifier leurs entrées et sorties avec plus de confiance. L’outil est très flexible – il peut être utilisé comme stratégie autonome ou intégré dans n’importe quel système de trading existant. Il fonctionne sur toutes les unités de temps et sur tous les marchés : Forex, Or, Indices, Cryptomonnaies ou Actions. Balance Level
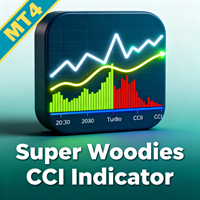
Améliorez votre avantage en trading avec le Super Woodies CCI Indicator MT4, un oscillateur de momentum avancé inspiré du célèbre système Woodies CCI de Ken Wood, qui a gagné en popularité au début des années 2000 parmi les day traders pour son approche dual-CCI visant à repérer les patterns cycliques et setups à haute probabilité. Largement apprécié par les traders forex, actions et commodities, cet indicateur exploite le Commodity Channel Index (CCI) pour détecter les conditions de surachat/su

L' Exit Area Ultimate est un indicateur technique conçu pour améliorer les décisions de trading en indiquant les niveaux quotidiens Average True Range (ATR) et Average Daily Rate (ADR) sur le graphique. En comprenant ces niveaux, les traders peuvent facilement évaluer le mouvement moyen d'un actif tout au long de la journée. Cet indicateur polyvalent sert à plusieurs fins pour les day traders, aidant au placement d'ordres, identifiant les tendances intrajournalières, fixant des nivea

The Colored MACD indicator is a versatile and powerful tool designed to enhance your technical analysis by providing an intuitive visualization of market momentum and trend changes. Built on the foundation of the popular Moving Average Convergence Divergence (MACD) indicator, this version introduces color-coded histograms to easily distinguish between bullish and bearish momentum. Key Features: Color-Coded Visualization : The indicator features a lime-colored histogram when the MACD is above the
FREE

Améliorez votre précision commerciale avec l'indicateur WaveTrend Oscillator Indicator MT4, un outil basé sur le momentum adapté du script iconique de LazyBear de 2014 sur TradingView, renommé pour sa précision dans la détection des reversions de marché et des changements de momentum. Célébré largement dans la communauté du trading depuis plus d'une décennie, cet oscillateur combine des éléments similaires à RSI et MACD pour détecter les conditions de surachat/survente, en faisant un élément ess

. Simple Trading System Update !!! Follow this link to see our Strategy !!! (With auto trade indicator)
Description This is an indicator Free Version and showing only history signals, Not real time. Binary Deal Trading Indicator is an indicator on MT4 for Binary Option Trading. It forecasts the overbought / oversold level, Reversal and Fractal point. This indicator will help you to decide a reversal price on any time frame (Recommend M1, M5 and M15). The expiry time is 5-15 minutes after rec
FREE

Full Stochastic - is Stochastic Oscillator which displays all three essential lines: %K Slow K %D Standard Stochastic Oscillators displays only Slow K and %D.
Why it is important to analyze all three lines in SO? Standard SO users must choose if they want to use fast or slow SO. In case of fast SO traders set the slowing parameter typically to 1 or 2, or if they want to use slow SO, they set the slowing parameter usually to 3 or more. With Full Stochastic you can have both!
Full Stochastic Par
FREE

The tool is used to calculate the size of the position that can be opened with the previously assumed risk. The risk can be defined as: percentage value of the account (%), nominal value, expressed in the account currency. The size of position is determined by the distance of the planned SL (red line).
Input Parameters Lost_in_Money - if true, the value of the acceptable loss is determined by the parameter "Acceptable_loss", else acceptable loss is determined by the parameter "Acceptable_Risk_P

Tableau de bord Ichimoku Multicurrency Scanner MT4 est un outil de trading puissant conçu pour surveiller plusieurs paires de devises et cadres temporels à l'aide de l'Ichimoku Kinko Hyo. Il organise les signaux dans un format de grille, avec des symboles regroupés par devises de base et cadres temporels, allant de M1 à MN1. Les traders peuvent activer ou désactiver des cadres temporels spécifiques pour adapter leurs stratégies. L'outil affiche les signaux basés sur les stratégies suivantes : Ki
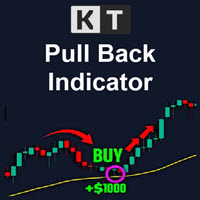
KT Pull Back Arrows affiche des flèches de repli en utilisant l'indicateur RSI (Relative Strength Index) pour identifier les zones de repli idéales dans les zones de surachat et de survente. L'indicateur permet de détecter avec précision les meilleurs moments pour entrer en position lors de retracements de tendance. Le trading de tendance est souvent considéré comme la stratégie la plus rentable sur le marché du Forex. Cela revient à suivre la vague, à aller dans le sens du flux et à tirer parti

KT MACD Alerts est une version personnalisée de l’indicateur MACD standard disponible sur MetaTrader. Il génère des alertes et trace également des lignes verticales lors des deux événements suivants : Lorsque le MACD croise au-dessus de la ligne zéro. Lorsque le MACD croise en dessous de la ligne zéro.
Fonctionnalités Intègre un scanner MTF (multi-timeframe) qui affiche la direction du MACD sur tous les horizons de temps. Parfait pour les traders qui exploitent les croisements du MACD au-dessu
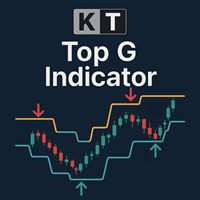
KT Top G est un indicateur basé sur l'action des prix qui combine une analyse intelligente de canaux pour identifier les sommets et creux potentiels du marché. Lorsqu'une possible inversion est détectée, il affiche de grandes flèches claires sur le graphique afin de vous prévenir avant que le marché ne change de direction. Grandes flèches : Mettent en évidence les sommets et creux de forte probabilité en détectant l'épuisement des prix et les changements de momentum. Petites flèches : Indiquent

Niveaux de Stop Out et de Margin Call – Votre assistant en gestion du risque Prenez le contrôle total de votre risque de trading avec cet indicateur qui affiche dynamiquement les niveaux clés sur votre graphique : Stop Out, Appel de marge, Marge libre, et un niveau personnalisé. Parfait pour les traders utilisant un effet de levier élevé ou des stratégies tout-en-un, où chaque pip compte et la marge d’erreur est minime. Entièrement personnalisable – définissez la couleur, le style, l’épaisseur e

L'une des séquences de numéros s'appelle « Séquence des incendies de forêt ». Il a été reconnu comme l'une des plus belles nouvelles séquences. Sa principale caractéristique est que cette séquence évite les tendances linéaires, même les plus courtes. C'est cette propriété qui a constitué la base de cet indicateur. Lors de l'analyse d'une série chronologique financière, cet indicateur essaie de rejeter toutes les options de tendance possibles. Et seulement s'il échoue, il reconnaît alors la prés
L' indicateur de zone FVG est un outil puissant conçu pour identifier les écarts de juste valeur (FVG) sur le marché, en mettant en évidence les déséquilibres de prix entre la juste valeur et le prix du marché. Cette identification précise des écarts permet aux traders de repérer les points d'entrée et de sortie potentiels du marché, améliorant considérablement leur capacité à prendre des décisions de trading éclairées. Grâce à son interface intuitive et conviviale, l'indicateur de zone FVG
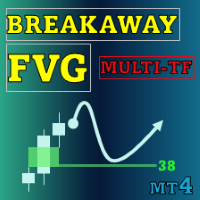
Special offer : ALL TOOLS , just $35 each! New tools will be $30 for the first week or the first 3 purchases ! Trading Tools Channel on MQL5 : Join my MQL5 channel to update the latest news from me L'outil Breakaway Fair Value Gaps (FVG) est une solution de pointe conçue pour permettre aux traders d'identifier les zones où le prix s'est éloigné de l'équilibre, offrant des analyses approfondies sur les probabilités de correction. Cet outil ne se contente pas de mettre en évidence de

L'indicateur Boom and Crash Spike Detector est codé sur la base d'une stratégie avancée principalement pour détecter le Boom and Crash dans les prix. Des algorithmes complexes ont été implantés pour détecter les booms et les crashs à haute probabilité dans les prix. Il alerte sur d'éventuelles phases de Boom ou crash :
Phase de Boom : Lorsque le prix augmente trop vite. Crash Phase : Lorsque le prix baisse trop vite.
OFFRE À DURÉE LIMITÉE : L'indicateur est disponible pour seulement 30$ et à v

Introduction to Fractal Moving Average Fractal Moving Average indicator was designed as part of Fractal Pattern Scanner. Inside Fractal Pattern Scanner, Fractal Moving Average Indicator was implemented as multiple of chart objects. With over thousands of chart object, we find that it was not the best and efficient ways to operate the indicator. It was computationally too heavy for the indicator. Hence, we decide to implement the indicator version of Fractal Moving Average indicator to benefit o
FREE
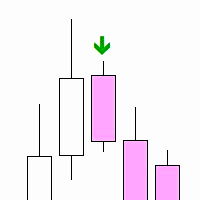
"Inside Bar PA" is a technical indicator designed to determine the inner bars on the chart. An internal bar is a bar or candle, the maximum and minimum of which are completely contained in the previous bar. This may signal a potential reversal or continuation of the trend, depending on the context.
Features: Automatic detection of internal bars. Visual marking of internal bars with arrows on the chart. The ability to adjust the distance of the mark from the bar. How to use: Attach the indicato
FREE

Moving Average Trend Alert is a triple MA indicator that helps traders to identify potential market trends based on 3 MAs alignment and crossover.
Moving Average Trend Alert features: Customizable short-term, medium-term, and long-term MAs. Option to filter signals based on a minimum distance between moving averages to avoid premature MAs alignment. Optional Filter of signals with RSI indicator overbought/oversold levels. Optional Filter of signals with ADX indicator. Popup, email, and phone no
FREE

Volume Delta is a very powerful indicator that reads the supply on the Market. It calculates the Delta from movement of the price and the difference of BUY and SELL Tick volumes. Its special structure allows you to get all timeframe values available on the MT4 platform. A good observation of this instrument can suggest great entry points and possible reversal. We are confident that this tool will help you to improve your trading timing. See also for MT5: https://www.mql5.com/en/market/product/5
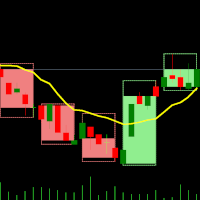
Indicateur Double Time Frame – Bougies dans les Bougies pour MT4 Vue d'ensemble L'indicateur « Bougies dans les Bougies » est un outil de visualisation multi-timeframes conçu spécialement pour MT4. Il superpose des bougies d’un timeframe supérieur sur un graphique d’un timeframe inférieur, vous permettant de voir comment les petites bougies se comportent à l’intérieur des grandes. Cette approche améliore l'analyse de la structure du marché, affine l'identification des tendances et clarifie l'act
FREE

Lot Size Calculator – Outil de dimensionnement des positions Cet indicateur calcule la taille du lot en fonction du pourcentage de risque sélectionné et de la distance du stop loss. Il est conçu pour le trading sur Forex, métaux, indices, matières premières et cryptomonnaies.
Fonctionnalités principales Calcul de la taille de position basé sur le solde du compte / l’équité disponible et le pourcentage de risque choisi Modes ordre au marché et ordre en attente Lignes visuelles sur le graphique :
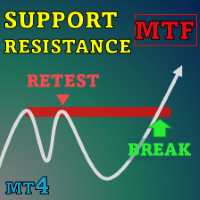
Special offer : ALL TOOLS , just $35 each! New tools will be $30 for the first week or the first 3 purchases ! Trading Tools Channel on MQL5 : Join my MQL5 channel to update the latest news from me Dans le paysage en constante évolution du trading financier, identifier et analyser avec précision les niveaux de support et de résistance est essentiel pour prendre des décisions d'investissement éclairées. SnR Retest and Break Multi-Timeframe est un indicateur de support et de résistan
XAU Scalper MT4 Version MT5 Un outil analytique pour observer les mouvements de prix à court terme sur les paires d'or. L'indicateur XAU Scalper fournit des signaux d'achat et de vente basés sur la stabilité des bougies, le RSI et le momentum à court terme. Il est conçu pour aider les traders à identifier les points d'entrée potentiels pendant de brefs mouvements du marché sur les paires XAU. Fonctionnalités Indice de Stabilité des Bougies ( Candle Stability Index ): Mesure la proportion entre l

L'indicateur comprend deux parties. Partie I : Les bougies colorées montrent la tendance majeure Les bougies colorées permettent d'identifier l'état du marché grâce à des chandeliers colorés. Comme le montrent les captures d'écran, si la couleur est Aqua, le marché est dans une situation où vous devez placer des ordres longs ou sortir des ordres courts. Si la couleur est Tomate, c'est le moment de placer des ordres courts ou de sortir des ordres longs. Si la couleur change, il est préférable d'a

The intention of the dashboard is to provide a quick overview of the daily, weekly and monthly range of configured assets. In "single asset mode" the dashboard shows you possible reversal points directly in the chart, thus making statistics directly tradable. If a configured threshold is exceeded, the dashboard can send a screen alert, a notification (to the mobile MT4) or an email. There are various ways of using this information. One approach is that an asset that has completed nearly 100% of
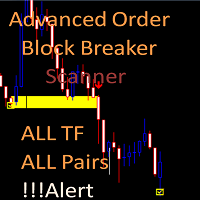
Advanced Order Block Breaker Scanner
This Scanner is free to download but is dependent on you owning the advance order block breaker indicator. Need to purchase the indicator here: https://www.mql5.com/en/market/product/59127
MT5 version: https://www.mql5.com/en/market/product/62769
The Scanner will show you on a single chart all the timeframes (M1 to Monthly) with their own status for the indicator: advance order block breaker Scan all time frame and all symbol: breaker's smart algor
FREE
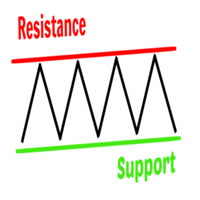
Support and resistance levels are the key factors that determine the price movement from one zone to another. They are levels for trend reversal/breakout signals forex traders look out for before making a trade decision. The Support and Resistance Indicator is a custom trading tool for MT4 developed to plot support/resistance zones from past price actions. The indicator also helps a trader evaluate optimal zones to place a BUY/SELL order or to exit a trade. In other words, it assists traders to
FREE

Simple GoldTrend Signal – Débloquez le Succès du Trading d’Or ! Transformez votre trading d’or avec Simple GoldTrend Signal ! Ce chef-d’œuvre MT4 fusionne une logique de pointe de MA Personnalisée, HMA et Momentum en signaux étoilés d’or saisissants, vous donnant le pouvoir de repérer les changements de marché sans deviner. Idéal pour tous les traders—débutants ou experts—cet outil transforme vos graphiques XAUUSD en une mine d’opportunités en or. Ne vous contentez pas de trader—réussissez ! Po
FREE
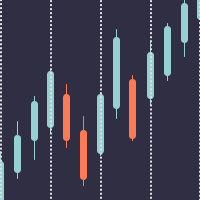
Better Period Separators For MetaTrader 4 The built-in period separators feature doesn’t allow users to specify the time period, so you can use this indicator to create more customizable period separators. On intraday charts, you could place period separators at a specific time, you could also place extra period separators at a specific time on Monday to mark the start of a week. On higher timeframe charts, this indicator works the same as the built-in period separators, On the daily chart, peri
FREE

Présentation de l' Awesome Oscillator Alert , un puissant indicateur technique qui fournit aux traders des informations précieuses sur la dynamique du marché et les opportunités de trading. Avec ses fonctionnalités complètes et son interface conviviale, cet indicateur est un outil essentiel pour les commerçants qui cherchent à gagner un avantage sur le marché.
L'une des caractéristiques les plus remarquables de l'Awesome Oscillator Alert est sa compatibilité avec toutes les paires de devise

The Simple ICT Concepts Indicator is a powerful tool designed to help traders apply the principles of the Inner Circle Trader (ICT) methodology. This indicator focuses on identifying key zones such as liquidity levels, support and resistance, and market structure, making it an invaluable asset for price action and smart money concept traders. Key Features Market Structure : Market structure labels are constructed from price breaking a prior swing point. This allows a user to determine t
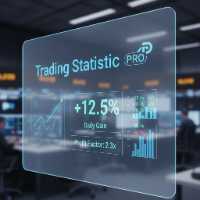
The statistical indicator for the metatrader 5 TradingStatisticPro collects statistical data on your trade, which makes it easier to assess the effectiveness of trading, the profit received and the risks. The indicator is compactly placed in the corner of the main chart of the terminal and displays the following information: 1. The profit earned. 2. Maximum drawdown. 3. The recovery factor. 4. Profit factor. 5. The ratio of profitable and unprofitable transactions (winrate). 6. Average profit a
FREE

The Silent Edge of Smart Money
"It's not about how much you do, but how much love you put into what you do that counts." – Mother Teresa
They say the real money in trading is made in the shadows—where inefficiencies hide and only the most perceptive capitalize. That’s exactly where the Arbitrage Thief Index (ATI) thrives. For years, this tool has been my personal advantage , silently identifying low-risk, high-reward trades before the crowd even notices. It’s the kind of edge top fund managers

It would be good to always be aware of the "struggle" between buyers and sellers. Then it would be much easier to determine the best direction to go in order not to lose out. This indicator offers an original solution to this problem: the supply and demand values are compared with the High and Low prices for the selected period, thus trying to determine the market movement towards the stronger side without ignoring the strength of the opposite side. All this is displayed in a separate window usi

Indicator. Zones of support and resistance levels The most reliable tool in the hands of any technical analyst is support and resistance levels.It is these levels that magically work in the market, because the price then bounces off them, on the contrary, gaining maximum acceleration, punching them and striving for a new price point.However, in practice, many beginners face enormous difficulties in building them.This is due to the fact that the price may react quite differently to them, and ofte
FREE

With this easy to set up indicator you can display and set alerts for the following candlestick formations: Bull Breakout, Bear Breakout, Hammer, Pin, Bullish Engulfing, Bearish Engulfing. I'd appreciate if you would review the indicator
Input parameters: ShortArrowColor: The color of the Arrows, displaying a Bearish candle formation LongArrowColor: The color of the Arrows displaying a Bullish candle formation BullishEngulfing: Disabled/Enabled/EnabledwithAlert BearishEngulfing: Disabled/Enab
FREE

Based on famous and useful indicator - Super Trend, we add some features to make this Indicator much easier to use and powerful. Ease to identify the trend of any chart. Suitable for both Scalping & Swing Better to use in the trending market be careful in sideway market, it might provide some fake signals Setting: ATR Multiplier ATR Period ATR Max Bars (Max 10.000) Show UP/DOWN node Nodes size Show Pull-back signals Pull-back filter ratio Period of MA1 Mode of MA1 Period of MA2 Mode of MA2 A
FREE

With this system you can spot high-probability trades in direction of strong trends. You can profit from stop hunt moves initiated by the smart money!
Important Information How you can maximize the potential of the scanner, please read here: www.mql5.com/en/blogs/post/718109 Please read also the blog about the usage of the indicator: Professional Trading With Strong Momentum This FREE Version of the indicator works only on EURUSD and GBPUSD. The full version of the indicator can be found here:
FREE

Indicateur Institutionnel de Compression de Liquidité Cet indicateur mesure en temps réel le resserrement de la liquidité à l’aide de la largeur normalisée des Bandes de Bollinger, du volume et du spread moyen, afin d’identifier les phases de compression avant les mouvements de prix importants. Affichage :
Fenêtre séparée de style professionnel, avec un histogramme “Compression Score” et une ligne de seuil (“Threshold”). Caractéristiques Clés Détection précoce : Repère les zones de contraction

''Trendlines'' is an Indicator, that every Trader need and shows Trendline and Support and resistance levels in all Timeframe's. Also In 1-hour, 4-hour and daily time frames and Current timeframes, support, and resistance levels are specified and trend lines are drawn so that the trader can see all levels on a chart. In Properties it is possible to turn off unnecessary Lines.
In ' Tendency indicator '' , as full package of Predictions that every Trader need, there is also the Predict
FREE

Some short but nice algo giving signals and some ideas for stops. Five moving averages are used to find cross overs and create a zone. All periods and methods are adjustable but default values are optimized already. If you have lags on long history you can reduce MaxBars to make it work faster. Please comment if need to explain the parameters. Also any improvement ideas are welcome.
FREE

* All Symbols x All Timeframes scan just by pressing scanner button ** *** Contact me to send you instructions and add you in "Candle Scanner group" for sharing or seeing experiences with other users. Introduction: Candles tell their story. When looking at a candle, it’s best viewed as a contest between buyers and sellers. Candlestick patterns are used to predict the future direction of price movement. Candlesticks are an easy way to understand the price action. You can use candlesticks to decid
FREE
XE Forex Strengh Indicator MT4 displays visual information about direction and strength of a signal for current pair and chosen timeframes (M5, M15, M30 and H1). Calculations are based on multiple factors and results are shown as a colored panel with scale bar, numerical values and arrows. There are also displayed values of current price and spread on the pair. There can be activated an alert (as a mail or pop-up window with sound) for each available timeframes which send a message when the dir
FREE

Detailed blogpost: https://www.mql5.com/en/blogs/post/766378
Key Features
Adaptive Upper/Lower bands Smooth Center Line Customizable Length (sensitivity) Non-Repainting (only current ongoing bar is updated every "Refresh After Ticks" number of ticks) Multiple Price Sources - Choose from close, open, high, low, median, typical, or weighted close Components:
The Basis Line The smooth center line represents the weighted average of price. Think of this as the "true" price level when all the noise
FREE

This indicator signals about crossing of the main and the signal lines of stochastic (lower stochastic) in the trend direction which is determined by two stochastics of higher time frames (higher stochastics). It is not a secret that stochastic generates accurate signals in a flat market and a lot of false signals in a protracted trend. A combination of two stochastics of higher time frames performs a good filtration of false signals and shows the main tendency. The indicator is recommended for
FREE

I recommend you to read the product's blog (manual) from start to end so that it is clear from the beginning what the indicator offers. This multi oscillator, multi time frame and multi symbol indicator identifies when a divergence occurs between price and an oscillator/indicator. It identifies both regular/classical (trend reversal) and hidden (trend continuation) divergences. It has moving average, RSI/Bollinger, ADX, pin bar and engulfing filter options which makes it possible to filter

H I G H - P R O B A B I L I T Y - B R E A K O U T T R E N D L I N E I N D I C A T O R This is no ordinary trendline indicator. It has a highly-probability algorithms incorporated in the script to display only trendlines that may give a very high chance of price breakout. The indicator is not a stand alone indicator. Trader should interpret it together with their very own analysis technique to come up with a more efficient trading strategy. You can use with it other trend indica
FREE
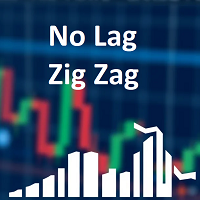
Classic ZigZag formula. But no lags and repaints. You can see on screenshots that it shows values between peaks and it is useful to test strategies based on indicator. Because sometimes people find a good idea about it but don't understand that repainting indicators have some things to keep in mind. The parameters are the same as original ZigZag indicator: Depth, Deviation and Backstep.
FREE

Please check the " What's new " tab regularly for a complete and up-to-date list of all improvements + parameters. FREE indicator for my trading utility Take a Break . This indicator allows you to manage multiple other EAs with just one Take a Break EA instance. Simply specify the corresponding Chart Group in the indicator(s) and Take a Break EA settings and you are good to go.
Setup examples (Indicator + EA)
As a prerequisite, add the URL https://trading.custom-solutions.it to the list of al
FREE
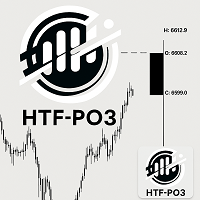
HTF Power of Three (ICT) - MT4 Indicator Overview The HTF Power of Three indicator is a professional implementation of the Inner Circle Trader's (ICT) Power of Three concept, inspired by Larry Williams. This indicator visualizes higher timeframe (HTF) candle development in real-time on any lower timeframe chart, making it an essential tool for ICT traders who study institutional price movement patterns. What is Power of Three (PO3)? Power of Three represents a three-staged Smart Money campa

It is a custom non-repaint indicator to identify trade opportunities in swing action as prices move within an upper and lower band. Inspired by the Keltner Channel, the most popular channel Indicator introduced by Chester Keltner. It is different with a Bollinger Bands. It represents volatility using the high and low prices, while Bollinger's studies rely on the standard deviation. The algorithm for this indicator is also available in the EntryMaximator EA. Including the option to use it or not.
FREE
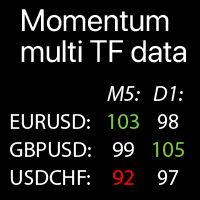
Valeurs de Momentum multi-temps pour les Symboles sélectionnés: comparez les tendances actuelles du marché L' indicateur affiche les valeurs de l'indicateur Momentum de tous les temps et Symboles sélectionnés dans un seul tableau, ce qui permet d'analyser rapidement les tendances actuelles des prix du marché.
Mon outil multifonction : 66+ fonctionnalités | Contactez-moi pour toute question | Version MT5 Chaque Symbole peut être personnalisé: supprimé / remplacé. Vous pouvez ajouter ju
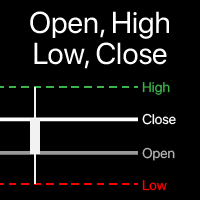
Visualisation des niveaux Open, High, Low, Close sur le graphique Vous pouvez choisir n'importe quel intervalle de temps , pas seulement l' actuel . Le décalage de la barre calculée peut être ajusté : la barre actuelle (flottante), ou un nombre défini de barres précédentes . Utilitaire multifonction : inclut 66+ fonctions | Contactez-moi si vous avez des questions | Version MT5 Dans les paramètres de l'indicateur, vous pouvez

VR Ticks est un indicateur spécial pour les stratégies basées sur le scalping. Grâce à cet indicateur, le trader peut voir le graphique des ticks directement sur le graphique principal de l'instrument financier. Un graphique à ticks vous permet d'entrer une position sur le marché ou de clôturer une position sur le marché aussi précisément que possible. VR Ticks trace les données des tiques sous la forme de lignes qui changent de couleur en fonction de la direction - cela vous permet de comprendr
FREE

Check my p a id tools they work perfect! "Period Cross RSI" Is a New indicator idea that shows crosses of two RSI lines with different periods which creates ascending and descending zones for confirmation of long and short trading. This indicator is brend new and will be upgraded further, for now I recommend to use it as a confirmation, filter indicator for determination of long/short trading zones, not as a signaler indicator for now. Further upgrades can make it as a signaler indicator as w
FREE

Indicateur de Force des Taureaux et des Ours Mise à jour 1.3
L'indicateur des Taureaux et des Ours dispose désormais d'un profil de volume intégré pour détecter les zones de volume le plus élevé dans une plage de barres donnée. Cela peut être modifié selon vos propres paramètres et préférences pour une détection experte de la force des taureaux et des ours avec le plus grand volume.
Cela aide pour : Détection précoce et opportunités d'entrée précises Détection des renversements Détection des r

Round Numbers Levels indicator for MT4 Round Numbers indicator is a simple but useful indicator to draw 00 and 50 price levels in your chart.
These levels act as supports and resistances, and therefore should be taken into account when trading.
These levels can be used as profit targets or entry points.
Inputs of the indicator are:
TGridColor00: color to be used for xx00 levels GridStyle00: line style to be used for xx00 levels GridWidth00: line width to be used for xx00 levels GridColor50:
FREE

What is the ADX_DI Indicator? ADX_DI is an advanced technical analysis indicator developed for MetaTrader platform. It combines Average Directional Index and Directional Indicator components to analyze market trend strength and direction. What Does It Do? Measures Trend Strength : ADX line shows the strength of market trends Determines Direction : DI+ (green) and DI- (red) lines identify trend direction Detects Trend Changes : DI+ and DI- crossovers provide trend reversal signals Automatic Alert
FREE

The Donchian channel is an indicator that takes a series of user-defined periods and calculates the upper and lower bands. Draw two lines on the graph according to the Donchian channel formula. This straightforward formula is based on:
The top line is the highest price for the last periods n The bottom line is the lowest price for the last periods n
Trend systems follow periods when support and resistance levels are broken. in this case when the price breaks the upper line or the lower line o
FREE
Advanced UT BOT ALERTS for MT4 Système professionnel de détection de tendance multi-filtres | Version améliorée du moteur UT BOT Nous proposons uniquement des indicateurs de haute qualité. Advanced UT BOT est conçu pour un usage professionnel, avec une logique de signal stable et un calcul sécurisé qui évite tout retard ou mise à jour erronée.
Il ne redessine, ne supprime ni ne modifie aucun signal passé.
Tous les signaux BUY et SELL sont générés uniquement après la clôture de la bougie , garant
Precision Entry Arrows: Never Miss a High-Probability Trade Again! Stop guessing and start trading with confidence. The Precision Entry Arrows indicator is a sophisticated, all-in-one tool designed to deliver high-quality, non-repainting Buy and Sell signals directly on your chart. It expertly combines the power of MACD , Stochastic , and a unique EMA 5 Cross to pinpoint exact entry moments , then filters everything through a long-term EMA 200 to ensure you are always trading with the major tre
FREE

Simple ATR Stop Loss : Votre boussole de volatilité du marché qui vous aide à naviguer dans les eaux traîtres du trading , en établissant des Stop Losses plus intelligents et en vous faisant ressembler à un ninja du trading (cape non incluse). Attention, tous les aficionados du trading et les experts du marché ! Voici l'indicateur Simple ATR Stop Loss – votre nouveau meilleur ami dans le monde sauvage du trading. Il est plus simple qu'un puzzle de deux pièces mais plus puissant
FREE

All-in-one trading powerhouse: trend, reversal, and exhaustion detection
This indicator is a personal implementation of the famous Traders Dynamic Index, which uses RSI, moving averages and volatility bands to find trends, reversals and price exhaustions. However, this particular implementation supports not only RSI, but many others. It is suitable for scalping, day trading, and swing trading and aims to provide a full picture of the current market conditions. [ Installation Guide | Update Guid
FREE

BuySell Volume is an indicator that approximates Buy and Sell volumes based on price movement. Input Description: applied_model: Choose the applied model. In low reversal mode, price is considered receive low bearish pressure during bullish candle's creation (high bearish pressure on high reversal model. In other words, Bullish Marubozu candles has really high Buy Volumes in low reversal model than in high reversal one.
Output Description: Buy and Sell Volume: Determines how many Buy and Sell vo
FREE
Savez-vous pourquoi MetaTrader Market est le meilleur endroit pour vendre des stratégies de trading et des indicateurs techniques ? Pas besoin de publicité ou de protection logicielle, pas de problèmes de paiement. Tout est fourni dans le MetaTrader Market.
Vous manquez des opportunités de trading :
- Applications de trading gratuites
- Plus de 8 000 signaux à copier
- Actualités économiques pour explorer les marchés financiers
Inscription
Se connecter
Si vous n'avez pas de compte, veuillez vous inscrire
Autorisez l'utilisation de cookies pour vous connecter au site Web MQL5.com.
Veuillez activer les paramètres nécessaires dans votre navigateur, sinon vous ne pourrez pas vous connecter.