Guarda i video tutorial del Market su YouTube
Come acquistare un Robot di Trading o un indicatore
Esegui il tuo EA
hosting virtuale
hosting virtuale
Prova un indicatore/robot di trading prima di acquistarlo
Vuoi guadagnare nel Market?
Come presentare un prodotto per venderlo con successo
Indicatori tecnici per MetaTrader 4 - 18

Indotrend is a Smart indicator to detects the Trend and also view support & resistance, multiple timeframe to get validate the trend. it can be use for Forex,Index,Metal,Stock and Crypto. Parameters: Alerts - show popup alert message on Metatrader Hi Lo H1 Timeframe - Show LIne Hi/Low Price base on H1 timeframe Show Fibonaci level - Show Fibonaci retracement level
Show Support Resistance, - Show Support & Resistance H1 timeframe.
FREE

This indicator presents an alternative approach to identify Market Structure. The logic used is derived from learning material created by DaveTeaches (on X) Upgrade v1.10: add option to put protected high/low value to buffer (figure 11, 12)
When quantifying Market Structure, it is common to use fractal highs and lows to identify "significant" swing pivots. When price closes through these pivots, we may identify a Market Structure Shift (MSS) for reversals or a Break of Structure (BOS) for co

Descption: The Volume Profile displays detailed informations of historical trading activities at certain price levels (Market Profile). So you can locate the areas with the best prices in the market and get an advantage about other market participants.
Features: Customizable Volume Profile / Market Profile Shows the "fair" Value Area with 70% of all Volume
Shows critical low volume zones
Shows VPOC, VAL and VAH Points Works on all timeframes Also available for MT5 ( https://www.mql5.com/en/mark

L'indicatore AIS Correct Averages consente di impostare l'inizio di un movimento di tendenza nel mercato. Un'altra importante qualità dell'indicatore è un chiaro segnale della fine del trend. L'indicatore non viene ridisegnato o ricalcolato.
Valori visualizzati h_AE - limite superiore del canale AE
l_AE - limite inferiore del canale AE
h_EC - Valore previsto alto per la barra corrente
l_EC - Valore previsto basso per la barra corrente
Segnali quando si lavora con l'indicatore Il segnale pr

Balance Levels è un indicatore di trading facile da usare che fornisce chiari segnali di acquisto e vendita insieme a livelli di prezzo dinamici, aiutando i trader a pianificare ingressi e uscite con maggiore sicurezza. Lo strumento è molto flessibile – può essere utilizzato come strategia autonoma oppure integrato in qualsiasi sistema di trading esistente. Funziona su tutti i timeframe e su tutti i mercati : Forex, Oro, Indici, Criptovalute o Azioni. Balance Levels si adatta a ogni stile di tra
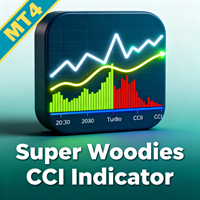
Migliora il tuo vantaggio nel trading con il Super Woodies CCI Indicator MT4, un oscillatore di momentum avanzato ispirato al rinomato sistema Woodies CCI di Ken Wood, che ha guadagnato popolarità all'inizio degli anni 2000 tra i day trader per il suo approccio dual-CCI nel rilevare pattern ciclici e setup ad alta probabilità. Largamente apprezzato da trader forex, azioni e commodities, questo indicatore sfrutta il Commodity Channel Index (CCI) per rilevare condizioni di ipercomprato/ipervenduto

L' Exit Area Ultimate è un indicatore tecnico progettato per migliorare le decisioni di trading indicando i livelli giornalieri dell'Average True Range (ATR) e dell'Average Daily Rate (ADR) sul grafico. Comprendendo questi livelli, i trader possono facilmente valutare il movimento medio di un asset durante il giorno. Questo versatile indicatore ha molteplici scopi per i day trader, aiutando nel piazzamento degli ordini, identificando le tendenze intraday, impostando i livelli di trai

The Colored MACD indicator is a versatile and powerful tool designed to enhance your technical analysis by providing an intuitive visualization of market momentum and trend changes. Built on the foundation of the popular Moving Average Convergence Divergence (MACD) indicator, this version introduces color-coded histograms to easily distinguish between bullish and bearish momentum. Key Features: Color-Coded Visualization : The indicator features a lime-colored histogram when the MACD is above the
FREE

Migliora la tua precisione nel trading con l'indicatore WaveTrend Oscillator Indicator MT4, uno strumento basato sul momentum adattato dallo script iconico di LazyBear del 2014 su TradingView, rinomato per la sua accuratezza nel rilevare inversioni di mercato e cambiamenti di momentum. Celebrato ampiamente nella comunità del trading per oltre un decennio, questo oscillatore combina elementi simili a RSI e MACD per rilevare condizioni di ipercomprato/ipervenduto, rendendolo un elemento essenziale

. Simple Trading System Update !!! Follow this link to see our Strategy !!! (With auto trade indicator)
Description This is an indicator Free Version and showing only history signals, Not real time. Binary Deal Trading Indicator is an indicator on MT4 for Binary Option Trading. It forecasts the overbought / oversold level, Reversal and Fractal point. This indicator will help you to decide a reversal price on any time frame (Recommend M1, M5 and M15). The expiry time is 5-15 minutes after rec
FREE

Full Stochastic - is Stochastic Oscillator which displays all three essential lines: %K Slow K %D Standard Stochastic Oscillators displays only Slow K and %D.
Why it is important to analyze all three lines in SO? Standard SO users must choose if they want to use fast or slow SO. In case of fast SO traders set the slowing parameter typically to 1 or 2, or if they want to use slow SO, they set the slowing parameter usually to 3 or more. With Full Stochastic you can have both!
Full Stochastic Par
FREE

The tool is used to calculate the size of the position that can be opened with the previously assumed risk. The risk can be defined as: percentage value of the account (%), nominal value, expressed in the account currency. The size of position is determined by the distance of the planned SL (red line).
Input Parameters Lost_in_Money - if true, the value of the acceptable loss is determined by the parameter "Acceptable_loss", else acceptable loss is determined by the parameter "Acceptable_Risk_P

Ichimoku Multicurrency Scanner Dashboard MT4 è uno strumento di trading potente progettato per monitorare più coppie di valute e timeframe utilizzando l'Ichimoku Kinko Hyo. Organizza i segnali in un formato a griglia, con simboli raggruppati per valute di base e timeframe, da M1 a MN1. I trader possono abilitare o disabilitare timeframe specifici per adattarsi alle loro strategie. Lo strumento mostra segnali basati sulle seguenti strategie: Kijun Cross Strategy: Segnali generati quando il prezzo
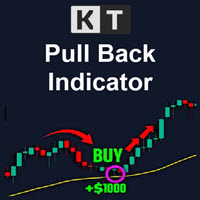
KT Pull Back Arrows mostra le frecce di ritracciamento utilizzando l'RSI (Relative Strength Index) per individuare le aree ideali di pullback all'interno delle zone di ipercomprato e ipervenduto. L’indicatore identifica in modo preciso i momenti più favorevoli per entrare in operazioni basate sui pullback. Il trading di tendenza è spesso considerato la strategia più redditizia nel mercato Forex. È come cavalcare l’onda, seguendo il flusso e sfruttando il momentum del mercato. Tuttavia, il tempis

KT MACD Alerts è una versione personalizzata dell’indicatore MACD standard disponibile in MetaTrader. Fornisce avvisi e disegna linee verticali quando si verificano i seguenti due eventi: Quando il MACD incrocia verso l’alto la linea dello zero. Quando il MACD incrocia verso il basso la linea dello zero.
Funzionalità Include uno scanner MTF integrato che mostra la direzione del MACD su tutti i timeframe. Ideale per i trader che operano in base agli incroci del MACD sopra o sotto la linea dello
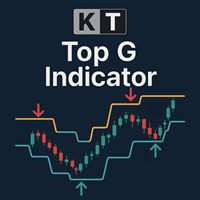
KT Top G è un indicatore basato sull'azione del prezzo che combina un'analisi intelligente dei canali per identificare potenziali massimi e minimi di mercato. Quando viene rilevata una possibile inversione, disegna sul grafico frecce grandi e ben visibili per avvisarti prima che il mercato cambi direzione. Frecce grandi: Evidenziano massimi e minimi di mercato ad alta probabilità rilevando esaurimento del prezzo e cambiamenti di momentum. Frecce piccole: Indicano punti di svolta a bassa probabil

Livelli di Stop Out e Margin Call – Il tuo assistente per la gestione del rischio Prendi il pieno controllo del tuo rischio di trading con questo indicatore che mostra dinamicamente i livelli chiave sul grafico: Stop Out, Margin Call, Margine Libero e un livello personalizzato. Perfetto per i trader che utilizzano leva alta o strategie all-in, dove ogni pip è cruciale e la tolleranza al rischio è minima. Completamente personalizzabile – imposta colore, stile, spessore e visibilità di ogni linea

Una delle sequenze numeriche è chiamata "Sequenza di incendi boschivi". È stata riconosciuta come una delle nuove sequenze più belle. La sua caratteristica principale è che questa sequenza evita andamenti lineari, anche quelli più brevi. È questa proprietà che ha costituito la base di questo indicatore. Quando si analizza una serie temporale finanziaria, questo indicatore cerca di rifiutare tutte le possibili opzioni di tendenza. E solo se fallisce, riconosce la presenza di una tendenza e dà il
L' indicatore di zona FVG è un potente strumento progettato per identificare i gap di fair value (FVG) nel mercato, evidenziando gli squilibri di prezzo tra fair value e prezzo di mercato. Questa precisa identificazione dei gap consente ai trader di individuare potenziali punti di entrata e uscita dal mercato, migliorando significativamente la loro capacità di prendere decisioni di trading informate. Con la sua interfaccia intuitiva e user-friendly, l'indicatore di zona FVG analizza automati
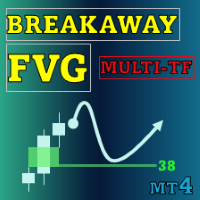
Special offer : ALL TOOLS , just $35 each! New tools will be $30 for the first week or the first 3 purchases ! Trading Tools Channel on MQL5 : Join my MQL5 channel to update the latest news from me Lo strumento Breakaway Fair Value Gaps (FVG) è una soluzione all'avanguardia progettata per aiutare i trader a identificare le aree in cui il prezzo si è discostato dall'equilibrio, offrendo approfondimenti dettagliati sulle probabilità di mitigazione. Questo strumento non solo evidenzia

L'indicatore Boom and Crash Spike Detector è codificato in base a una strategia avanzata principalmente per rilevare il boom e il crash nei prezzi. Algoritmi complessi sono stati impiantati per rilevare boom e crash ad alta probabilità nei prezzi. Avvisa su potenziali fasi di boom o arresto anomalo:
Fase boom: quando il prezzo aumenta troppo velocemente. Crash Phase: quando il prezzo diminuisce troppo velocemente.
OFFERTA A TEMPO LIMITATO: L'indicatore è disponibile per soli 30$ e per tutta la

Introduction to Fractal Moving Average Fractal Moving Average indicator was designed as part of Fractal Pattern Scanner. Inside Fractal Pattern Scanner, Fractal Moving Average Indicator was implemented as multiple of chart objects. With over thousands of chart object, we find that it was not the best and efficient ways to operate the indicator. It was computationally too heavy for the indicator. Hence, we decide to implement the indicator version of Fractal Moving Average indicator to benefit o
FREE
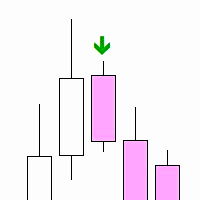
"Inside Bar PA" is a technical indicator designed to determine the inner bars on the chart. An internal bar is a bar or candle, the maximum and minimum of which are completely contained in the previous bar. This may signal a potential reversal or continuation of the trend, depending on the context.
Features: Automatic detection of internal bars. Visual marking of internal bars with arrows on the chart. The ability to adjust the distance of the mark from the bar. How to use: Attach the indicato
FREE

Moving Average Trend Alert is a triple MA indicator that helps traders to identify potential market trends based on 3 MAs alignment and crossover.
Moving Average Trend Alert features: Customizable short-term, medium-term, and long-term MAs. Option to filter signals based on a minimum distance between moving averages to avoid premature MAs alignment. Optional Filter of signals with RSI indicator overbought/oversold levels. Optional Filter of signals with ADX indicator. Popup, email, and phone no
FREE

Volume Delta is a very powerful indicator that reads the supply on the Market. It calculates the Delta from movement of the price and the difference of BUY and SELL Tick volumes. Its special structure allows you to get all timeframe values available on the MT4 platform. A good observation of this instrument can suggest great entry points and possible reversal. We are confident that this tool will help you to improve your trading timing. See also for MT5: https://www.mql5.com/en/market/product/5
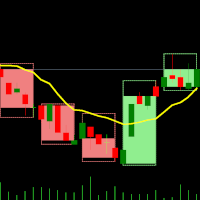
Indicatore Dual Time Frame – Candele nelle Candele per MT4 Panoramica L'Indicatore Candele nelle Candele è uno strumento di visualizzazione multi-timeframe sviluppato specificamente per MT4. Sovrappone le candele di un timeframe superiore al grafico di un timeframe inferiore, permettendoti di vedere come le candele più piccole si comportano all'interno di quelle più grandi. Questo approccio migliora l'analisi della struttura di mercato, facilita l'identificazione delle tendenze e chiarisce l'azi
FREE

Lot Size Calculator – Strumento di dimensionamento posizione Questo indicatore calcola la dimensione del lotto in base alla percentuale di rischio selezionata e alla distanza dello stop loss. È progettato per il trading di Forex, metalli, indici, materie prime e criptovalute.
Caratteristiche principali Calcolo della dimensione della posizione basato sul saldo del conto / equity disponibile e sulla percentuale di rischio scelta Modalità ordine a mercato e ordine pendente Livelli visivi sul grafi
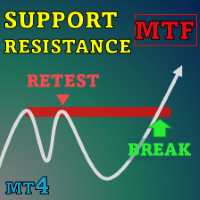
Special offer : ALL TOOLS , just $35 each! New tools will be $30 for the first week or the first 3 purchases ! Trading Tools Channel on MQL5 : Join my MQL5 channel to update the latest news from me Nell'ambiente in continua evoluzione del trading finanziario, identificare e analizzare accuratamente i livelli di supporto e resistenza è essenziale per prendere decisioni di investimento informate. SnR Retest and Break Multi-Timeframe è un indicatore di supporto e resistenza progettato
XAU Scalper MT4 Versione MT5 Uno strumento analitico per l'osservazione dei movimenti di prezzo a breve termine nelle coppie d'oro. L'Indicatore XAU Scalper fornisce segnali di acquisto e vendita basati sulla stabilità della candela, sull'RSI e sul momentum a breve termine. È progettato per aiutare i trader a identificare potenziali punti di ingresso durante i brevi movimenti di mercato nelle coppie XAU. Caratteristiche Indice di Stabilità della Candela ( Candle Stability Index ): Misura la prop

L'indicateur comprend deux parties. Partie I : Les bougies colorées montrent la grande tendance Les bougies de couleur consistent à identifier l'état du marché à l'aide de chandeliers de couleur. Comme le montrent les captures d'écran, si la couleur est Aqua, le marché est dans un état dans lequel vous devez passer des ordres longs ou quitter des ordres courts. Si la couleur est Tomate, c'est le moment de passer des commandes courtes ou de sortir des commandes longues. Si la couleur change, il v

The intention of the dashboard is to provide a quick overview of the daily, weekly and monthly range of configured assets. In "single asset mode" the dashboard shows you possible reversal points directly in the chart, thus making statistics directly tradable. If a configured threshold is exceeded, the dashboard can send a screen alert, a notification (to the mobile MT4) or an email. There are various ways of using this information. One approach is that an asset that has completed nearly 100% of
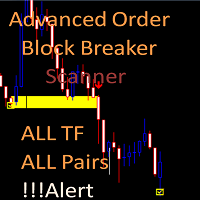
Advanced Order Block Breaker Scanner
This Scanner is free to download but is dependent on you owning the advance order block breaker indicator. Need to purchase the indicator here: https://www.mql5.com/en/market/product/59127
MT5 version: https://www.mql5.com/en/market/product/62769
The Scanner will show you on a single chart all the timeframes (M1 to Monthly) with their own status for the indicator: advance order block breaker Scan all time frame and all symbol: breaker's smart algor
FREE
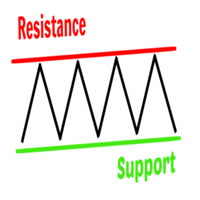
Support and resistance levels are the key factors that determine the price movement from one zone to another. They are levels for trend reversal/breakout signals forex traders look out for before making a trade decision. The Support and Resistance Indicator is a custom trading tool for MT4 developed to plot support/resistance zones from past price actions. The indicator also helps a trader evaluate optimal zones to place a BUY/SELL order or to exit a trade. In other words, it assists traders to
FREE

This masterpiece blends cutting-edge Advance MA, HMA, and Momentum logic into stunning gold star signals, giving you the power to spot market shifts without the guesswork. Perfect for every trader—beginner or expert—this tool turns your XAUUSD charts into a goldmine of opportunity. Don’t just trade—thrive!
Why You’ll Love It
Crystal-Clear Signals : Gold star alerts highlight key market moments, guiding your decisions with ease. Smart Moving Average : Pair with the Advance MA to confidently de
FREE
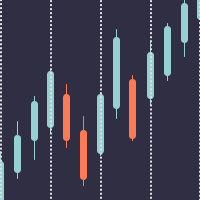
Better Period Separators For MetaTrader 4 The built-in period separators feature doesn’t allow users to specify the time period, so you can use this indicator to create more customizable period separators. On intraday charts, you could place period separators at a specific time, you could also place extra period separators at a specific time on Monday to mark the start of a week. On higher timeframe charts, this indicator works the same as the built-in period separators, On the daily chart, peri
FREE

Presentazione di Awesome Oscillator Alert , un potente indicatore tecnico che fornisce ai trader preziose informazioni sulle dinamiche di mercato e sulle opportunità di trading. Con le sue funzionalità complete e l'interfaccia intuitiva, questo indicatore è uno strumento essenziale per i trader che cercano di ottenere un vantaggio sul mercato.
Una delle caratteristiche distintive di Awesome Oscillator Alert è la sua compatibilità con tutte le coppie di valute e i tempi. Che tu stia scambian

The Simple ICT Concepts Indicator is a powerful tool designed to help traders apply the principles of the Inner Circle Trader (ICT) methodology. This indicator focuses on identifying key zones such as liquidity levels, support and resistance, and market structure, making it an invaluable asset for price action and smart money concept traders. Key Features Market Structure : Market structure labels are constructed from price breaking a prior swing point. This allows a user to determine t
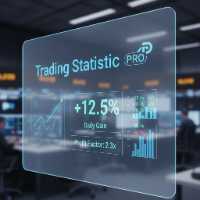
The statistical indicator for the metatrader 5 TradingStatisticPro collects statistical data on your trade, which makes it easier to assess the effectiveness of trading, the profit received and the risks. The indicator is compactly placed in the corner of the main chart of the terminal and displays the following information: 1. The profit earned. 2. Maximum drawdown. 3. The recovery factor. 4. Profit factor. 5. The ratio of profitable and unprofitable transactions (winrate). 6. Average profit a
FREE

The Silent Edge of Smart Money
"It's not about how much you do, but how much love you put into what you do that counts." – Mother Teresa
They say the real money in trading is made in the shadows—where inefficiencies hide and only the most perceptive capitalize. That’s exactly where the Arbitrage Thief Index (ATI) thrives. For years, this tool has been my personal advantage , silently identifying low-risk, high-reward trades before the crowd even notices. It’s the kind of edge top fund managers

It would be good to always be aware of the "struggle" between buyers and sellers. Then it would be much easier to determine the best direction to go in order not to lose out. This indicator offers an original solution to this problem: the supply and demand values are compared with the High and Low prices for the selected period, thus trying to determine the market movement towards the stronger side without ignoring the strength of the opposite side. All this is displayed in a separate window usi

Indicator. Zones of support and resistance levels The most reliable tool in the hands of any technical analyst is support and resistance levels.It is these levels that magically work in the market, because the price then bounces off them, on the contrary, gaining maximum acceleration, punching them and striving for a new price point.However, in practice, many beginners face enormous difficulties in building them.This is due to the fact that the price may react quite differently to them, and ofte
FREE

With this easy to set up indicator you can display and set alerts for the following candlestick formations: Bull Breakout, Bear Breakout, Hammer, Pin, Bullish Engulfing, Bearish Engulfing. I'd appreciate if you would review the indicator
Input parameters: ShortArrowColor: The color of the Arrows, displaying a Bearish candle formation LongArrowColor: The color of the Arrows displaying a Bullish candle formation BullishEngulfing: Disabled/Enabled/EnabledwithAlert BearishEngulfing: Disabled/Enab
FREE

Based on famous and useful indicator - Super Trend, we add some features to make this Indicator much easier to use and powerful. Ease to identify the trend of any chart. Suitable for both Scalping & Swing Better to use in the trending market be careful in sideway market, it might provide some fake signals Setting: ATR Multiplier ATR Period ATR Max Bars (Max 10.000) Show UP/DOWN node Nodes size Show Pull-back signals Pull-back filter ratio Period of MA1 Mode of MA1 Period of MA2 Mode of MA2 A
FREE

With this system you can spot high-probability trades in direction of strong trends. You can profit from stop hunt moves initiated by the smart money!
Important Information How you can maximize the potential of the scanner, please read here: www.mql5.com/en/blogs/post/718109 Please read also the blog about the usage of the indicator: Professional Trading With Strong Momentum This FREE Version of the indicator works only on EURUSD and GBPUSD. The full version of the indicator can be found here:
FREE

Indicatore Istituzionale di Compressione della Liquidità L’indicatore misura in tempo reale il restringimento della liquidità utilizzando la larghezza normalizzata delle Bande di Bollinger, il volume e lo spread medio, per individuare le fasi di compressione prima dei breakout di prezzo. Visualizzazione:
Finestra separata in stile professionale, con istogramma “Compression Score” e linea di soglia (“Threshold”). Caratteristiche Principali Rilevamento precoce: Identifica le zone di contrazione p

''Trendlines'' is an Indicator, that every Trader need and shows Trendline and Support and resistance levels in all Timeframe's. Also In 1-hour, 4-hour and daily time frames and Current timeframes, support, and resistance levels are specified and trend lines are drawn so that the trader can see all levels on a chart. In Properties it is possible to turn off unnecessary Lines.
In ' Tendency indicator '' , as full package of Predictions that every Trader need, there is also the Predict
FREE

Some short but nice algo giving signals and some ideas for stops. Five moving averages are used to find cross overs and create a zone. All periods and methods are adjustable but default values are optimized already. If you have lags on long history you can reduce MaxBars to make it work faster. Please comment if need to explain the parameters. Also any improvement ideas are welcome.
FREE

* All Symbols x All Timeframes scan just by pressing scanner button ** *** Contact me to send you instructions and add you in "Candle Scanner group" for sharing or seeing experiences with other users. Introduction: Candles tell their story. When looking at a candle, it’s best viewed as a contest between buyers and sellers. Candlestick patterns are used to predict the future direction of price movement. Candlesticks are an easy way to understand the price action. You can use candlesticks to decid
FREE
XE Forex Strengh Indicator MT4 displays visual information about direction and strength of a signal for current pair and chosen timeframes (M5, M15, M30 and H1). Calculations are based on multiple factors and results are shown as a colored panel with scale bar, numerical values and arrows. There are also displayed values of current price and spread on the pair. There can be activated an alert (as a mail or pop-up window with sound) for each available timeframes which send a message when the dir
FREE

Detailed blogpost: https://www.mql5.com/en/blogs/post/766378
Key Features
Adaptive Upper/Lower bands Smooth Center Line Customizable Length (sensitivity) Non-Repainting (only current ongoing bar is updated every "Refresh After Ticks" number of ticks) Multiple Price Sources - Choose from close, open, high, low, median, typical, or weighted close Components:
The Basis Line The smooth center line represents the weighted average of price. Think of this as the "true" price level when all the noise
FREE

This indicator signals about crossing of the main and the signal lines of stochastic (lower stochastic) in the trend direction which is determined by two stochastics of higher time frames (higher stochastics). It is not a secret that stochastic generates accurate signals in a flat market and a lot of false signals in a protracted trend. A combination of two stochastics of higher time frames performs a good filtration of false signals and shows the main tendency. The indicator is recommended for
FREE

I recommend you to read the product's blog (manual) from start to end so that it is clear from the beginning what the indicator offers. This multi oscillator, multi time frame and multi symbol indicator identifies when a divergence occurs between price and an oscillator/indicator. It identifies both regular/classical (trend reversal) and hidden (trend continuation) divergences. It has moving average, RSI/Bollinger, ADX, pin bar and engulfing filter options which makes it possible to filter

H I G H - P R O B A B I L I T Y - B R E A K O U T T R E N D L I N E I N D I C A T O R This is no ordinary trendline indicator. It has a highly-probability algorithms incorporated in the script to display only trendlines that may give a very high chance of price breakout. The indicator is not a stand alone indicator. Trader should interpret it together with their very own analysis technique to come up with a more efficient trading strategy. You can use with it other trend indica
FREE
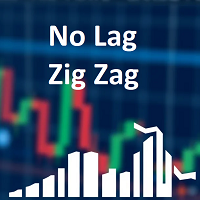
Classic ZigZag formula. But no lags and repaints. You can see on screenshots that it shows values between peaks and it is useful to test strategies based on indicator. Because sometimes people find a good idea about it but don't understand that repainting indicators have some things to keep in mind. The parameters are the same as original ZigZag indicator: Depth, Deviation and Backstep.
FREE

Please check the " What's new " tab regularly for a complete and up-to-date list of all improvements + parameters. FREE indicator for my trading utility Take a Break . This indicator allows you to manage multiple other EAs with just one Take a Break EA instance. Simply specify the corresponding Chart Group in the indicator(s) and Take a Break EA settings and you are good to go.
Setup examples (Indicator + EA)
As a prerequisite, add the URL https://trading.custom-solutions.it to the list of al
FREE
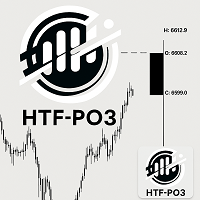
HTF Power of Three (ICT) - MT4 Indicator Overview The HTF Power of Three indicator is a professional implementation of the Inner Circle Trader's (ICT) Power of Three concept, inspired by Larry Williams. This indicator visualizes higher timeframe (HTF) candle development in real-time on any lower timeframe chart, making it an essential tool for ICT traders who study institutional price movement patterns. What is Power of Three (PO3)? Power of Three represents a three-staged Smart Money campa

It is a custom non-repaint indicator to identify trade opportunities in swing action as prices move within an upper and lower band. Inspired by the Keltner Channel, the most popular channel Indicator introduced by Chester Keltner. It is different with a Bollinger Bands. It represents volatility using the high and low prices, while Bollinger's studies rely on the standard deviation. The algorithm for this indicator is also available in the EntryMaximator EA. Including the option to use it or not.
FREE
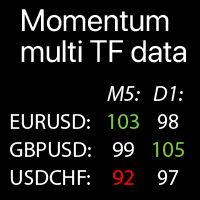
Valori Momentum multi-timeframe per i Simboli selezionati: confronta le tendenze attuali del mercato L' indicatore mostra i valori dell'indicatore Momentum da tutti i timeframe e Simboli selezionati in una sola tabella, consentendo di analizzare rapidamente le tendenze attuali dei prezzi di mercato.
Il mio strumento multifunzione : 66+ funzioni | Contattami per qualsiasi domanda | Versione MT5 Ogni Simbolo può essere personalizzato: rimosso / sostituito. Puoi aggiungere fino a 40 Simb
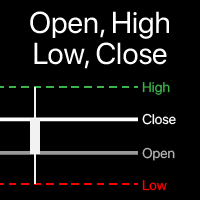
Visualizzazione dei livelli Open, High, Low, Close sul grafico Puoi scegliere qualsiasi timeframe , non solo quello attuale . Lo scostamento della barra calcolata può essere regolato : la barra attuale (fluttuante), o un numero prefissato di barre indietro . Utilità multifunzione : include 66+ funzioni | Contattami se hai domande | Versione MT5 Nelle impostazioni dell'indicatore, puoi configurare: Scostamento della barra calcolata: 0

VR Ticks è un indicatore speciale per strategie basate sullo scalping. Grazie a questo indicatore il trader può vedere il grafico tick direttamente sul grafico principale dello strumento finanziario. Un grafico tick ti consente di inserire una posizione nel mercato o chiudere una posizione nel mercato nel modo più accurato possibile. VR Ticks traccia i dati dei tick sotto forma di linee che cambiano colore a seconda della direzione: ciò consente di comprendere e valutare visivamente la situazion
FREE

Check my p a id tools they work perfect! "Period Cross RSI" Is a New indicator idea that shows crosses of two RSI lines with different periods which creates ascending and descending zones for confirmation of long and short trading. This indicator is brend new and will be upgraded further, for now I recommend to use it as a confirmation, filter indicator for determination of long/short trading zones, not as a signaler indicator for now. Further upgrades can make it as a signaler indicator as w
FREE

Indicatore di Forza dei Tori e degli Orsi Aggiornamento 1.3
L'indicatore dei Tori e degli Orsi ora include un profilo di volume integrato per rilevare le aree di volume più forte all'interno di un dato intervallo di barre. Questo può essere ulteriormente modificato secondo le tue preferenze e impostazioni per una rilevazione esperta della forza dei tori e degli orsi con il volume più alto.
Questo aiuta per: Rilevazione precoce e opportunità di ingresso precise Rilevazione dei cambiamenti di di

Round Numbers Levels indicator for MT4 Round Numbers indicator is a simple but useful indicator to draw 00 and 50 price levels in your chart.
These levels act as supports and resistances, and therefore should be taken into account when trading.
These levels can be used as profit targets or entry points.
Inputs of the indicator are:
TGridColor00: color to be used for xx00 levels GridStyle00: line style to be used for xx00 levels GridWidth00: line width to be used for xx00 levels GridColor50:
FREE
What is the ADX_DI Indicator? ADX_DI is an advanced technical analysis indicator developed for MetaTrader platform. It combines Average Directional Index and Directional Indicator components to analyze market trend strength and direction. What Does It Do? Measures Trend Strength : ADX line shows the strength of market trends Determines Direction : DI+ (green) and DI- (red) lines identify trend direction Detects Trend Changes : DI+ and DI- crossovers provide trend reversal signals Automatic Alert
FREE

The Donchian channel is an indicator that takes a series of user-defined periods and calculates the upper and lower bands. Draw two lines on the graph according to the Donchian channel formula. This straightforward formula is based on:
The top line is the highest price for the last periods n The bottom line is the lowest price for the last periods n
Trend systems follow periods when support and resistance levels are broken. in this case when the price breaks the upper line or the lower line o
FREE
Advanced UT BOT ALERTS for MT4 Sistema professionale di rilevamento del trend con filtri multipli | Motore UT BOT potenziato Forniamo solo indicatori di alta qualità. Advanced UT BOT è progettato per uso professionale, con una logica di segnale stabile e un processo di calcolo sicuro che evita ritardi o aggiornamenti errati.
Non ridisegna, rimuove o modifica i segnali passati.
Tutti i segnali BUY e SELL vengono generati solo dopo la chiusura della candela e restano fissi.
Nel trading in tempo re
Precision Entry Arrows: Never Miss a High-Probability Trade Again! Stop guessing and start trading with confidence. The Precision Entry Arrows indicator is a sophisticated, all-in-one tool designed to deliver high-quality, non-repainting Buy and Sell signals directly on your chart. It expertly combines the power of MACD , Stochastic , and a unique EMA 5 Cross to pinpoint exact entry moments , then filters everything through a long-term EMA 200 to ensure you are always trading with the major tre
FREE

Simple ATR Stop Loss : La tua bussola della volatilità del mercato che ti aiuta a navigare nelle acque insidiose del trading , impostando Stop Loss più intelligenti e facendoti sembrare un ninja del trading (mantello non incluso). Attenzione, appassionati di trading ed esperti di mercato! Ecco l'indicatore Simple ATR Stop Loss – il tuo nuovo migliore amico nel selvaggio mondo del trading. È più semplice di un puzzle da due pezzi ma più potente di un toro caffeinsato in un negozi
FREE

All-in-one trading powerhouse: trend, reversal, and exhaustion detection
This indicator is a personal implementation of the famous Traders Dynamic Index, which uses RSI, moving averages and volatility bands to find trends, reversals and price exhaustions. However, this particular implementation supports not only RSI, but many others. It is suitable for scalping, day trading, and swing trading and aims to provide a full picture of the current market conditions. [ Installation Guide | Update Guid
FREE

BuySell Volume is an indicator that approximates Buy and Sell volumes based on price movement. Input Description: applied_model: Choose the applied model. In low reversal mode, price is considered receive low bearish pressure during bullish candle's creation (high bearish pressure on high reversal model. In other words, Bullish Marubozu candles has really high Buy Volumes in low reversal model than in high reversal one.
Output Description: Buy and Sell Volume: Determines how many Buy and Sell vo
FREE
MetaTrader Market - i robot di trading e gli indicatori tecnici per trader sono disponibili nel tuo terminale di trading.
Il sistema di pagamento MQL5.community è disponibile per tutti gli utenti registrati sul sito MQL5.com che effettuano transazioni su MetaTrader Services. Puoi depositare e prelevare denaro usando WebMoney, PayPal o una carta di credito.
Ti stai perdendo delle opportunità di trading:
- App di trading gratuite
- Oltre 8.000 segnali per il copy trading
- Notizie economiche per esplorare i mercati finanziari
Registrazione
Accedi
Se non hai un account, registrati
Consenti l'uso dei cookie per accedere al sito MQL5.com.
Abilita le impostazioni necessarie nel browser, altrimenti non sarà possibile accedere.