Conheça o Mercado MQL5 no YouTube, assista aos vídeos tutoriais
Como comprar um robô de negociação ou indicador?
Execute seu EA na
hospedagem virtual
hospedagem virtual
Teste indicadores/robôs de negociação antes de comprá-los
Quer ganhar dinheiro no Mercado?
Como apresentar um produto para o consumidor final?
Indicadores Técnicos para MetaTrader 4 - 17
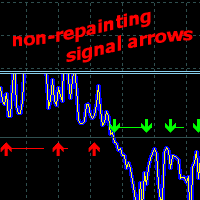
Price Direction Oscillator - é um indicador concebido para detetar movimentos de mercado a curto e médio prazo. Adaptável a qualquer mercado e período,
Consiste numa linha de tendência, um oscilador de volatilidade de mercado e um potencial gerador de sinais de negociação.
Uso do Indicador
Determina a tendência com base na volatilidade do mercado e fornece sinais para a abertura de ordens de COMPRA ou VENDA. Sem redesenhar os seus dados históricos, as setas de sinal não mudam de cor e aparecem

Sniper Entries AI is a powerful, intelligent indicator designed for traders seeking precise entry points at potential market reversals. Leveraging advanced AI algorithms, this tool analyzes price patterns across multiple timeframes, allowing traders to stay informed of trend shifts, no matter the scale of their trades. Key Features of Sniper Entries AI: High-Precision Reversal Signals : The indicator scans market movements to identify precise reversal points and continuation, giving you a compe

The EasyTrend is a seemingly simple but quite powerful trend indicator. Everyone has probably come across indicators or Expert Advisors that contain numerous input parameters that are difficult to understand. Here you will not see dozens of input parameters, the purpose of which is only clear to the developer. Instead, an artificial neural network handles the configuration of the parameters.
Input Parameters The indicator is as simple as possible, so there are only 2 input parameters: Alert - i
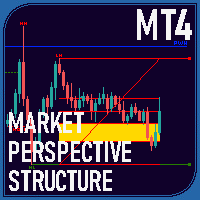
Overview The Market Perspective Structure Indicator is a comprehensive MetaTrader indicator designed to provide traders with a detailed analysis of market structure across multiple timeframes. It identifies and visualizes key price action elements, including swing highs and lows, Break of Structure (BOS), Change of Character (CHOCH), internal structures, equal highs/lows, premium/discount levels, previous levels from higher timeframes, and trading session zones. With extensive customization opt
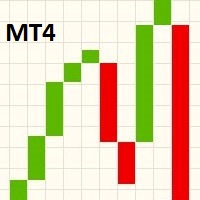
Este indicador mostra um gráfico de Ruptura de Linha no gráfico principal. Para visualizar o gráfico de Ruptura de Linha, você deve alterar o gráfico principal para exibição em linha, em seguida, mudar nas Propriedade (F8), a configuração da cor do "gráfico de linhas" para "None". Em relação a rolagem, zoom +/- ou alterar o par/período do gráfico, o indicador irá redimensionar os blocos na próxima escala para atender a área principal de visualização do gráfico. Gráficos de Ruptura de Linhas foi
FREE

Check my p a id tools they work perfect! "Period Cross RSI" Is a New indicator idea that shows crosses of two RSI lines with different periods which creates ascending and descending zones for confirmation of long and short trading. This indicator is brend new and will be upgraded further, for now I recommend to use it as a confirmation, filter indicator for determination of long/short trading zones, not as a signaler indicator for now. Further upgrades can make it as a signaler indicator as w
FREE

TrendBite v1.5 - Indicador profissional de acompanhamento de tendências Desenvolvedor: 8aLt4 Versão: 1.5 Plataforma: MetaTrader 4
Visão geral O TrendBite v1.5 é um indicador de análise técnica avançado, concebido para identificar mudanças de tendência no mercado e fornecer sinais de compra e venda claros aos investidores. Baseado no algoritmo das Bandas de Bollinger, esta ferramenta capta com precisão as inversões de tendência, sendo ideal tanto para principiantes como para traders experiente
FREE

SMARTMASS INDICATOR This indicator is different from all known volume indicators. It has a significant distinction; it is an algorithm that relates price movement to volume, attempting to find proportionality and efficient movement while filtering out noise and other movements that are more random and do not follow a trend or reversal. Ultimately, it reveals the true strength of the movement, indicating whether it has genuine support from bulls or bears or if it's merely a high-volume movement

[NEW RELEASE] Horse All in Signal – WinWiFi Robot Series ต้อนรับปีใหม่ 2026 ด้วยความมั่งคั่งและพลังที่คึกคักเหมือนม้าศึก! สัมผัสประสบการณ์การเทรดเหนือระดับกับอินดิเคเตอร์ตัวล่าสุดจาก WinWiFi Robot Series ในชื่อ "Horse All in Signal" เครื่องมือที่จะเปลี่ยนกราฟของคุณให้กลายเป็นสนามทำกำไร ด้วยระบบ AI อัจฉริยะที่สแกน Price Action ในทุกช่วงเวลา คุณสมบัติเด่น (Key Features): AI Price Action Engine: วิเคราะห์พฤติกรรมราคาแบบ Real-time แม่นยำทั้งในช่วงตลาดมีเทรนด์ (Trend) และช่วงพักตัว (Sideway)
FREE

RoundNumbers indicator is a simple and powerful psychological price levels. Trader usually use these levels as a Support and Resistance (SnR). Indicator Input: Levels - Numbers of levels drawn on chart. Default 30 levels. BoxSize - Box size drawn on each levels, indicate buffers around levels. Default value 1pips (10point) above and below each levels. ZoneSize - Distance between each levels, default value 10pips (100point). Style & Colours - User inputs customization.
For MT5 version, please re
FREE

If you like this project, leave a 5 star review. Often times we are using brokers that are outside of the GMT-0 timezone, this
not only complicates things, but, it can make seeing when a trading session starts
a bit more difficult than it should. This indicator allows you to set a timezone offset it will draw a vertical line for the: Day. Week. Month. Quarter. year.
FREE

Indicador RCI (Rank Correlation Index) Visão geral O indicador RCI (Rank Correlation Index) é uma ferramenta osciladora que analisa tendências de mercado e possíveis pontos de reversão com base na correlação de ranking dos dados de preços.
Ele compara o ranking dos preços com o ranking do tempo para um período especificado e apresenta o coeficiente de correlação entre -100 e +100 em uma linha simples no gráfico.
O RCI é amplamente utilizado para avaliar o impulso do mercado, medir o timing de e
FREE

Estatísticas do painel da conta
É uma ferramenta que vai te ajudar a ter uma visão focada para saber os ganhos e perdas da sua conta, para que você possa acompanhar, também traz uma análise de rebaixamento para saber o risco obtido também Depois de baixá-lo e ativá-lo em sua conta, você deve anexá-lo a qualquer símbolo por exemplo EURUSD H1, a partir deste momento a ferramenta começará a monitorar suas estatísticas
o painel é completamente avançado, você pode ocultá-lo e movê-lo para onde qui
FREE
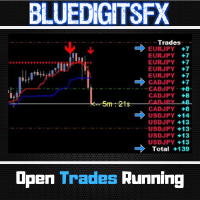
Free Utility Tool by BlueDigitsFx
Designed to improve workflow and trade management
Also available for MetaTrader 5
Optional access to updates & support via the BlueDigitsFx Telegram Assistant Bot BlueDigitsFx Open Trades is a powerful MT4 tool that displays your total pips from all open trades in real time.
Its intuitive color-coded interface quickly indicates winning and losing trades across all currency pairs.
This helps you monitor your trade performance effortlessly, enabling faster d
FREE

This indicator is designed for calculating the value of points for the specified lot sizes. The MT5 version is here https://www.mql5.com/en/market/product/29230 Description by lines Line 1 - deposit currency. Line 2 - lot size (10 input parameters) . All further values are calculated into columns below each lot size. Line 3 - calculation of value for one point. Line 4 - calculation of value for spread. All subsequent lines - calculation of value for points (20 input parameters) . All you need t
FREE

В основе индикатора TDI лежат следующие индикаторы: RSI, Moving Average, Bollinger bands, но основным из них нужно выделить RSI, весь расчет индикатора завязан от его значений.
Зеленая линия (линия RSI) – сглаженные простой (по умолчанию) скользящей средней значения индикатора RSI, период сглаживания 2.
Красная линия (сигнальная линия) – сглаженные простой (по умолчанию) скользящей средней значения индикатора RSI, период сглаживания 7.
Синие линии – индикатор Bollinger bands по умолчанию пери
FREE

It is the main indicator of Turtle Trading Strategy. It provides an excellent advantage for following the trend. It gives a signal to enter the transaction in channel breaks. A sell position is opened when the 20-period lower channel breaks, and a buy position is opened when the upper channel breaks. 2 ATR should be used as the stoploss level. The R-R ratio should be at least 1/2. You can reach the maximum profit opportunity by following the 10-period middle level. Recommended INPUT: 20 Period
FREE
Indicator Rua Alert Line. This indicator will notify when the High-price of candle breaks any TrendLine or HorizontalLine on the chart. Notifications will be sent to the phone and on MT4. And it have ArrowBuy/ArrowSell on chart. It is very useful for those of you who use the TrendLine or HorizontalLine but do not have time to observe the chart. Timeframe M1 to W1 Symbol: All
FREE

Defines extremes. This indicator consists of two parts. The first draws lines on the chart indicating low volatility in relative daily market activity. The second is responsible for determining the extremum and gives signals to buy or sell. This system is suitable for all instruments. It is recommended to use a timeframe from m15 to h4. Before using, you need to choose the settings for yourself. Configure lines deviation. Specify volatility coefficient. Advantages The indicator does not repaint
FREE

Suporte e resistência Omega Um indicador exclusivo para estratégias de comprar na baixa e vender na alta Entradas do tipo reversão, à medida que o preço sobe até a linha completa, espera-se que o preço gire/oscile/reverta Pode negociar gráficos de 1 a 5 minutos com 4 horas para configurações interdiárias ou m15 e superiores com diários, 1 hora com semanais para configurações de longo prazo Preditor de preços futuros de alta precisão para alta ou baixa de qualquer produto para gráficos semanais,
FREE
Mergulhe em um ambiente de negociação onde a adaptabilidade encontra a precisão. O Dynamic Grid Pro v1.7 oferece um conjunto de ferramentas projetado para refinar sua abordagem no mercado. Este sistema foi desenvolvido com a intenção de fornecer uma estrutura flexível para a execução de estratégias de negociação de grade. Sua funcionalidade principal reside na capacidade de ajustar dinamicamente os parâmetros da grade em resposta às condições de mercado em constante mudança. Recursos do Dynamic

Indicator draws Round Number lines by distance of pips. 1. You can enable / disable indicator to show / hide the lines. 2. You can set distance of pips between the lines. 3. You can edit the number of lines. 4. You can edit properties of lines by inputs (style (DASH, DOT, SOLID, ...) , width (1 for DASH, DOT, 2 is not for DASH, DOT, it only SOLID), color). When indicator is deleted from the chart, the lines will be removed.
FREE

This indicator is a professional Trend identifier, it measures the angle or slope of moving averages with different methods. As this indicator calculate angles you can identify the strength of trend by magnitude of angle. It also shows if angle is increasing or decreasing which gives you the opportunity to make more information about current trend. You can combine this indicator with your strategy as a filter or you can use it alone to make your trading system. This is not a repainting indicator
FREE

Este produto foi projetado para exibir os pregões de 15 países com base no fuso horário do servidor da sua corretora e vários modos de exibição com base nas configurações desejadas para evitar o congestionamento do gráfico e a possibilidade de definir uma sessão com o horário desejado pelo usuário.
O sol nunca se põe no mercado cambial, mas o seu ritmo dança ao ritmo de sessões de negociação distintas. Compreender estas sessões, as suas sobreposições e as suas atmosferas únicas é crucial para
FREE

O Average True Range ( ATR ) é uma medida da volatilidade do mercado durante um determinado número de dias. Não se deve esperar um grande movimento de continuação quando o preço tiver atingido o fim do intervalo. Considera-se que o mercado está a ficar sem combustível. Se o preço não tiver atingido o limite, ainda tem uma margem de movimento. A fórmula do indicador permite-lhe calcular os níveis Alto-Baixo tanto de forma agregada como individual. Também pode utilizar estes níveis como suporte/r
FREE

Calculating the number of lots needed so as to make sure you are risking a specific percent of account balance can be tedious. Luckily, there are websites that make this task a lot easier. This indicator takes things to the next level as it ensures you don’t have to leave the metatrader platform to perform these calculations.
The lot-size calculator is a simple calculator that works in all forex currency pairs, BTCUSD, US500, HK50 and XTIUSD. For more free stuff: http://abctrading.xyz
FREE
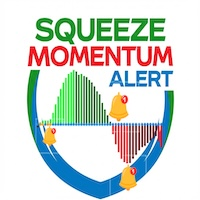
Squeeze Momentum Alert 1. Identifica Pontos de "Explosão" do Preço (The "Squeeze") A maior vantagem é capturar períodos de "consolidação" ou "acumulação de energia" antes de um grande movimento. Por que é bom: O mercado alterna entre calmaria e volatilidade. Esta ferramenta diz: "O gráfico está se comprimindo, prepare-se para o disparo" , para que você não perca o início da tendência. 2. Distingue a "Força" da Tendência (Color Coded Momentum) O histograma usa 4 cores para indicar a saúde da tend

Trend Alchemist: Turn Market Chaos into Trading Gold! Are you tired of conflicting signals and getting caught on the wrong side of the trend? The Trend Alchemist indicator cuts through the noise to give you clear, high-probability entry and exit points. This powerful system combines the reliable trend filtering of Multiple Exponential Moving Averages (EMAs) with the precise timing of the Stochastic Oscillator . It doesn't just show you the trend; it confirms the market alignment and pinpoints t
FREE
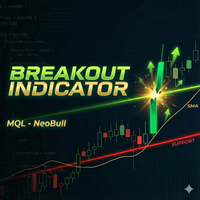
Indicador NeoBull Breakout - Trading Profissional de Rompimentos Facilitado O Indicador NeoBull Breakout é um poderoso indicador técnico para MetaTrader 4 , projetado especificamente para traders de rompimentos. Ele combina níveis comprovados de Máxima Mais Alta/Mínima Mais Baixa com o filtro de tendência SMA 200 para identificar configurações de rompimento de alta probabilidade. Funções Principais: Linha de Máxima Mais Alta Escalonada (20) - Mostra a máxima mais alta dos últimos 20 períodos co
FREE

This indicator displays buy or sell signals according to Bill Williams' definition of the Trading Zone. [ Installation Guide | Update Guide | Troubleshooting | FAQ | All Products ] Easy to use and understand Avoid trading flat markets Deterministic indicator with clear rules The indicator is non-repainting It implements alerts of all kinds It has straightforward trading implications. A blue arrow is a buy signal A red arrow is a sell signal According to Bill Williams trading in the zone helps to
FREE
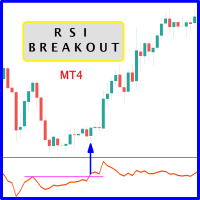
When prices breakout resistance levels are combined with Relative Strength Index "RSI" oscillator breaks out its historical resistance levels then probability emerges to record farther prices. It's strongly encouraged to confirm price breakout with oscillator breakout since they have comparable effects to price breaking support and resistance levels; surely, short trades will have the same perception. Concept is based on find swing levels which based on number of bars by each side to confi
FREE

Conquer the Markets with the Triple Threat Signal ! Tired of signals that leave you guessing? Introducing the Triple Threat Signal , the smart indicator that cuts through market noise to deliver high-probability trade setups. This isn't just another indicator; it's a complete, multi-layered system designed for traders who demand precision, confirmation, and confidence . Why You Need the Triple Threat Signal The market moves fast. You need a tool that confirms a trade from multiple angles before
FREE
T3 2Lines – Análise de Tendência Precisa com Duas Médias Móveis T3 O “T3 2Lines” é um indicador para MT4 que exibe duas linhas T3 (Média Móvel Exponencial Tripla) diretamente no gráfico — uma de curto prazo e outra de longo prazo. Ao combinar essas duas curvas suavizadas, os traders podem identificar com maior clareza o início, a continuação e possíveis reversões de tendências. Principais Funcionalidades Exibição simultânea de duas linhas T3 (curta e longa) Período e fator de suavização (b) conf
FREE

All-in-one trading powerhouse: trend, reversal, and exhaustion detection
This indicator is a personal implementation of the famous Traders Dynamic Index, which uses RSI, moving averages and volatility bands to find trends, reversals and price exhaustions. However, this particular implementation supports not only RSI, but many others. It is suitable for scalping, day trading, and swing trading and aims to provide a full picture of the current market conditions. [ Installation Guide | Update Guid
FREE

How the Indicator Works:
This is a Multi-timeframe MA multimeter indicator which studies if price is above or below a particular EMA range and shows Red/Green/Yellow signals. Red: Price Below EMA range Green: Price above range Yellow: Price within range
Indicator Properties:
EMA Settings: - Default Period is 200. You can change all MA Settings like Period, MA Method (SMA, EMA, etc) or MA Applied Price (Close, Open, etc).
- EMA Range list is a comma separated value list for different timeframes
FREE

FREE TopClock Indicator: This indicator is an Analog Clock That Shows: Local Time Of Pc or Time Of Broker Server or sessions(Sydney -Tokyo London -NewYork)Time or custom Time( with GMT -Base) this can shows Candle Time Remainer with Spread live. You can run this indicator several times for different times and move it to different places on the chart. If you would like, this indicator can be customized for brokers and their IB based on customer needs. For more information contact us if you
FREE

Χ15 indicator is a MetaTrader 4 tool that allows you to BUILD & BACKTEST ON REAL TIME your own strategies quickly, easily and efficiently. It contains 15 of the most popular technical analysis indicators that you can use, each one in a different way. Choose the indicators that you want to use, select how you will use them and you will see on the chart BUY (green) and SELL (red) arrows implementing your strategy. Choose Take Profit and Stop Loss and you will see the results of your strategy with
FREE

This indicator is suitable for trading Forex and Binary Options, depending on its settings. The indicator is designed for trend trading. A buy signal: An up arrow appears on the chart. A sell signal: A down arrow appears on the chart.
Input parameters === Setup CCI === Period CCI 1 - Period of the CCI Period CCI 2 - Period of the CCI Level BUY - Level of the CCI for buying Level SELL - Level of the CCI for selling === Setup RSI === Level SELL - Level of the RSI for selling Period SELL - Period
FREE

This indicator allows you to manage your exposure and see how the lot changes. You can choose the optimal lot value for your deposit without opening real positions. And also evaluate new trading instruments. If you trade manually, then risk management will help you avoid unexpected losses. The indicator includes the ability to receive a sound signal when a specified level is reached, as well as send push notifications and a message to the mail.
FREE

''Trendlines'' is an Indicator, that every Trader need and shows Trendline and Support and resistance levels in all Timeframe's. Also In 1-hour, 4-hour and daily time frames and Current timeframes, support, and resistance levels are specified and trend lines are drawn so that the trader can see all levels on a chart. In Properties it is possible to turn off unnecessary Lines.
In ' Tendency indicator '' , as full package of Predictions that every Trader need, there is also the Predict
FREE

The "Trend Edges" indicator determines whether the trend is rising or falling. It is suitable for any time frame (tested on DAX).
The indicator should be treated like Bollinger Bands, meaning that if it breaks out upwards, you can buy with a stop loss below the lower edge.
Find a trending pair, index or CFD. Additionally :
-Sound alert on trend change.
-Alert Notification
-Alert Notification on your mobile phone Check my other indicator "Trend Edges histogram"
FREE
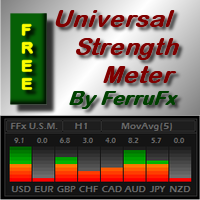
PRO version is available here: https://www.mql5.com/en/market/product/12648 FFx Universal Strength Meter is more than a basic strength meter. Instead of limiting the calculation to price, it can be based on any of the 19 integrated strength modes + 9 timeframes. With the FFx USM, you are able to define any period for any timeframe. For example, you can set the dashboard for the last 10 candles for M15… Full flexibility! Very easy to interpret... It gives a great idea about which currency is weak
FREE

The indicator looks for consolidation (flat) in the market at a certain time, builds a box-channel and marks levels indented from it for a breakdawn. After crossing one of the levels, the indicator marks the zone for take profit and calculates the corresponding profit or loss in the direction of this entry on the panel. Thus, the indicator, adjusting to the market, finds a flat area of the market, with the beginning of a trend movement to enter it. Version for MT5: https://www.mql5.com/en/market
FREE

Description
SuperCCI is an indicator based on the standard CCI indicator. It identifies and displays convergences/divergences in the market and forms the corresponding entry points. Also, using the trading channel index, it determines the direction of the trend and displays the levels of support and resistance .
Features Not repaint. Shows entry points. Shows the direction of the current trend and support/resistance levels. Has notifications. Recommendations
Use convergence/divergence to ide
IceFX VelocityMeter é um indicador muito único na plataforma MetaTrader 4, que mede a velocidade do mercado forex. Ele não é um indicador de volume normal ou de outra medida pois o IceFX VelocityMeter é capaz de entender os movimentos de velocidade do mercado, que estão escondidos em ticks e estas valiosas informações não podem ser lidas de forma ordinária nas velas. O software monitora os ticks recebidos (freqüência, magnitude da mudança) dentro de um intervalo de tempo especificado, analisa e
FREE

MASi Three Screens is based on the trading strategy by Dr. Alexander Elder. This indicator is a collection of algorithms. Algorithms are based on the analysis of charts of several timeframes. You can apply any of the provided algorithms.
List of versions of algorithms:
ThreeScreens v1.0 - A simple implementation, with analysis of the MACD line; ThreeScreens v1.1 - A simple implementation, with analysis of the MACD histogram; ThreeScreens v1.2 - Combines the first two algorithms in
FREE

SX Price Action Patterns is a comprehensive indicator which shows various price action patterns on the chart for those who are interested in price action trading. These patterns are as follows: A Pin Bar is a candlestick price bar, which has a long wick on one side and a small body. It is a powerful signal of price reversal in a currency trading strategy. An Inside Bar is characterized by a bar or candle that is entirely ‘inside’ the range of the preceding one and represents the consolidation o
FREE

Trend Lines Cross This indicator will alert you on any cross of a Trendline. You can draw up to two trend lines and form a channel, a pennant , a triangle or a simple trend and when the price crosses either trend line the indicator will provide you with alerts that you define plus an up or down arrow when the cross happened. How to: Draw the 1st trendline and name it tl1. Draw the 2nd trendline and name it tl2. Select which type of alerts you would like in the indicator properties and you a
FREE
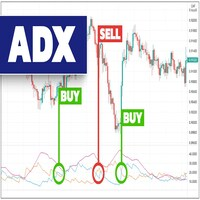
The indicator provides buy and sell signals on the charts every time ADX DI- and DI+ crosses each other. Blue arrow for uptrend (DI+>DI-). Red arrow for downtrend (DI->DI+). This technical analysis tool can be applied to various trading strategies. The ADX Crosses Signals Indicator is based on the Average Directional Index Metatrader Indicator. The ADX is a lagging indicator, meaning that a trend must already be established before the index can generate its signal.
Inputs PERIOD; AlertOn
FREE

Simple ATR Stop Loss : Sua bússola de volatilidade do mercado que ajuda você a navegar pelas águas traiçoeiras do trading , configurando Stop Losses mais inteligentes e fazendo você parecer um ninja do trading (capa não incluída). Atenção, aficionados por trading e especialistas do mercado! Contemplem o indicador Simple ATR Stop Loss – seu novo melhor amigo no mundo selvagem do trading. É mais simples que um quebra-cabeça de duas peças mas mais poderoso que um touro cafeinado em
FREE

FTU Fibonacci Este indicador desenha níveis de Fibonacci para sistemas de entrada do tipo retração ** assista ao vídeo para sugestão de estratégia Características: Vários níveis de Fibonacci ajustáveis Altere a cor e a quantidade de barras do intervalo 2 linhas para 50 barras antes da retração de alta-baixa e 2 linhas para 20 barras As linhas estão mostrando 38 e 61 níveis de Fibonacci Uso: O objetivo é estudar ou medir a retração de preço Altere a cor e a quantidade de barras do intervalo. Use
FREE

2 SNAKES é um sistema de escalpelamento de primeira classe.
Como as entradas são bastante precisas, é provável que você se torne viciado nesse sistema muito rapidamente.
Você tem 2 cobras. Quando você vê uma vela acima ou abaixo delas que não as toca, esse é o seu sinal de escalpelamento.
Se você usar um período de tempo maior, o scalping pode se tornar um acompanhamento de tendência. As snakes são calculadas precisamente em relação ao estado atual do mercado. Elas NÃO SÃO médias móveis.

Descption: The Volume Profile displays detailed informations of historical trading activities at certain price levels (Market Profile). So you can locate the areas with the best prices in the market and get an advantage about other market participants.
Features: Customizable Volume Profile / Market Profile Shows the "fair" Value Area with 70% of all Volume
Shows critical low volume zones
Shows VPOC, VAL and VAH Points Works on all timeframes Also available for MT5 ( https://www.mql5.com/en/mark

Ou (BD%), que é um índice de volatilidade que mede a volatilidade em porcentagem ao invés de pontos. A ideia do BD% é fazer um índice dependendo do Desvio Padrão Clássico (CSD) que se move entre 0 e 100 por cento.
Você pode usar BD% para comparar a volatilidade do mesmo título em diferentes períodos de tempo ou intervalos de tempo diferentes. Além disso, você pode usar BD% para comparar a volatilidade entre diferentes títulos em diferentes mercados em termos de porcentagem, em vez de pontos.
Melhore sua vantagem no trading com o Super Woodies CCI Indicator MT4, um oscilador de momentum avançado inspirado no renomado sistema Woodies CCI de Ken Wood, que ganhou popularidade no início dos anos 2000 entre day traders por sua abordagem dual-CCI para detectar padrões cíclicos e setups de alta probabilidade. Amplamente favorecido por traders de forex, ações e commodities, este indicador aproveita o Commodity Channel Index (CCI) para detectar condições de sobrecompra/sobrevenda, continuaçõe
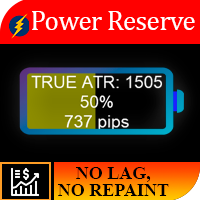
Lógica de trabalho A importância deste indicador reside no fato de que ele permite que você entenda quanto “ainda resta combustível no instrumento”. Imagine a situação, você saiu de um carro com a bateria meio descarregada, em média, essa quantidade de energia costuma ser suficiente para um carro por 250 km, então se você quiser não pode ultrapassar uma distância de 700 km. Assim, para cada instrumento, existe um certo movimento diário de preço e, como resultado de observações estatísticas, foi
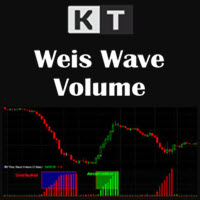
O indicador KT Weis Wave Volume é uma ferramenta técnica baseada na tendência atual do mercado e na direção do movimento dos preços. O indicador utiliza o volume e exibe os volumes acumulados para os aumentos e quedas de preço no gráfico.
Além disso, a janela do indicador mostra um histograma de ondas verdes e ondas vermelhas em ascensão.
A cor verde representa o movimento de alta; quanto mais o preço sobe, maior é o volume verde. A cor vermelha representa uma onda de baixa; o volume vermelho

Aprimore sua precisão de negociação com o indicador WaveTrend Oscillator Indicator MT4, uma ferramenta baseada em momentum adaptada do icônico script de LazyBear de 2014 no TradingView, renomado por sua precisão em detectar reversões de mercado e mudanças de momentum. Celebrado amplamente na comunidade de trading por mais de uma década, este oscilador combina elementos semelhantes a RSI e MACD para detectar condições de sobrecompra/sobreventa, tornando-o um elemento essencial para traders em for

The tool is used to calculate the size of the position that can be opened with the previously assumed risk. The risk can be defined as: percentage value of the account (%), nominal value, expressed in the account currency. The size of position is determined by the distance of the planned SL (red line).
Input Parameters Lost_in_Money - if true, the value of the acceptable loss is determined by the parameter "Acceptable_loss", else acceptable loss is determined by the parameter "Acceptable_Risk_P

Ichimoku Multicurrency Scanner Dashboard MT4 é uma ferramenta de trading poderosa projetada para monitorar múltiplos pares de moedas e períodos de tempo usando Ichimoku Kinko Hyo. Ela organiza os sinais em um formato de grade, com símbolos agrupados por moedas base e períodos de tempo, variando de M1 a MN1. Os traders podem habilitar ou desabilitar períodos de tempo específicos para se adequar às suas estratégias. A ferramenta exibe sinais com base nas seguintes estratégias: Kijun Cross Strategy

This indicator lets you easily mark the daily open levels on a chart with several possibilities of customization. For many trading strategies, the daily open level is an important level to base trading decisions on. That is why I chose to create this indicator that is designed to assist you with trading these strategies, as well as further optimizing them and getting a general understanding of the markets movements. With this tools help, you can easily take a look at the previous price action ar
FREE

Níveis de Stop Out e Margin Call – Seu Assistente de Gestão de Risco Tenha controle total do risco das suas operações com este indicador que exibe dinamicamente os principais níveis no gráfico: Stop Out, Margin Call, Margem Livre e um nível personalizado à sua escolha. Perfeito para traders que utilizam alta alavancagem ou estratégias all-in, onde cada ponto importa e a tolerância ao risco é mínima. Totalmente personalizável – configure cor, estilo, espessura e visibilidade de cada linha individ
O FVG Zone Indicator é uma ferramenta poderosa projetada para identificar Fair Value Gaps (FVG) no mercado, destacando desequilíbrios de preço entre o valor justo e o preço de mercado. Essa identificação precisa de gaps permite que os traders identifiquem potenciais pontos de entrada e saída do mercado, aumentando significativamente sua capacidade de tomar decisões comerciais informadas. Com sua interface intuitiva e amigável, o Indicador de Zona FVG escaneia automaticamente os gráficos em b
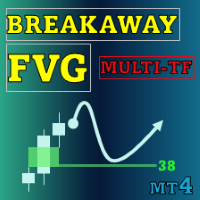
Special offer : ALL TOOLS , just $35 each! New tools will be $30 for the first week or the first 3 purchases ! Trading Tools Channel on MQL5 : Join my MQL5 channel to update the latest news from me A ferramenta Breakaway Fair Value Gaps (FVG) é uma solução inovadora projetada para ajudar traders a identificar áreas onde o preço se afastou do equilíbrio, fornecendo insights detalhados sobre as probabilidades de mitigação. Esta ferramenta não apenas destaca sinais críticos, mas també

THE PRICE ACTION INDICATOR! This program finds candlestick absorption patterns and a false breakdown, after which it draws the entry points with arrows.
Input parameters:
1. PPR_Arrow The On parameter/Off display of the absorption model arrows. By default, it is set to true.
2. FB_Arrow Everything is the same as the first parameter, only for false breakdown models. By default, it is set to true.
Sincerely, Novak Production.
FREE

O indicador Boom and Crash Spike Detector é codificado com base em uma estratégia avançada principalmente para detectar o Boom e o Crash nos preços. Algoritmos complexos foram implantados para detectar Booms e Crashs de alta probabilidade nos preços. Ele alerta sobre possíveis fases de Boom ou crash: Fase Boom: Quando o preço aumenta muito rápido. Fase Crash: Quando o preço cai muito rápido.
OFERTA POR TEMPO LIMITADO: O Indicador está disponível por apenas 30$ e vitalício.
Características prin

Please refer to full version: https://www.mql5.com/en/market/product/140908
Key Zone Detector Key Level Supply & Demand Zone Detector Overview A sophisticated supply and demand zone detection indicator that identifies and rates key price levels where significant market activity occurs. The indicator uses fractal analysis and multiple validation methods to detect and classify trading zones. Key Features Zone Detection Auto-detects support and resistance zones Uses dual fractal system (fast and
FREE

Volume Delta is a very powerful indicator that reads the supply on the Market. It calculates the Delta from movement of the price and the difference of BUY and SELL Tick volumes. Its special structure allows you to get all timeframe values available on the MT4 platform. A good observation of this instrument can suggest great entry points and possible reversal. We are confident that this tool will help you to improve your trading timing. See also for MT5: https://www.mql5.com/en/market/product/5

VR Ticks é um indicador especial para estratégias baseadas em scalping. Graças a este indicador, o trader pode ver o gráfico de ticks diretamente no gráfico principal do instrumento financeiro. Um gráfico de ticks permite que você insira uma posição no mercado ou feche uma posição no mercado com a maior precisão possível. VR Ticks plota os dados dos ticks na forma de linhas que mudam de cor dependendo da direção - isso permite compreender e avaliar visualmente a situação nos ticks. A vantagem do
FREE
Apresentando o Indicador de Desenho no Gráfico: Libere sua Criatividade nos Gráficos!
Você está cansado de lutar para fazer anotações em seus gráficos de negociação, tentando dar sentido à sua análise ou comunicar suas ideias de forma eficaz? Não procure mais! Temos o prazer de apresentar o Indicador de Desenho no Gráfico, uma ferramenta inovadora que permite que você desenhe e faça anotações em seus gráficos com apenas alguns cliques ou traços de sua caneta.
Nosso inovador Indicador de Desen
FREE
O Mercado MetaTrader é a única loja onde você pode baixar um robô demonstração de negociação gratuitamente para testes e otimização usando dados históricos.
Leia a visão geral e opiniões de outros clientes sobre os aplicativos, faça o download para o seu terminal e teste um robô de negociação antes de comprá-lo. Apenas no Mercado MetaTrader você pode testar um aplicativo de forma absolutamente gratuita.
Você está perdendo oportunidades de negociação:
- Aplicativos de negociação gratuitos
- 8 000+ sinais para cópia
- Notícias econômicas para análise dos mercados financeiros
Registro
Login
Se você não tem uma conta, por favor registre-se
Para login e uso do site MQL5.com, você deve ativar o uso de cookies.
Ative esta opção no seu navegador, caso contrário você não poderá fazer login.