
Price Action Analysis Toolkit Development (Part 27): Liquidity Sweep With MA Filter Tool

Contents
Introduction
Large institutional traders do not influence the markets by chance. Their strategy often involves pushing prices beyond well-known support or resistance levels, intentionally triggering smaller orders such as stop-losses and pending entries. This brief movement, called a liquidity sweep, allows them to acquire or offload large positions at more favorable prices without immediately counteracting the market’s direction.
For many retail traders, these moves can feel like deceptive traps. The price may dip below a familiar low, triggering stop-losses, only to bounce back quickly. Conversely, it might break above resistance, triggering stops, and then sharply reverse. Once the major players have absorbed this influx of liquidity, the market often resumes its prior trend with renewed strength. Recognizing these liquidity sweeps early can help traders avoid being stopped out prematurely and instead position themselves to follow the institutional flow, rather than reacting to their temporary shakeouts.
In this article, we will develop an MQL5 Expert Advisor designed to identify liquidity sweeps as they unfold. The EA begins by analyzing candles that break below or above previous swing points, then close back within the range, indicators of potential liquidity absorption. It incorporates optional filters, such as candlestick color changes or moving average confirmations, to ensure the signals align with your market bias. When a valid pattern is detected, the EA visually marks it on the chart with arrows or labels and generates an alert.
By the end of the tutorial, you will have a comprehensive, clear, and straightforward Expert Advisor highlighting liquidity sweeps immediately. You will learn how the EA detects these specific market patterns, how it employs filters to reduce false signals, and how it helps you stay aligned with the actions of the smart money. With this tool in your arsenal, you can anticipate institutional moves before they trap your stop-loss, providing a strategic advantage in any trading environment.
Understanding The Strategy
A liquidity sweep can form in two ways, either as a bullish sweep (a false break below support) or as a bearish sweep (a false break above resistance). The EA’s core detection logic lives in the DetectLiquiditySweep function. Below is a step-by-step breakdown of how it distinguishes between the two, followed by the exact MQL5 code snippet that performs the boolean checks.
As soon as a new candle closes, the EA calls
DetectLiquiditySweep(1);
Passing shift=1 means:
- Index 1 (shift) refers to the just-closed bar (the “current” candle that we want to test).
- Index 2 (shift + 1) refers to the bar directly before it (the “previous” candle).
- Inside DetectLiquiditySweep, these lines grab open/high/low/close for both bars:
double o   = iOpen(Symbol(), Period(), shift);
double c   = iClose(Symbol(), Period(), shift);
double h   = iHigh(Symbol(), Period(), shift);
double l   = iLow(Symbol(), Period(), shift);

double o1  = iOpen(Symbol(), Period(), shift + 1);
double c1  = iClose(Symbol(), Period(), shift + 1);
double h1  = iHigh(Symbol(), Period(), shift + 1);
double l1  = iLow(Symbol(), Period(), shift + 1);
- (o, h, l, c) are the open, high, low, and close of the new bar.
- (o1, h1, l1, c1) are the same values for the immediately preceding bar.
The EA allows two slightly different definitions, controlled by the SignalStrict input:
1. LessStrict (default)
Bullish Sweep:
- The new bar must close higher than it opened: c > o.
- Its low must dip below the previous bar’s low: l < l1.
- Its close must also be above the previous bar’s open: c > o1. (This prevents a pure doji or a tiny false candle from qualifying.)
- The previous bar was not a doji: c1 != o1.
- The new bar must close lower than it opened: c < o.
- Its high must spike above the previous bar’s high: h > h1.
- Its close must also be below the previous bar’s open: c < o1.
- The previous bar was not a doji: c1 != o1.
2. Strict
Bullish Sweep:
Exactly the same as LessStrict, except that step 2 is tightened from “low < previous low” to also require that the close is higher than the previous high (c > h1). In other words, the new bar must dip below and also reclaim past the prior high before closing.
Bearish Sweep:
Similarly, the new bar must close below the previous low (c < l1) after spiking above the prior high (h > h1), instead of merely piercing above the prior high.
These boolean tests live in the code block below
//--- Liquidity sweep logic (LessStrict vs Strict)
bool bullSweep, bearSweep;
if (SignalStrict == LessStrict)
  {
    bullSweep = (c > o &&    // 1) Bullish candle
                 l < l1 &&   // 2) Low dipped below previous low
                 c > o1 &&   // 3) Close above previous open
                 c1 != o1);  // 4) Previous bar was not a doji

    bearSweep = (c < o &&    // 1) Bearish candle
                 h > h1 &&   // 2) High spiked above previous high
                 c < o1 &&   // 3) Close below previous open
                 c1 != o1);  // 4) Previous bar was not a doji
  }
else // Strict
  {
    bullSweep = (c > o &&    // 1) Bullish candle
                 l < l1 &&   // 2) Low dipped below previous low
                 c > h1 &&   // 3) Close above previous high (stricter)
                 c1 != o1);  // 4) Previous bar was not a doji

    bearSweep = (c < o &&    // 1) Bearish candle
                 h > h1 &&   // 2) High spiked above previous high
                 c < l1 &&   // 3) Close below previous low (stricter)
                 c1 != o1);  // 4) Previous bar was not a doji
  }
- In LessStrict mode, step 3 only requires c > o1 (for bullish) or c < o1 (for bearish).
- In Strict mode, step 3 changes to c > h1 (bullish) or c < l1 (bearish).
If the user has set ColorChangeOnly = true, the EA requires the new bar to be the opposite color of the prior bar. Specifically:
bool bullCC = (c > o && c1 < o1);   // New bar bullish, old bar bearish
bool bearCC = (c < o && c1 > o1);   // New bar bearish, old bar bullish

if (ColorChangeOnly)
  {
    bullSweep &= bullCC;  // Only a bullish sweep if also a bull‐after‐bear color flip
    bearSweep &= bearCC;  // Only a bearish sweep if also a bear‐after‐bull color flip
  }
If ColorChangeOnly is false, these two lines have no effect and both bullSweep and bearSweep remain as determined by the previous price tests.
Once bullSweep or bearSweep is true (after the price and optional color tests), the EA can further filter based on a moving average. This is controlled by UseMAFilter and PriceAboveMA. In essence:
- Calculate a single MA value at index shift (the just‐closed bar), either via a built-in iMA() handle (for SMA, EMA, LWMA, or RMA) or a custom function (CalcVWMA or CalcHMA).
bool cond = PriceAboveMA ? (c > maValue) : (c < maValue);
- If PriceAboveMA == true, the EA only keeps bullSweep if c > maValue and forcibly sets bearSweep = false.
- If PriceAboveMA == false, the EA only keeps bearSweep if c < maValue and forcibly sets bullSweep = false.
if (UseMAFilter)
  {
    double maValue = 0.0;

    if (MAType == VWMA)
         maValue = CalcVWMA(shift);
    else if (MAType == HMA)
         maValue = CalcHMA(shift);
    else
      {
        double buf[];
        if (CopyBuffer(MAHandle, 0, shift, 1, buf) != 1)
          return;  // not enough MA data yet
        maValue = buf[0];
      }

    // Keep only bullish sweeps if price > MA, or only bearish if price < MA
    bool cond = PriceAboveMA ? (c > maValue) : (c < maValue);
    bullSweep &= cond;
    bearSweep &= !cond;
  }
In Summary
Bullish Sweep:
- Candle closes higher than it opened and dips below the prior low and closes above the prior open (LessStrict) or prior high (Strict).
- Optionally, it must be a bullish‐after‐bearish color change.
- Optionally, the close must be above the moving average.
- If all tests pass, the EA places a green up arrow (OBJ_ARROW_UP) a few points below that candle’s low.
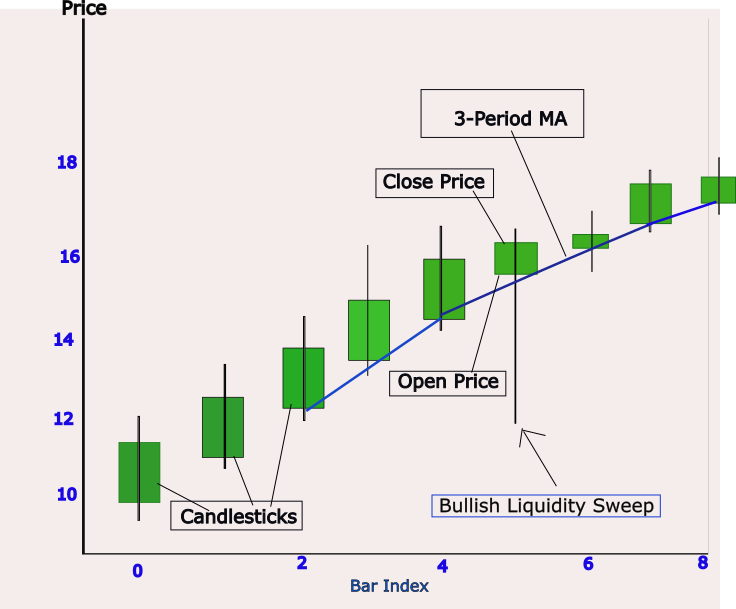
Fig. 1. Bullish Sweep
Bearish Sweep:
- Candle closes lower than it opened and spikes above the prior high and closes below the prior open (LessStrict) or prior low (Strict).
- Optionally, it must be a bearish‐after‐bullish color change.
- Optionally, the close must be below the moving average.
- If all tests pass, the EA places a red down arrow (OBJ_ARROW_DOWN) a few points above that candle’s high.
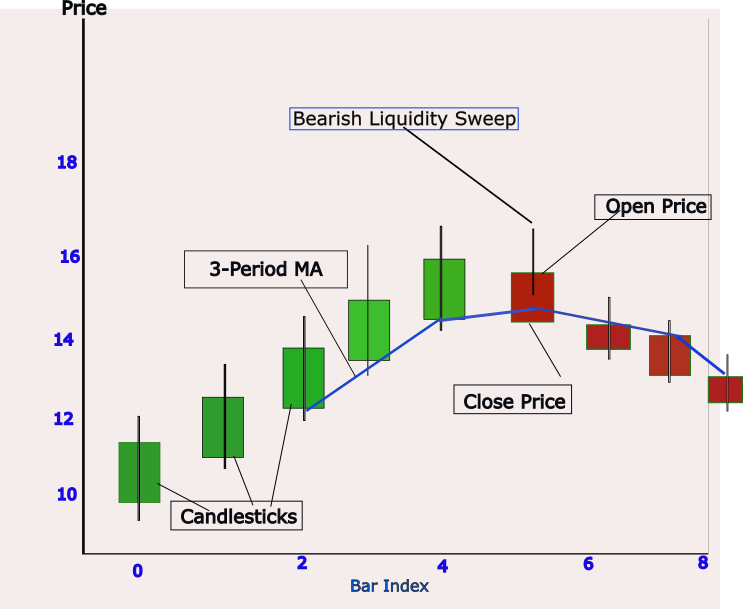
Fig. 2. Bearish Sweep
Code Breakdown
The “Liquidity Sweep with MA filter” EA is designed to identify and visually mark false-break moves-often referred to as liquidity sweeps-on any chart in MetaTrader 5. At its core, the EA watches for bars that push below (or above) the prior bar’s swing low (or high) and then close in a manner suggestive of trapped orders. By combining this detection logic with an optional moving-average filter, traders can refine signals to align with broader trend context. In the following paragraphs, we will walk through every major component of the EA, explaining both what each section does and why it matters in a cohesive, step-by-step narrative.
To begin, the EA file declares its metadata-title, copyright, author link, and version-immediately followed by #property strict. These lines are not merely decorative: they serve two purposes. First, they identify the script for anyone browsing multiple EAs, making it clear who the author is and where to find more of their work. Second, by specifying #property strict, the compiler enforces stricter syntax and type checking, catching common mistakes (such as undeclared variables or type mismatches) before the code ever runs. This practice of clear metadata and strict compilation reflects a professional standard, ensuring both maintainability and reliability.
//+------------------------------------------------------------------+
//|                                    Liquidity Sweep with MA filter|
//|                                   Copyright 2025, MetaQuotes Ltd.|
//|                           https://www.mql5.com/en/users/lynnchris|
//+------------------------------------------------------------------+
#property copyright "Copyright 2025, MetaQuotes Ltd."
#property link      "https://www.mql5.com/en/users/lynnchris"
#property version   "1.0"
#property strict
Next, the EA includes the Trade.mqh library. Even though this particular version does not automatically place real trades, including <Trade\Trade.mqh> is forward-looking: it makes the powerful CTrade class available for any future enhancements that might open, modify, or close positions. In a tutorial context, it also signals to readers that this EA could easily evolve into a fully automated strategy executor—simply by invoking trade.Buy(...) or trade.Sell(...) inside the detection logic. By demonstrating this inclusion up front, the author primes the reader to think about both analysis and execution.
#include <Trade\Trade.mqh> Following the library inclusion, the EA defines a set of input parameters, which become visible in MetaTrader’s Inputs dialog when the EA is attached to a chart. These inputs fall into three logical groups. The first group, Moving Average settings-allows the user to toggle an MA filter on or off (UseMAFilter), choose whether to display that MA on the chart (ShowMA), select the MA period (MALength), and pick among six MA types (SMA, EMA, LWMA, VWMA, RMA, or HMA). A booleanPriceAboveMA then dictates whether the EA should require price to be above (for bullish sweeps) or below (for bearish sweeps) the MA.
In practice, this filter ensures that traders only take liquidity sweeps in the direction of the prevailing trend, reducing false positives when the market is against them.
//--- Inputs: Moving Average Filter
input bool   UseMAFilter       = false;    // Enable Moving Average Filter
input bool   ShowMA            = false;    // Show MA on chart
input int    MALength          = 20;       // MA period (must be >=1)
enum MA_Type {SMA=0, EMA, LWMA, VWMA, RMA, HMA};
input MA_Type MAType           = SMA;      // Moving Average type
input bool   PriceAboveMA      = true;     // Filter: price above MA?
The second group of inputs controls how rigidly the EA defines a sweep. An enumeration SignalStrict offers two modes: “LessStrict” requires only that the new bar’s low (for bullish signals) be below the previous low (and vice versa for bearish), whereas “Strict” demands an additional break of the prior bar’s high (or low). By exposing this flag, readers learn how to calibrate sensitivity: some prefer a looser interpretation that catches more signals, while others want a more conservative approach that waits for a clear breach.
A complementary boolean, ColorChangeOnly, further tightens the conditions by insisting that the new bar’s color (bullish vs. bearish) be opposite the preceding bar’s color. In many trading philosophies, a color change signals a shift in momentum, so this option appeals to those who only want to mark reversals that coincide with a visible candle flip.
//--- Inputs: Sweep Definition Strictness
enum Strictness {LessStrict=0, Strict};
input Strictness SignalStrict  = LessStrict; // Signal strictness
input bool   ColorChangeOnly   = false;      // Only on color-change candles
The third group concerns on-chart visuals. A LabelType enumeration allows for no label, a short two-letter label (“BS” for bull sweep, “SS” for sell sweep), or a full text label (“Bull Sweep” or “Bear Sweep”). In parallel, PlotArrow lets traders draw an arrow instead of (or in addition to) text. To avoid clutter and ensure that labels don’t overlap candles, the ArrowOffsetPoints input moves each arrow or text object a specified number of points above (for bearish) or below (for bullish) the candle.
Finally, two color inputs-BullishColor and BearishColor, give complete control over the hue of these markers, letting the user match them to their charting theme. By separating display options from detection logic, the EA remains flexible: traders can configure it in “silent alert” mode (no on-chart objects) or in full “chart annotation” mode based on their personal preference or system performance needs.
//--- Inputs: Label/Arrow & Color Customization
enum LabelType {None=0, Short, Full};
input LabelType LblType        = Full;       // Label type (None/Short/Full)
input bool      PlotArrow      = true;       // Draw arrow on signal
input int       ArrowOffsetPoints = 10;      // Offset (in points) above/below candles
input color     BullishColor   = clrLime;    // Color for bullish signals
input color     BearishColor   = clrRed;     // Color for bearish signals
Immediately after the input section, the EA declares two global variables. The first, datetime lastBarTime, stores the timestamp of the most recently processed bar. This variable is pivotal: on each tick, the EA compares the current bar’s start time (iTime(Symbol(),Period(),0)) to lastBarTime. If they differ, it means a new candle has formed, and only then does the EA execute its detection routine. Without this check, the logic would run on every tick of a forming bar, causing multiple signals on one candle and introducing what is commonly referred to as “repainting.”
The second global, int MAHandle, holds the indicator handle returned by iMA(...) whenever a built-in MA is created. By initializing it to INVALID_HANDLE, the code can later test whether a valid handle actually exists before trying to read from it.
//--- Globals
datetime   lastBarTime = 0;               // Timestamp of the last processed bar
int        MAHandle    = INVALID_HANDLE;  // Handle for built‐in MA indicator
The OnInit() function is the EA’s setup routine. When the EA is first attached, or whenever someone changes an input-the platform calls OnInit(). The first task here is to validate MALength. Since MQL5 treats any input as a constant after compilation, we cannot simply reassign a safe value; instead, the code checks if(MALength < 1), prints an error message, and returns INIT_FAILED if the user specified an invalid period. This defensive programming ensures that the EA never attempts to compute an MA over zero or negative bars, which would otherwise cause runtime errors or nonsensical results. Next, lastBarTime is set to the current bar’s start time-seeding the tick-handler logic so that it won’t immediately fire on the bar during which it was attached.
int OnInit()
  {
   // Validate MALength (cannot assign to an input directly)
   if(MALength < 1)
     {
      Print("ERROR: MALength must be at least 1. Current value = ", MALength);
      return(INIT_FAILED);
     }

   // Initialize timing so we only run when a new bar closes
   lastBarTime = iTime(Symbol(), Period(), 0);

   // … (rest of OnInit follows) …
   return(INIT_SUCCEEDED);
  }
Continuing inside OnInit(), the EA determines whether a built-in MA handle must be created. If the user selected any of the four standard MA types (SMA, EMA, LWMA, or RMA) and has either UseMAFilter or ShowMA enabled, the code calls iMA(Symbol(), Period(), MALength, 0, (ENUM_MA_METHOD)MAType, PRICE_CLOSE) to create an indicator handle. If that call fails, the EA prints a diagnostic error and aborts initialization. Assuming success, it then checks if(ShowMA == true) and, if so, calls ChartIndicatorAdd(0, 0, MAHandle) to plot the MA on the chart. At the end of initialization, a message- “Liquidity Sweep EA initialized successfully.”-confirms that all prerequisites (valid period, MA handle) are in place and the EA is ready to run.
// Create MA handle if using a built-in MA (SMA, EMA, LWMA, RMA)
if((MAType != VWMA && MAType != HMA) && (UseMAFilter || ShowMA))
  {
   ENUM_MA_METHOD method = (ENUM_MA_METHOD)MAType;
   MAHandle = iMA(Symbol(), Period(), MALength, 0, method, PRICE_CLOSE);
   if(MAHandle == INVALID_HANDLE)
     {
      Print("Failed to create MA handle (type=", EnumToString(MAType),
            ", length=", MALength, ")");
      return(INIT_FAILED);
     }
   if(ShowMA)
      ChartIndicatorAdd(0, 0, MAHandle);
  }
When the user removes the EA or closes MetaTrader, the OnDeinit() function executes. Its sole responsibility is housekeeping: if MAHandle was set (i.e., not INVALID_HANDLE), it calls IndicatorRelease(MAHandle) to free the memory and remove any lingering references. By doing so, the EA avoids resource leaks, an important best practice whenever indicator handles are created at runtime. Even though modern MetaTrader manages some of this automatically, explicitly releasing handles prevents chart bloat in long‐running sessions or when frequently reattaching the EA for parameter optimization.
void OnDeinit(const int reason)
  {
   if(MAHandle != INVALID_HANDLE)
      IndicatorRelease(MAHandle);
  }
The OnTick() function is the EA’s heartbeat, MetaTrader calls it on every incoming price tick. However, because we only want to check for liquidity sweeps once per completed candle, OnTick() first retrieves the latest bar’s time via iTime(Symbol(),Period(),0) and compares it to lastBarTime. If they match, it means the EA is still within the same bar, so nothing happens.
Only when a new candle appears (i.e., iTime(...) != lastBarTime) does the code invoke DetectLiquiditySweep(1), passing a shift of 1 to examine the just‐closed candle against its predecessor. Immediately afterward, lastBarTime is updated to the new value, ensuring the EA won’t detect again until the following bar closes. This disciplined approach guarantees one-and only one-signal per bar, eliminating noise and preventing multiple alerts on a single candle.
void OnTick()
  {
   // Retrieve the current bar’s start time
   datetime current = iTime(Symbol(), Period(), 0);

   // If the bar start time changed, call the detection routine once
   if(current != lastBarTime)
     {
      DetectLiquiditySweep(1);
      lastBarTime = current;
     }
  }
The workhorse routine, DetectLiquiditySweep(int shift), implements the logic that distinguishes this EA from simpler pattern markers. First, it ensures there is enough historical data to compute any custom moving averages. By calculating requiredBars = shift + MALength and verifying if(Bars(Symbol(),Period()) <= requiredBars) return; the code prevents out-of-range indexing. If there are, say, only 15 bars on the chart but the user set MALength=20, the EA will not attempt an MA calculation or pattern check, because it lacks sufficient history. This guard clause demonstrates careful error prevention, which is essential for robust EAs.
void DetectLiquiditySweep(int shift)
  {
   // Ensure there are at least (shift + MALength) bars of history
   int requiredBars = shift + MALength;
   if(Bars(Symbol(), Period()) <= requiredBars)
     {
      // Not enough bars to compute custom MA or compare prices
      return;
     }

   // … (next steps in the function) …
  }
Once the history check passes, DetectLiquiditySweep reads eight price values-open, high, low, and close for both the “current” completed bar (index = shift) and the “previous” bar (index = shift + 1). These values are stored in eight separate doubles: o, c, h, l for the current bar, and o1, c1, h1, l1 for the prior bar. With these in hand, the EA can assess whether a liquidity sweep has occurred.
Importantly, the code also computes two Boolean flags-bullCC (bullish color-change) and bearCC (bearish color-change)-by simply checking if the current bar’s close is above its open while the prior bar’s close was below its open, and vice versa. These flags come into play later if ColorChangeOnly is enabled, ensuring the EA only flags sweeps that coincide with a candle-color reversal.
//--- Bar data for the current completed candle (index = shift)
double o  = iOpen(Symbol(), Period(), shift);
double c  = iClose(Symbol(), Period(), shift);
double h  = iHigh(Symbol(), Period(), shift);
double l  = iLow(Symbol(), Period(), shift);

//--- Bar data for the prior candle (index = shift + 1)
double o1 = iOpen(Symbol(), Period(), shift + 1);
double c1 = iClose(Symbol(), Period(), shift + 1);
double h1 = iHigh(Symbol(), Period(), shift + 1);
double l1 = iLow(Symbol(), Period(), shift + 1);
The next section implements the “LessStrict” vs. “Strict” sweep definitions. If the user selected LessStrict, a bullish sweep is signaled when the current bar closes above its own open (c > o), its low dips below the prior bar’s low (l < l1), it closes above the prior bar’s open (c > o1), and the prior bar was not a doji (c1 != o1). A bearish sweep is symmetric: current close < current open, current high > prior high, current close < prior open, and prior bar not a doji.
If the user instead chose Strict, the EA tightens conditions by requiring the current close to break beyond the prior bar’s high (for bullish) or break below the prior bar’s low (for bearish). This Strict variant reduces “false” whistle‐blower signals at shallow retracements, forcing a more definitive violation of support or resistance. By exposing both modes, the EA teaches readers how small tweaks in logic can meaningfully alter signal frequency and quality.
// Compute color-change flags
bool bullCC = (c > o && c1 < o1);
bool bearCC = (c < o && c1 > o1);

// Liquidity sweep flags (LessStrict or Strict)
bool bullSweep, bearSweep;
if(SignalStrict == LessStrict)
  {
   bullSweep = (c > o && l < l1 && c > o1 && c1 != o1);
   bearSweep = (c < o && h > h1 && c < o1 && c1 != o1);
  }
else // Strict
  {
   bullSweep = (c > o && l < l1 && c > h1 && c1 != o1);
   bearSweep = (c < o && h > h1 && c < l1 && c1 != o1);
  }
Following the raw sweep checks, the EA optionally applies the color-change filter. If ColorChangeOnly is true, it does bullSweep &= bullCC; bearSweep &= bearCC;. In effect, any sweep that does not coincide with a candle-color flip is immediately discarded. Many traders regard a color change (e.g., a red candle following a green candle) as a confirmation of reversal momentum, so by gating sweeps behind that condition, the EA reduces the chance of marking a sweep that lacks visible rejection. This simple bitwise AND operation elegantly ties two complementary signals—price structure and candle psychology-into a single filter.
// If only color-change sweeps are desired, AND‐combine with the raw sweep flags
if(ColorChangeOnly)
  {
   bullSweep &= bullCC;    // must also be a bullish color reversal
   bearSweep &= bearCC;    // must also be a bearish color reversal
  }
With the raw sweep conditions and optional color filter in place, the EA then examines the Moving Average filter if UseMAFilter is true. It declares double maValue = 0.0; and proceeds to compute the MA in one of three ways. If the user selected “VWMA,” it calls the custom helper CalcVWMA(shift). If “HMA” was chosen, it calls CalcHMA(shift). Otherwise, it assumes a built-in MA type (SMA, EMA, LWMA, or RMA) and executes CopyBuffer(MAHandle, 0, shift, 1, buf) to retrieve one MA value. If CopyBuffer fails to return exactly one result, the EA simply returns and skips all further logic on that bar.
Once maValue is known, a boolean cond tests PriceAboveMA ? (c > maValue) : (c < maValue). In practice, if PriceAboveMA is true, the EA keeps only bullish sweeps that close above the MA (vetoing bearish ones by setting bearSweep = false), whereas if PriceAboveMA is false, only bearish sweeps that close below the MA survive. This filter ensures that liquidity sweeps are viewed in the context of trend: bullish sweeps only matter if price is above the MA, and bearish sweeps only if price is below.
if(UseMAFilter)
  {
   double maValue = 0.0;

   // Compute MA value at the same 'shift'
   if(MAType == VWMA)
      maValue = CalcVWMA(shift);
   else if(MAType == HMA)
      maValue = CalcHMA(shift);
   else
     {
      // Built‐in MA handle (SMA, EMA, LWMA, RMA)
      double buf[];
      if(CopyBuffer(MAHandle, 0, shift, 1, buf) != 1)
         return;  // no valid MA data available
      maValue = buf[0];
     }

   // Only allow bullish sweeps above MA or bearish sweeps below MA
   bool cond = PriceAboveMA ? (c > maValue) : (c < maValue);
   bullSweep &= cond;
   bearSweep &= !cond;
  }
At last, after all filters have been applied, DetectLiquiditySweep uses two if blocks to check if(bullSweep) and if(bearSweep). If bullSweep is true, it calls DrawSignal(shift, true) to place a bullish marker on the chart and writes a message to the Experts log like “Bullish sweep detected at [time], price=[close].” If bearSweep is true, it does the same with DrawSignal(shift, false) and a corresponding print.
In either case, as long as one of them fired, the code finally calls Alert("Liquidity Sweep detected on ", Symbol(), " ", EnumToString(Period())); which pops up an on-screen alert. This separation between “drawing on chart” and “sending an alert” allows each trader to decide whether they want only sonic/popup notifications or also a persistent visual reference on the chart itself.
// If a bullish sweep remains true after all filters, draw and log it
if(bullSweep)
  {
   DrawSignal(shift, true);
   PrintFormat("Bullish sweep detected at %s, price=%.5f",
               TimeToString(iTime(Symbol(),Period(),shift)), c);
  }

// If a bearish sweep remains true after all filters, draw and log it
if(bearSweep)
  {
   DrawSignal(shift, false);
   PrintFormat("Bearish sweep detected at %s, price=%.5f",
               TimeToString(iTime(Symbol(),Period(),shift)), c);
  }

// In either case, fire a pop‐up alert
if(bullSweep || bearSweep)
  {
   Alert("Liquidity Sweep detected on ", Symbol(), " ", EnumToString(Period()));
  }
The DrawSignal(int shift, bool bullish) function is solely responsible for placing chart objects. It first reads the bar’s timestamp t = iTime(Symbol(),Period(),shift) and computes a display price by taking either the low minus ArrowOffsetPoints * _Point (for a bullish arrow) or the high plus the same offset (for a bearish arrow). Choosing _Point ensures that the offset is measured in actual price increments regardless of whether the instrument is, say, EURUSD (0.0001 increments) or USDJPY (0.01 increments). Next, it composes a unique object name via StringFormat("LS_%I64u", (long)t). Because (long)t is a 64-bit integer reflecting the bar’s exact opening time, no two bars ever produce the same object name.
Before drawing anything, it calls ObjectFind(0, name) and deletes any preexisting object with that name—this prevents clutter if the EA is reattached or if a chart refresh repeats the same detection. Finally, if PlotArrow is true, ObjectCreate(...) draws a colored arrow (up for bullish or down for bearish) at the computed price. If PlotArrow is false but LblType is not None, the function instead draws a short or full text label (e.g., “BS” vs. “Bull Sweep”). By isolating all chart-object code in one routine, the EA keeps its detection logic separate from its visual annotations, which is a hallmark of clean, modular design.
void DrawSignal(int shift, bool bullish)
  {
   // Get the exact bar start time for this sweep
   datetime t = iTime(Symbol(), Period(), shift);

   // Determine the on‐chart Y‐coordinate: offset a few points above/below the candle
   double price = bullish
                  ? (iLow(Symbol(), Period(), shift)  - ArrowOffsetPoints * _Point)
                  : (iHigh(Symbol(), Period(), shift) + ArrowOffsetPoints * _Point);

   // Compose a unique name using the 64-bit timestamp
   string name = StringFormat("LS_%I64u", (long)t);

   // If an object with that name already exists, delete it first
   if(ObjectFind(0, name) >= 0)
      ObjectDelete(0, name);

   // (Next lines will choose arrow vs. text drawing)
}
Under the hood, two helper functions compute non‐standard moving averages. CalcVWMA(int shift) implements a typical volume-weighted moving average. It initializes two aggregate variables-numerator and denominator-to 0.0. Then, for each bar index from shift to shift + MALength – 1, it reads the close price price = iClose(...) and the tick volume vol = iVolume(...) (stored as a 64-bit long). By explicitly casting vol to double when computing numerator += price * (double)vol and denominator += (double)vol, the code avoids any warnings about inadvertent integer-to-double conversion.
Once the loop finishes, it returns numerator / denominator if denominator > 0.0; otherwise, it safely returns 0.0 to avoid division by zero. Thus, each VWMA point is precisely the sum of (price × volume) over the past MALength bars, divided by the sum of volume-exactly what traders expect from a volume-weighted average.
double CalcVWMA(int shift)
  {
   double numerator   = 0.0;
   double denominator = 0.0;

   // Loop over 'MALength' bars, starting at 'shift'
   for(int i = shift; i < shift + MALength; i++)
     {
      double price = iClose(Symbol(), Period(), i);
      long   vol   = iVolume(Symbol(), Period(), i);

      // Accumulate (price × volume) and sum of volume
      numerator   += price * (double)vol;
      denominator += (double)vol;
     }

   // Return VWMA = sum(price×volume) / sum(volume), or 0 if volume = 0
   return (denominator > 0.0) ? (numerator / denominator) : 0.0;
  }
Finally, CalcHMA(int shift) computes the Hull Moving Average, a two-step weighted average designed to reduce lag. First, it sets half = MALength / 2 and loops from i = shift to i < shift + half, assigning each bar a descending weight from half down to 1. It accumulates a weighted sum w1 and weight total sw1, ultimately dividing w1/sw1 to get a half-period weighted MA. Second, it loops from i = shift to i < shift + MALength, assigning weights from MALength down to 1, accumulating w2 and sw2, and computing w2/sw2 to get a full-period weighted MA.
The final HMA value is 2 * w1 – w2. In effect, doubling the half-period MA and subtracting the full-period MA sharpens the moving average’s responsiveness to recent price changes, which many traders find superior for dynamic markets. As with VWMA, the EA guards against insufficient history by never calling CalcHMA unless Bars(Symbol(),Period()) > shift + MALength.
//+------------------------------------------------------------------+
//| Compute Hull Moving Average (HMA)                                |
//+------------------------------------------------------------------+
double CalcHMA(int shift)
  {
   int half = MALength / 2;
   double w1   = 0.0, sw1 = 0.0;
   double w2   = 0.0, sw2 = 0.0;

   // 1) Weighted MA over half period
   for(int i = shift; i < shift + half; i++)
     {
      double p = iClose(Symbol(), Period(), i);
      int    weight = half - (i - shift);
      w1   += p * weight;
      sw1 += weight;
     }
   w1 = (sw1 > 0.0) ? (w1 / sw1) : 0.0;

   // 2) Weighted MA over full period
   for(int i = shift; i < shift + MALength; i++)
     {
      double p = iClose(Symbol(), Period(), i);
      int    weight = MALength - (i - shift);
      w2   += p * weight;
      sw2 += weight;
     }
   w2 = (sw2 > 0.0) ? (w2 / sw2) : 0.0;

   // 3) Final HMA value = 2 * (MA over half) – (MA over full)
   return 2.0 * w1 - w2;
  }
Testing and Results
To evaluate and understand the performance of our tool, we conducted comprehensive testing. This process involved running the tool on historical data through backtesting, as well as assessing its immediate performance in live market conditions. Below, we present an illustration of the results obtained from these tests.
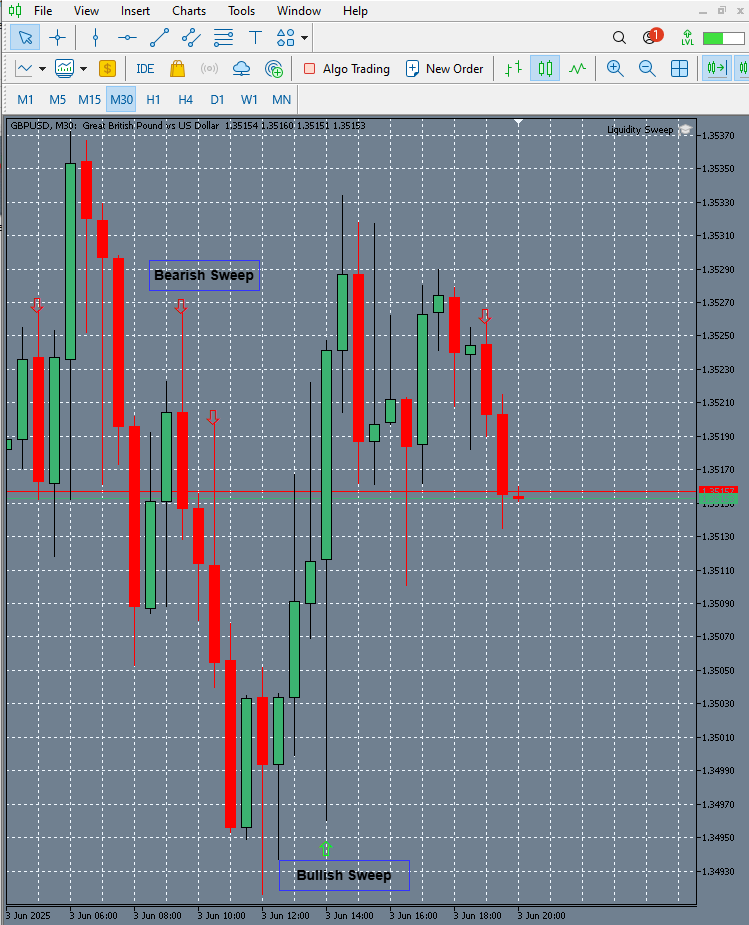
Fig. 3. Live Testing on GBPUSD
This chart effectively illustrates the tool's capability to identify liquidity sweeps, highlighting a clear bearish sweep followed by a bullish sweep, which indicates its potential to detect market reversals and institutional activity accurately. This chart effectively illustrates the tool's capability to identify liquidity sweeps, highlighting a clear bearish sweep followed by a bullish sweep, which indicates its potential to detect market reversals and institutional activity accurately.
Fig. 4. Live Testing Step Index
The above outcome demonstrates the tool's effectiveness in identifying liquidity sweeps, capturing key market reversals with clear visual markers, which can aid in strategic decision-making. This outcome demonstrates the tool's effectiveness in identifying liquidity sweeps, capturing key market reversals with clear visual markers, which can aid in strategic decision-making.
Fig. 5. Backtesting EURUSD
This backtest chart demonstrates the tool’s ability to accurately detect liquidity sweep patterns within historical market data. By analyzing past price movements, it highlights instances where price temporarily penetrated support or resistance levels before reversing, signaling potential institutional activity. These identified points can serve as valuable cues for anticipating future market reversals or trend continuations. The chart validates the effectiveness of the detection mechanism and provides confidence in its application for live trading scenarios.
Conclusion
This EA consistently identifies liquidity sweeps both in historical backtests and in live simulation, marking each valid sweep with an arrow precisely where price pierced, and then reclaimed, a prior swing low or high. Across multiple MA filter settings, the signals aligned well with subsequent trend continuation, showing strong reliability in real market conditions. Whether you review its past performance or observe it running live, the EA’s ability to catch institutional style “stop hunts” has been consistently validated. Use these insights to integrate sweep detection into your own strategy, knowing the code has proven its accuracy and responsiveness in both replayed and real-time environments.
Warning: All rights to these materials are reserved by MetaQuotes Ltd. Copying or reprinting of these materials in whole or in part is prohibited.
This article was written by a user of the site and reflects their personal views. MetaQuotes Ltd is not responsible for the accuracy of the information presented, nor for any consequences resulting from the use of the solutions, strategies or recommendations described.

- Free trading apps
- Over 8,000 signals for copying
- Economic news for exploring financial markets
You agree to website policy and terms of use