Русский 中文 Español Deutsch 日本語 Português
preview
Data label for time series  mining(Part 1):Make a dataset with trend markers through the EA operation chart

Data label for time series mining(Part 1):Make a dataset with trend markers through the EA operation chart

MetaTrader 5Expert Advisors | 4 September 2023, 12:36
5 300 0
Yuqiang Pan
Yuqiang Pan

Summary

When we design artificial intelligence models, we often need to prepare data first. Good data quality will allow us to get twice the result with half the effort in model training and validation. But our foreign exchange or stock data is special, which contains complex market information and time information, and data labeling is difficult, but we can easily analyze the trend in historical data on the chart.


This section introduces a method of making data sets with trend marks by EA operation charts, you can intuitively manipulate data according to your own ideas, of course you can also use the same method to expand and customize your own data sets!

Table of contents:

  1. Define the label data format
  2. Initialize charts and files
  3. Design and mark operation logic
  4. Organize data and write to file
  5. Attachment: complete EA code example


Define the label data format

When we get foreign exchange or stock data from the client (this article does not discuss external data read from files or downloaded from other websites), the general situation is this:

Time Open High Low Close Tick_volume
2021-12-10 01:15:00
1775.94
1775.96
1775.58
1775.58
173
2021-12-10 01:30:00
1775.58
1776.11
1775.48
1775.88
210
2021-12-10 01:45:00
1775.88
1776.22
1775.68
1776.22
212
2021-12-10 02:00:00
1776.22
1777.57
1775.98
1777.02
392
2021-12-10 02:15:00
1776.99
1777.72
1776.89
1777.72
264

Above is what the 5 time series data looks like. Their Close and Open are connected with each other from the beginning to the end, and the coherence is very strong. Suppose we think that the first two are an upward trend, and the others are a downward trend (the above 5 data are taken as an example). The general labeling method will divide the data into two parts:

Time

Open High   Low   Close Tick_volume
2021-12-10 01:15:00
1775.94
1775.96
1775.58
1775.58
173
2021-12-10 01:30:00
1775.58
1776.11
1775.48
1775.88
210

Time Open High   Low Close Tick_volume
2021-12-10 01:45:00
1775.88
1776.22
1775.68
1776.22
212
2021-12-10 02:00:00
1776.22
1777.57
1775.98
1777.02
392
2021-12-10 02:15:00
1776.99
1777.72
1776.89
1777.72
264

Then tell our model which part is an upward trend and which part is a downward trend, but that ignores their overall attributes and will destroy the integrity of the data, so how do we solve this problem?

A feasible method is to add trend grouping in our time series, as follows (take the above 5 pieces of data as an example, or follow the above assumptions):

Time Open High Low Close Tick_volume Trend_group
2021-12-10 01:15:00
1775.94
1775.96
1775.58
1775.58
173 0
2021-12-10 01:30:00
1775.58
1776.11
1775.48
1775.88
210 0
2021-12-10 01:45:00
1775.88
1776.22
1775.68
1776.22
212 1
2021-12-10 02:00:00
1776.22
1777.57
1775.98
1777.02
392 1
2021-12-10 02:15:00
1776.99
1777.72
1776.89
1777.72
264 1

But if we want to implement trend development analysis in the model, such as to what extent the current trend has developed (for example, the wave theory tells us that a general trend generally includes a trend stage and an adjustment stage, the trend stage has 5 wave stages, and the adjustment stage has 3 wave adjustment, etc.), we need to label the data further, and we can do this by adding another index column that represents the development of the trend in the data (assuming the first 2 of the following 10 data are upward trend and the last 5 are upward trend, the rest in the middle is a downward trend) ,like this:

Time Open High Low Close Tick_volume Trend_group Trend_index
2021-12-10 03:15:00 1776.38 1777.94 1775.47 1777.71 565 0 0
2021-12-10 03:30:00 1777.75 1778.93 1777.68 1778.61 406 0 1
2021-12-10 03:45:00 1778.58 1778.78 1777.65 1778.16 388 1 0
2021-12-10 04:00:00 1778.14 1779.42 1778.06 1779.14 393 1 1
2021-12-10 04:15:00 1779.16 1779.49 1778.42 1779.31 451 1 2
2021-12-10 04:30:00 1779.22 1779.42 1778.36 1778.37 306 0 0
2021-12-10 04:45:00 1778.42 1778.51 1777.60 1777.78 411 0 1
2021-12-10 05:00:00 1777.81 1778.68 1777.61 1778.57 372 0 2
2021-12-10 05:15:00 1778.54 1779.29 1778.42 1779.02 413 0 3
2021-12-10 05:30:00 1778.97 1779.49 1778.48 1778.50 278 0 4

Note:

1. The Trend_group defining the upward trend is 0

2. The Trend_group that defines the downward trend is 1

 Next we will start to manipulating the chart on the client side, labeling the data according to our desired pattern.


Initialize charts and files

    Chart initialization

          Because we need to look at the chart to mark the data, the chart cannot be scrolled casually, but must be scrolled according to our manual operation, so we need to disable CHART_AUTOSCROLL and CHART_SHIFT:

           ChartSetInteger (0, CHART_AUTOSCROLL, false);
          
            ChartSetInteger (0, CHART_SHIFT, true);
          
            ChartSetInteger (0, CHART_MOUSE_SCROLL ,1);
          Note: The green part of the code is designed to allow us to control the chart with the mouse wheel
            File initialization

                The initialization of the file should first check whether there is an existing label file, and if there is a historical file, save the file name to the variable "reName":

                 do
                     {
                       //---Find if there are files that match the chart
                       if (StringFind(name, Symbol())!=-1 && StringFind(name,".csv")!=-1)
                         reName=name;
                     }
                
                   while (FileFindNext(hd,name));
                Note: It should be noted here that we are using a "do - while" loop, which is different from a "while" loop in that it first executes the operator and then evaluates the expression But the initialization of name is a problem, we can do this
                int hd= FileFindFirst("*",name,0);


                  If there is an original marked file, open the file and get the last time marked by the function read_csv():

                    read_csv(file_handle,a);
                    Then scroll the chart to the last marked time:
                    shift = - iBarShift(Symbol(),PERIOD_CURRENT,(datetime)a[i-8]);
                    ChartNavigate(0, CHART_END ,shift);


                    Create a file if there is no history file:

                    file_handle = FileOpen(StringFormat("%s%d-%d.csv",Symbol(),Period(),start_t), FILE_WRITE | FILE_CSV | FILE_READ);
                    Then scroll the chart to the position specified by the global variable "start_t"
                     shift = -iBarShift(Symbol(),PERIOD_CURRENT,(datetime)start_t);
                      ChartNavigate(0,CHART_END,shift);
                    Add a vertical red line to mark the starting column:
                     ObjectCreate (0,"Start",OBJ_VLINE,0,(datetime)start_t,0)
                    The logic of this part is organized like this:
                     if (FileIsExist(reName))
                         {
                          file_handle = FileOpen(reName, FILE_WRITE | FILE_CSV | FILE_READ );
                           string a[];
                           int i= 0 ;
                          read_csv(file_handle,a);
                          i = ArraySize (a);
                          shift = -iBarShift(Symbol(), PERIOD_CURRENT,(datetime)a[i-8]);
                           ChartNavigate(0,CHART_END,shift);
                         }
                       else
                         {
                          file_handle = FileOpen (StringFormat ("%s%d-%d.csv", Symbol(), Period(),start_t), FILE_WRITE | FILE_CSV | FILE_READ );
                           Print ("There is no history file,create file:" , StringFormat ( "%s%d-%d",Symbol(), Period(),start_t));
                           shift = - iBarShift (Symbol(), PERIOD_CURRENT ,(datetime)start_t);
                           ChartNavigate (0, CHART_END ,shift);
                           ObjectCreate (0,"Start", OBJ_VLINE,0,(datetime)start_t,0);
                         }
                    Attention: Since we want to move the chart to the left, we must add "-" before the "iBarShift()" function
                    shift = -iBarShift(Symbol(), PERIOD_CURRENT ,(datetime)start_t);
                    Of course, it can also be implemented in the ChartNavigate() function such as:
                    ChartNavigate(0,CHART_END,-shift);
                    The code in this article is still implemented according to the first method.
                      These initialization actions will be implemented in our OnInit(), including defining the variables we need. The most important thing is to clarify where we want the chart to shift and start labeling. This is mainly controlled by the variables "shift" and "start_t". We Will be reflected in the final code:
                        int OnInit()
                          {
                        //---initial
                           string name;
                           string reName="1";
                           int hd=FileFindFirst("*",name,0);
                           int shift;
                        
                           ChartSetInteger(0,CHART_AUTOSCROLL,false);
                           ChartSetInteger(0,CHART_SHIFT,false);
                           ChartSetInteger(0,CHART_MOUSE_SCROLL,1);
                        
                        
                           do
                             {
                              //---check File
                              if(StringFind(name,Symbol())!=-1 && StringFind(name,".csv")!=-1)
                                 reName=name;
                             }
                           while(FileFindNext(hd,name));
                        
                           if(FileIsExist(reName))
                             {
                              file_handle = FileOpen(reName,FILE_WRITE|FILE_CSV|FILE_READ);
                              string a[];
                              int i=0;
                              read_csv(file_handle,a);
                              i = ArraySize(a);
                              shift = -iBarShift(Symbol(),PERIOD_CURRENT,(datetime)a[i-8]);
                              ChartNavigate(0,CHART_END,shift);
                             }
                           else
                             {
                              file_handle = FileOpen(StringFormat("%s%d-%d.csv",Symbol(),Period(),start_t),FILE_WRITE|FILE_CSV|FILE_READ);
                              Print(FileTell(file_handle));
                              Print("No history file,create file:",StringFormat("%s%d-%d",Symbol(),Period(),start_t));
                              shift = -iBarShift(Symbol(),PERIOD_CURRENT,(datetime)start_t);
                              ChartNavigate(0,CHART_END,shift);
                              ObjectCreate(0,"Start",OBJ_VLINE,0,(datetime)start_t,0);
                             }
                           return(INIT_SUCCEEDED);
                          }

                          Note:

                          1. start_t variable - specify the time frame to start;

                          2. shift variable - specify the number of columns to be shifted, and the code example shows the number of columns to be shifted by converting the specified time;

                          3. The read_csv () function will be defined later.

                            Definition of read_csv() function:
                               void read_csv(int hd,
                                             string &arry[])
                                {
                                 int i= 0;
                                 while(!FileIsEnding(hd))
                                   {
                                    ArrayResize(arry,i+1);
                                    arry[i]= FileReadString(hd);
                                    i++;
                                   }
                                }

                              Note: We use the "while" loop to find the end line of the historical annotation file, get the last line of data in the file, and find the end time of our last annotation. This annotation will scroll the chart to this column graph so that we can continue to annotate from here.


                              Design and mark operation logic

                                Manipulating Graphs: This section can be easily queried from the client's help topics.
                                  • Home — move to the last bar of the chart;
                                  • End — move to the first bar of the chart;
                                  • Page Up — move the chart backward by the distance of one window;
                                  • Page Down — move the chart forward by the distance of one window;
                                  • Ctrl+I — open a window with a list of indicators;
                                  • Ctrl+B — open a window with a list of objects;
                                  • Alt+1—the chart is displayed as a series of bars;
                                  • Alt+2 — the chart is displayed as a sequence of Japanese candlesticks;
                                  • Alt+3—the chart is displayed as a line connecting the closing prices;
                                  • Ctrl+G — show/hide the grid on the chart window;
                                  • "+"—enlarges the chart;
                                  • "-"—zoom out the chart;
                                  • F12 — scroll the chart step by step (bar by bar);
                                  • F8 — open the properties window;
                                  • Backspace — remove the last added object from the chart;
                                  • Delete — delete all selected objects;
                                  • Ctrl+Z — Undeletes the last object.
                                    Control logic:
                                      1. Press a key to tell EA what kind of trend the data marked next will be
                                        Define 'b' key, 's' key. Defined by virtual key code:
                                           #define KEY_B     66
                                           #define KEY_S     83
                                            Press 'b' and then 's' for an upward trend, press 's' and then 'b' for a downward trend, let's take the upward trend as an example:
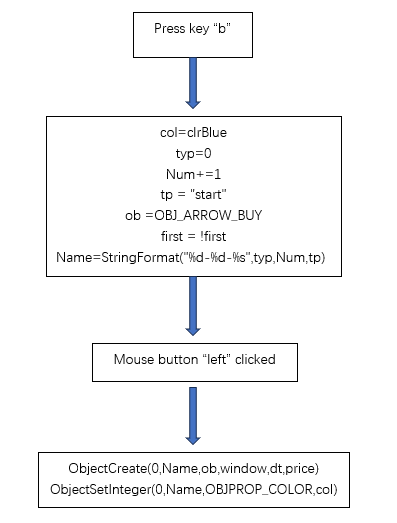
                                              1) Press 'b' at this time to represent an upward trend. We set the "typ" variable to 0, the "tp" variable to "start", the arrow color to "clrBlue", and the label count "Num" to increase by 1. It should be noted that we  only need to increment the variable at the beginning of the data segment, and specify that pressing the button again will execute the "end" part of the marked data segment by inverting first;
                                              b_press
                                              2) Press 's'  to mark the end of the upward trend, the "typ" variable is still 0, the "tp" variable is set to "end", the arrow color is still "clrBlue", and the label count "Num" remains unchanged. It should be noted that we only  needs to  increment the variable at the beginning of the data segment, and the inversion of first is used to specify that pressing the button again will execute the "start" part of the marked data segment. s_press
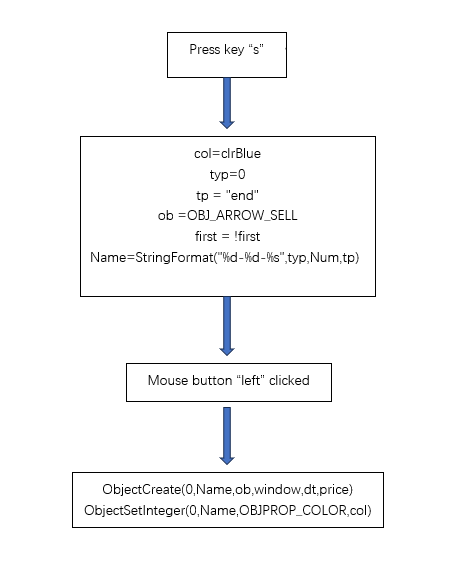
                                              3) After executing the switch statement, call the function ChartRedraw() to redraw the chart.
                                              if(id==CHARTEVENT_KEYDOWN)
                                                   {
                                                    switch(lparam)
                                                      {
                                                       case KEY_B:
                                                          if(first)
                                                            {
                                                             col=clrBlue ;
                                                             typ =0;
                                                             Num+=1;
                                                             tp = "start";
                                                            }
                                                          else
                                                            {
                                                             col=clrRed ;
                                                             typ = 1;
                                                             tp = "end";
                                                            }
                                                          ob =OBJ_ARROW_BUY;
                                                          first = !first;
                                                          Name = StringFormat("%d-%d-%s",typ,Num,tp);
                                                          break;
                                                       case KEY_S:
                                                          if(first)
                                                            {
                                                             col=clrRed ;
                                                             typ =1;
                                                             Num+=1;
                                                             tp = "start";
                                                            }
                                                          else
                                                            {
                                                             col=clrBlue ;
                                                             typ = 0;
                                                             tp = "end";
                                                            }
                                                          ob =OBJ_ARROW_SELL;
                                                          first = !first;
                                                          Name = StringFormat("%d-%d-%s",typ,Num,tp);
                                                          break;
                                              
                                                       default:
                                                          Print("You pressed:"+lparam+" key, do nothing!");
                                                      }
                                                    ChartRedraw(0);
                                                   }

                                              Note:

                                              1. "typ" variable - 0 means an upward trend, 1 means a downward trend;

                                              2. "Num" variable - mark count, will be intuitively displayed on the chart;

                                              3. "first" variable - controls that our labels are always in pairs, ensuring that each group is 'b' and 's' or 's' and 'b' without confusion;

                                              4. "tp"  variable - used to determine the beginning or end of the data segment.

                                              2. Click the left mouse button on the chart to determine the position of the mark

                                              if(id==CHARTEVENT_CLICK)
                                                   {
                                                    //--- definition
                                                    int x=(int)lparam;
                                                    int y=(int)dparam;
                                                    datetime dt    =0;
                                                    double   price =0;
                                                    int      window=0;
                                                    if(ChartXYToTimePrice(0,x,y,window,dt,price))
                                                      {
                                                       ObjectCreate(0,Name,ob,window,dt,price);
                                                       ObjectSetInteger(0,Name,OBJPROP_COLOR,col);
                                                       //Print("time:",dt,"shift:",iBarShift(Symbol(),PERIOD_CURRENT,dt));
                                                       if(tp=="start")
                                                          Start=dt;
                                                       else
                                                         {
                                                          if(file_handle)
                                                             file_write(Start,dt);
                                                         }
                                                       ChartRedraw(0);
                                                      }
                                                    else
                                                       Print("ChartXYToTimePrice return error code: ",GetLastError());
                                                   }
                                              //--- object delete
                                                 if(id==CHARTEVENT_OBJECT_DELETE)
                                                   {
                                                    Print("The object with name ",sparam," has been deleted");
                                                   }
                                              //--- object create
                                                 if(id==CHARTEVENT_OBJECT_CREATE)
                                                   {
                                                    Print("The object with name ",sparam," has been created!");
                                                   }

                                              Note:

                                              1. The ChartXYToTimePrice() function is mainly used to obtain the column chart properties of our mouse click position, including the current time and price. We use the global variable "dt" to receive the current time;

                                              2. When we click the mouse, we also need to judge whether the current action is the beginning or the end of the data segment. We use the global variable "tp" to judge. 

                                              3. Specific operation process


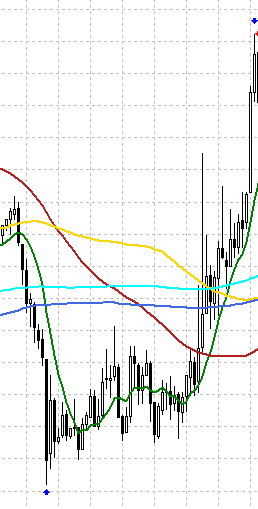
                                                If you want to mark an upward trend, first press the 'b' key, click the left mouse button on the column that starts to be marked on the chart, then press the 's' key, and then click the left mouse button on the end of the column on the icon to complete the labeling. Pairs of blue arrows appear on the chart, as shown in the image below:
                                                  up


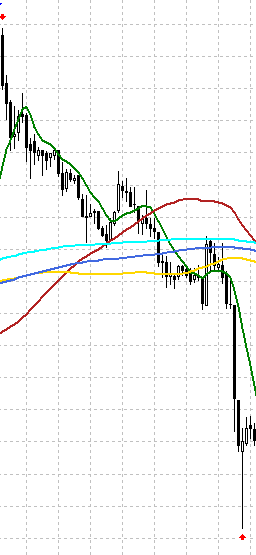
                                                      If you want to mark a downtrend, first press the 's' key, click the left mouse button on the  column  that starts to be marked on the chart, then press the 'b' key, and then click the left mouse button on the end of the column on the chart. After the marking is completed, it will Pairs of red arrows appear, as shown in the image below:
                                                        down


                                                          The labeling output column will display the labeling action at any time, which is very intuitive to monitor the labeling process, as shown in the figure:

                                                            outNote: This part can actually be better optimized, such as adding the function of undoing the last action, then you can adjust the position of the mark at any time, and you can also avoid wrong operations, but I'm a lazy guy, so...  (^o^)


                                                            Organize data and write to file

                                                              Define the variables "Start" and "MqlRates rates[]" to save the start time and data series of the trend:
                                                                datetime Start;
                                                                MqlRates rates[];
                                                                ArraySetAsSeries(rates, false);
                                                                  Note: 1. Here we don't need to define the end time, because the last time obtained from the chart is the end time;  2. The flag in the "ArraySetAsSeries(rates,false)" function is specified as "false" to ensure that the time periods are sequentially connected.
                                                                    When tp = "end" we write the data segment to the file(the green part of the code):
                                                                         if(id==CHARTEVENT_CLICK)
                                                                           {
                                                                            //--- definition
                                                                            int x=(int)lparam;
                                                                            int y=(int)dparam;
                                                                            datetime dt    =0;
                                                                            double   price =0;
                                                                            int      window=0;
                                                                            if(ChartXYToTimePrice(0,x,y,window,dt,price))
                                                                              {
                                                                               ObjectCreate(0,Name,ob,window,dt,price);
                                                                               ObjectSetInteger(0,Name,OBJPROP_COLOR,col);
                                                                               //Print("time:",dt,"shift:",iBarShift(Symbol(),PERIOD_CURRENT,dt));
                                                                               if(tp=="start")
                                                                                  Start=dt;
                                                                               else
                                                                                 {
                                                                                  if(file_handle)
                                                                                     file_write(Start,dt);
                                                                                 }
                                                                               ChartRedraw(0);
                                                                              }
                                                                            else
                                                                               Print("ChartXYToTimePrice return error code: ",GetLastError());
                                                                           }

                                                                        Obtain the segment data through the "CopyRates()" function, and add "trend_group" and "trend_index" columns by traversing each piece of data contained in "rates[]", we need to implement these functions in the "file_write()" function:
                                                                          void file_write(datetime start,
                                                                                          datetime end)
                                                                            {
                                                                             MqlRates rates[];
                                                                             ArraySetAsSeries(rates,false);
                                                                             int n_cp=CopyRates(Symbol(),PERIOD_CURRENT,start,end,rates);
                                                                             if(n_cp>0)
                                                                               {
                                                                                if(FileTell(file_handle)==2)
                                                                                  {
                                                                                   FileWrite(file_handle,"time","open","high","low","close","tick_volume","trend_group","trend_index");
                                                                                   for(int i=0; i<n_cp; i++)
                                                                                     {
                                                                                      FileWrite(file_handle,
                                                                                                rates[i].time,
                                                                                                rates[i].open,
                                                                                                rates[i].high,
                                                                                                rates[i].low,
                                                                                                rates[i].close,
                                                                                                rates[i].tick_volume,
                                                                                                typ,
                                                                                                i);
                                                                                     }
                                                                                  }
                                                                                else
                                                                                  {
                                                                                   for(int i=0; i<n_cp; i++)
                                                                                     {
                                                                                      FileWrite(file_handle,
                                                                                                rates[i].time,
                                                                                                rates[i].open,
                                                                                                rates[i].high,
                                                                                                rates[i].low,
                                                                                                rates[i].close,
                                                                                                rates[i].tick_volume,
                                                                                                typ,
                                                                                                i);
                                                                                     }
                                                                                  }
                                                                               }
                                                                             else
                                                                                Print("No data copied!");
                                                                             FileFlush(file_handle);
                                                                             typ=3;
                                                                            }


                                                                          Note:

                                                                          1. We need to write our index header when writing the file for the first time;

                                                                          2. Trend_group is actually the global variable "typ";

                                                                          3. We did not call the FileClose() function in this function, because our labeling has not been completed. We are going to call this function in the OnDeinit() function to write the final result to the file.

                                                                          4. Special attention should be paid to the yellow part of the code, which is used here

                                                                          if(FileTell(file_handle)==2)
                                                                          To determine whether there is data in the file (of course, other methods can also be used, such as adding a variable to assign a value to it during initialization), if there is no data in the file, you need to add a header like this:
                                                                          FileWrite(file_handle,"time","open","high","low","close","tick_volume","trend_group","trend_index");
                                                                          If there is data in the file, there is no need to add a header, otherwise the data will be cut off,that's very important!
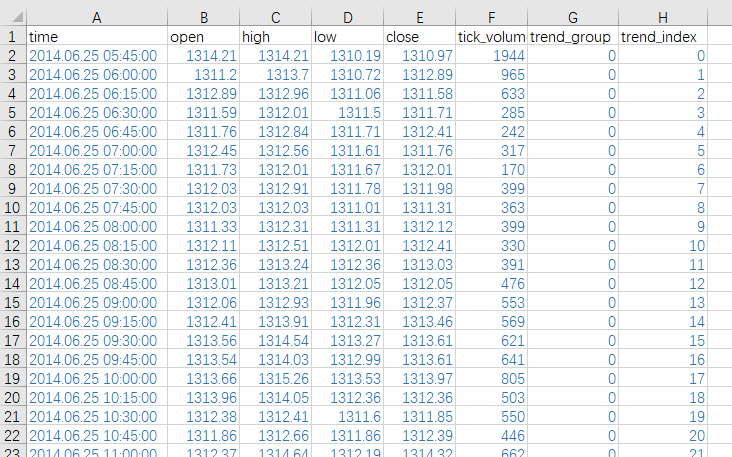
                                                                            Example of written file:
                                                                              data_0


                                                                                Let's check the coherence between different data segments and find that the data is perfect:
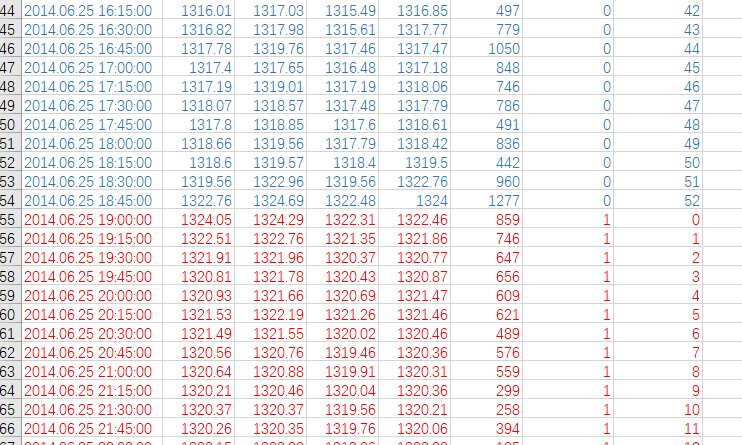
                                                                                  data_1


                                                                                  Attachment: complete EA code example

                                                                                  1. The definition of global variables and constants.  The parameter "start_t" can be defined by the data per second from 01.01.1970. Of course, it can also be defined by standard "datetime", or it can be defined by input variable  "input int start_t=1403037112;" so that it can be changed at any time when the EA is running later :
                                                                                  #define KEY_B     66
                                                                                  #define KEY_S     83
                                                                                  
                                                                                  
                                                                                  int Num= 0;
                                                                                  int typ= 3;
                                                                                  string Name;
                                                                                  string tp;
                                                                                  color col;
                                                                                  bool first= true;
                                                                                  ENUM_OBJECT ob;
                                                                                  int file_handle=0;
                                                                                  int start_t=1403037112;
                                                                                  datetime Start;

                                                                                  Note: Of course, you can also define the button as an input variable according to your personal preferences.

                                                                                  input int KEY_B=66;
                                                                                  input int KEY_S=83;

                                                                                  The advantage of this is that if you feel that the buttons are not easy to use, you can change the buttons at will every time you execute the EA until you are satisfied, and our code will not be changed temporarily.


                                                                                  2. OnInit() function, where we initialize our preparations:

                                                                                  int OnInit()
                                                                                    {
                                                                                  //---initial
                                                                                     string name;
                                                                                     string reName="1";
                                                                                     int hd=FileFindFirst("*",name,0);
                                                                                     int shift;
                                                                                  
                                                                                     ChartSetInteger(0,CHART_AUTOSCROLL,false);
                                                                                     ChartSetInteger(0,CHART_SHIFT,false);
                                                                                     ChartSetInteger(0,CHART_MOUSE_SCROLL,1);
                                                                                  
                                                                                  
                                                                                     do
                                                                                       {
                                                                                        //---check File
                                                                                        if(StringFind(name,Symbol())!=-1 && StringFind(name,".csv")!=-1)
                                                                                           reName=name;
                                                                                       }
                                                                                     while(FileFindNext(hd,name));
                                                                                  
                                                                                     if(FileIsExist(reName))
                                                                                       {
                                                                                        file_handle = FileOpen(reName,FILE_WRITE|FILE_CSV|FILE_READ);
                                                                                        string a[];
                                                                                        int i=0;
                                                                                        read_csv(file_handle,a);
                                                                                        i = ArraySize(a);
                                                                                        shift = -iBarShift(Symbol(),PERIOD_CURRENT,(datetime)a[i-8]);
                                                                                        ChartNavigate(0,CHART_END,shift);
                                                                                       }
                                                                                     else
                                                                                       {
                                                                                        file_handle = FileOpen(StringFormat("%s%d-%d.csv",Symbol(),Period(),start_t),FILE_WRITE|FILE_CSV|FILE_READ);
                                                                                        Print(FileTell(file_handle));
                                                                                        Print("No history file,create file:",StringFormat("%s%d-%d",Symbol(),Period(),start_t));
                                                                                        shift = -iBarShift(Symbol(),PERIOD_CURRENT,(datetime)start_t);
                                                                                        ChartNavigate(0,CHART_END,shift);
                                                                                        ObjectCreate(0,"Start",OBJ_VLINE,0,(datetime)start_t,0);
                                                                                       }
                                                                                  //---
                                                                                     Print("EA:",MQL5InfoString(MQL5_PROGRAM_NAME),"Working!");
                                                                                  //---
                                                                                     ChartSetInteger(ChartID(),CHART_EVENT_OBJECT_CREATE,true);
                                                                                  //---
                                                                                     ChartSetInteger(ChartID(),CHART_EVENT_OBJECT_DELETE,true);
                                                                                  //---
                                                                                     ChartRedraw(0);
                                                                                  //---
                                                                                     return(INIT_SUCCEEDED);
                                                                                    }


                                                                                  3. Because all our keyboard and mouse operations are finished on the chart, we put the main logic functions into the OnChartEvent() function to achieve:

                                                                                  void OnChartEvent(const int id,
                                                                                                    const long &lparam,
                                                                                                    const double &dparam,
                                                                                                    const string &sparam)
                                                                                    {
                                                                                  //Comment(__FUNCTION__,": id=",id," lparam=",lparam," dparam=",dparam," sparam=",sparam);
                                                                                     if(id==CHARTEVENT_KEYDOWN)
                                                                                       {
                                                                                        switch(lparam)
                                                                                          {
                                                                                           case KEY_B:
                                                                                              if(first)
                                                                                                {
                                                                                                 col=clrBlue ;
                                                                                                 typ =0;
                                                                                                 Num+=1;
                                                                                                 tp = "start";
                                                                                                }
                                                                                              else
                                                                                                {
                                                                                                 col=clrRed ;
                                                                                                 typ = 1;
                                                                                                 tp = "end";
                                                                                                }
                                                                                              ob =OBJ_ARROW_BUY;
                                                                                              first = !first;
                                                                                              Name = StringFormat("%d-%d-%s",typ,Num,tp);
                                                                                              break;
                                                                                           case KEY_S:
                                                                                              if(first)
                                                                                                {
                                                                                                 col=clrRed ;
                                                                                                 typ =1;
                                                                                                 Num+=1;
                                                                                                 tp = "start";
                                                                                                }
                                                                                              else
                                                                                                {
                                                                                                 col=clrBlue ;
                                                                                                 typ = 0;
                                                                                                 tp = "end";
                                                                                                }
                                                                                              ob =OBJ_ARROW_SELL;
                                                                                              first = !first;
                                                                                              Name = StringFormat("%d-%d-%s",typ,Num,tp);
                                                                                              break;
                                                                                  
                                                                                           default:
                                                                                              Print("You pressed:"+lparam+" key, do nothing!");
                                                                                          }
                                                                                        ChartRedraw(0);
                                                                                       }
                                                                                  //---
                                                                                     if(id==CHARTEVENT_CLICK&&(typ!=3))
                                                                                       {
                                                                                        //--- definition
                                                                                        int x=(int)lparam;
                                                                                        int y=(int)dparam;
                                                                                        datetime dt    =0;
                                                                                        double   price =0;
                                                                                        int      window=0;
                                                                                        if(ChartXYToTimePrice(0,x,y,window,dt,price))
                                                                                          {
                                                                                           ObjectCreate(0,Name,ob,window,dt,price);
                                                                                           ObjectSetInteger(0,Name,OBJPROP_COLOR,col);
                                                                                           //Print("time:",dt,"shift:",iBarShift(Symbol(),PERIOD_CURRENT,dt));
                                                                                           if(tp=="start")
                                                                                              Start=dt;
                                                                                           else
                                                                                             {
                                                                                              if(file_handle)
                                                                                                 file_write(Start,dt);
                                                                                             }
                                                                                           ChartRedraw(0);
                                                                                          }
                                                                                        else
                                                                                           Print("ChartXYToTimePrice return error code: ",GetLastError());
                                                                                       }
                                                                                  //--- object delete
                                                                                     if(id==CHARTEVENT_OBJECT_DELETE)
                                                                                       {
                                                                                        Print("The object with name ",sparam," has been deleted");
                                                                                       }
                                                                                  //--- object create
                                                                                     if(id==CHARTEVENT_OBJECT_CREATE)
                                                                                       {
                                                                                        Print("The object with name ",sparam," has been created!");
                                                                                       }
                                                                                  
                                                                                    }

                                                                                  Note: In the implementation of this function, we have changed the code above

                                                                                   if (id==CHARTEVENT_CLICK&&(typ!=3))

                                                                                  The reason we do this is very simple,  we avoid wrong operations caused by accidental mouse clicks, and use the "typ" variable to control whether the mouse action is valid. When we mark a trend, we will execute the file_write() function. We add this line at the end of this function

                                                                                  typ=3;

                                                                                  Then you can use the mouse to operate on the chart casually before starting the next paragraph of marking, without any action, until you find a suitable position and are ready to label the next trend.


                                                                                  4. Implementation of writing data function - file_write():

                                                                                  void file_write(datetime start,
                                                                                                  datetime end)
                                                                                    {
                                                                                     MqlRates rates[];
                                                                                     ArraySetAsSeries(rates,false);
                                                                                     int n_cp=CopyRates(Symbol(),PERIOD_CURRENT,start,end,rates);
                                                                                     if(n_cp>0)
                                                                                       {
                                                                                        if(FileTell(file_handle)==2)
                                                                                          {
                                                                                           FileWrite(file_handle,"time","open","high","low","close","tick_volume","trend_group","trend_index");
                                                                                           for(int i=0; i<n_cp; i++)
                                                                                             {
                                                                                              FileWrite(file_handle,
                                                                                                        rates[i].time,
                                                                                                        rates[i].open,
                                                                                                        rates[i].high,
                                                                                                        rates[i].low,
                                                                                                        rates[i].close,
                                                                                                        rates[i].tick_volume,
                                                                                                        typ,
                                                                                                        i);
                                                                                             }
                                                                                          }
                                                                                        else
                                                                                          {
                                                                                           for(int i=0; i<n_cp; i++)
                                                                                             {
                                                                                              FileWrite(file_handle,
                                                                                                        rates[i].time,
                                                                                                        rates[i].open,
                                                                                                        rates[i].high,
                                                                                                        rates[i].low,
                                                                                                        rates[i].close,
                                                                                                        rates[i].tick_volume,
                                                                                                        typ,
                                                                                                        i);
                                                                                             }
                                                                                          }
                                                                                       }
                                                                                     else
                                                                                        Print("No data copied!");
                                                                                     FileFlush(file_handle);
                                                                                     typ=3;
                                                                                    }

                                                                                  5. Implementation of the read file function- read_csv():
                                                                                  void read_csv(int hd,
                                                                                                string &arry[])
                                                                                    {
                                                                                     int i=0;
                                                                                     while(!FileIsEnding(hd))
                                                                                       {
                                                                                        ArrayResize(arry,i+1);
                                                                                        arry[i]=FileReadString(hd);
                                                                                        i++;
                                                                                       }
                                                                                    }

                                                                                  6. There is still an important problem that has not been dealt with here,  the file handle "file_handle" opened when the EA is initialized is not released. We release the handle in the final OnDeinit() function. When calling the function "FileClose(file_handle)", all data will be actually written to the csv file, so it is especially important not to try to open the csv file while the EA is still running:
                                                                                  void OnDeinit(const int reason)
                                                                                    {
                                                                                     FileClose(file_handle);
                                                                                     Print("Write data!");
                                                                                    }


                                                                                  Note: The code shown in this article is only for demonstration. If you want to use it in practice, it is recommended that you further improve the code. At the end of the article, the CSV file and the final MQL5 file involved in the demonstration will be provided . The next article in this series  will introduce how to annotate data through the client combined with python.

                                                                                  Thank you for your patience in reading, I hope you gain something and wish you a happy life, and see you in the next chapter!

                                                                                  Category Theory in MQL5 (Part 19): Naturality Square Induction Category Theory in MQL5 (Part 19): Naturality Square Induction
                                                                                  We continue our look at natural transformations by considering naturality square induction. Slight restraints on multicurrency implementation for experts assembled with the MQL5 wizard mean we are showcasing our data classification abilities with a script. Principle applications considered are price change classification and thus its forecasting.
                                                                                  How to create a simple Multi-Currency Expert Advisor using MQL5 (Part 1): Indicator Signals based on ADX in combination with Parabolic SAR How to create a simple Multi-Currency Expert Advisor using MQL5 (Part 1): Indicator Signals based on ADX in combination with Parabolic SAR
                                                                                  The Multi-Currency Expert Advisor in this article is Expert Advisor or trading robot that can trade (open orders, close orders and manage orders an more) for more than 1 symbol pair only from one symbol chart.
                                                                                  Understanding order placement in MQL5 Understanding order placement in MQL5
                                                                                  When creating any trading system, there is a task we need to deal with effectively. This task is order placement or to let the created trading system deal with orders automatically because it is crucial in any trading system. So, you will find in this article most of the topics that you need to understand about this task to create your trading system in terms of order placement effectively.
                                                                                  DoEasy. Controls (Part 32): Horizontal ScrollBar, mouse wheel scrolling DoEasy. Controls (Part 32): Horizontal ScrollBar, mouse wheel scrolling
                                                                                  In the article, we will complete the development of the horizontal scrollbar object functionality. We will also make it possible to scroll the contents of the container by moving the scrollbar slider and rotating the mouse wheel, as well as make additions to the library, taking into account the new order execution policy and new runtime error codes in MQL5.