Articles on data analysis and statistics in MQL5
Articles on mathematical models and laws of probability are interesting for many traders. Mathematics is the basis of technical indicators, and statistics is required to analyze trading results and develop strategies.
Read about the fuzzy logic, digital filters, market profile, Kohonen maps, neural gas and many other tools that can be used for trading.
Add a new article

You are missing trading opportunities:
- Free trading apps
- Over 8,000 signals for copying
- Economic news for exploring financial markets
Registration
Log in
You agree to website policy and terms of use
If you do not have an account, please register

Analyzing Overbought and Oversold Trends Via Chaos Theory Approaches
We determine the overbought and oversold condition of the market according to chaos theory: integrating the principles of chaos theory, fractal geometry and neural networks to forecast financial markets. The study demonstrates the use of the Lyapunov exponent as a measure of market randomness and the dynamic adaptation of trading signals. The methodology includes an algorithm for generating fractal noise, hyperbolic tangent activation, and moment optimization.

Developing a Replay System (Part 70): Getting the Time Right (III)
In this article, we will look at how to use the CustomBookAdd function correctly and effectively. Despite its apparent simplicity, it has many nuances. For example, it allows you to tell the mouse indicator whether a custom symbol is on auction, being traded, or the market is closed. The content presented here is intended solely for educational purposes. Under no circumstances should the application be viewed for any purpose other than to learn and master the concepts presented.

From Novice to Expert: Animated News Headline Using MQL5 (IV) — Locally hosted AI model market insights
In today's discussion, we explore how to self-host open-source AI models and use them to generate market insights. This forms part of our ongoing effort to expand the News Headline EA, introducing an AI Insights Lane that transforms it into a multi-integration assistive tool. The upgraded EA aims to keep traders informed through calendar events, financial breaking news, technical indicators, and now AI-generated market perspectives—offering timely, diverse, and intelligent support to trading decisions. Join the conversation as we explore practical integration strategies and how MQL5 can collaborate with external resources to build a powerful and intelligent trading work terminal.

CFTC Data Mining in Python and Building an AI Model
Let's try mining CFTC data, downloading COT and TFF reports via Python, connecting all this with MetaTrader 5 quotes and an AI model, and get forecasts. What are COT reports in the Forex market? How to use COT and TFF reports for forecasting?

MQL5 Trading Tools (Part 12): Enhancing the Correlation Matrix Dashboard with Interactivity
In this article, we enhance the correlation matrix dashboard in MQL5 with interactive features like panel dragging, minimizing/maximizing, hover effects on buttons and timeframes, and mouse event handling for improved user experience. We add sorting of symbols by average correlation strength in ascending/descending modes, toggle between correlation and p-value views, and incorporate light/dark theme switching with dynamic color updates.

Population optimization algorithms: Mind Evolutionary Computation (MEC) algorithm
The article considers the algorithm of the MEC family called the simple mind evolutionary computation algorithm (Simple MEC, SMEC). The algorithm is distinguished by the beauty of its idea and ease of implementation.

Developing a Replay System — Market simulation (Part 23): FOREX (IV)
Now the creation occurs at the same point where we converted ticks into bars. This way, if something goes wrong during the conversion process, we will immediately notice the error. This is because the same code that places 1-minute bars on the chart during fast forwarding is also used for the positioning system to place bars during normal performance. In other words, the code that is responsible for this task is not duplicated anywhere else. This way we get a much better system for both maintenance and improvement.

Market Simulation (Part 01): Cross Orders (I)
Today we will begin the second stage, where we will look at the market replay/simulation system. First, we will show a possible solution for cross orders. I will show you the solution, but it is not final yet. It will be a possible solution to a problem that we will need to solve in the near future.

Neural networks made easy (Part 40): Using Go-Explore on large amounts of data
This article discusses the use of the Go-Explore algorithm over a long training period, since the random action selection strategy may not lead to a profitable pass as training time increases.

Python-MetaTrader 5 Strategy Tester (Part 05): Multi-Symbols and Timeframes Strategy Tester
This article presents a MetaTrader 5–compatible backtesting workflow that scales across symbols and timeframes. We use HistoryManager to parallelize data collection, synchronize bars and ticks from all timeframes, and run symbol‑isolated OnTick handlers in threads. You will learn how modelling modes affect speed/accuracy, when to rely on terminal data, how to reduce I/O with event‑driven updates, and how to assemble a complete multicurrency trading robot.

Data Science and ML (Part 47): Forecasting the Market Using the DeepAR model in Python
In this article, we will attempt to predict the market with a decent model for time series forecasting named DeepAR. A model that is a combination of deep neural networks and autoregressive properties found in models like ARIMA and Vector Autoregressive (VAR).

Recurrence Quantification Analysis (RQA) in MQL5: Building a Complete Analysis Library
This article builds a complete Recurrence Quantification Analysis (RQA) toolkit for MetaTrader 5 in pure MQL5. We cover phase-space reconstruction, time-delay embedding, distance and recurrence matrix construction, RQA metric extraction, automatic epsilon selection, and rolling-window computation through a modular library design. The article concludes by applying the library in a practical indicator that plots RR, DET, LAM, ENTR, and TREND directly on the chart, providing a solid foundation for nonlinear time-series analysis in MQL5.

Developing a Replay System — Market simulation (Part 22): FOREX (III)
Although this is the third article on this topic, I must explain for those who have not yet understood the difference between the stock market and the foreign exchange market: the big difference is that in the Forex there is no, or rather, we are not given information about some points that actually occurred during the course of trading.

MQL5 Wizard Techniques you should know (Part 21): Testing with Economic Calendar Data
Economic Calendar Data is not available for testing with Expert Advisors within Strategy Tester, by default. We look at how Databases could help in providing a work around this limitation. So, for this article we explore how SQLite databases can be used to archive Economic Calendar news such that wizard assembled Expert Advisors can use this to generate trade signals.

Python-MetaTrader 5 Strategy Tester (Part 02): Dealing with Bars, Ticks, and Overloading Built-in Functions in a Simulator
In this article, we introduce functions similar to those provided by the Python-MetaTrader 5 module, providing a simulator with a familiar interface and a custom way of handling bars and ticks internally.

CAPM Model Indicator for the Forex Market
Adaptation of the classical CAPM model for the Forex currency market in MQL5. The indicator calculates expected return and risk premium based on historical volatility. The indicators rise at peaks and bottoms, reflecting the fundamental principles of pricing. Practical application for counter-trend and trend-following strategies, taking into account the dynamics of the risk-reward ratio in real time. The article includes mathematical apparatus and technical implementation.

Developing a Replay System (Part 37): Paving the Path (I)
In this article, we will finally begin to do what we wanted to do much earlier. However, due to the lack of "solid ground", I did not feel confident to present this part publicly. Now I have the basis to do this. I suggest that you focus as much as possible on understanding the content of this article. I mean not simply reading it. I want to emphasize that if you do not understand this article, you can completely give up hope of understanding the content of the following ones.

Developing a Replay System (Part 75): New Chart Trade (II)
In this article, we will talk about the C_ChartFloatingRAD class. This is what makes Chart Trade work. However, the explanation does not end there. We will complete it in the next article, as the content of this article is quite extensive and requires deep understanding. The content presented here is intended solely for educational purposes. Under no circumstances should the application be viewed for any purpose other than to learn and master the concepts presented.

Price Action Analysis Toolkit Development (Part 9): External Flow
This article explores a new dimension of analysis using external libraries specifically designed for advanced analytics. These libraries, like pandas, provide powerful tools for processing and interpreting complex data, enabling traders to gain more profound insights into market dynamics. By integrating such technologies, we can bridge the gap between raw data and actionable strategies. Join us as we lay the foundation for this innovative approach and unlock the potential of combining technology with trading expertise.

Developing a Replay System (Part 51): Things Get Complicated (III)
In this article, we will look into one of the most difficult issues in the field of MQL5 programming: how to correctly obtain a chart ID, and why objects are sometimes not plotted on the chart. The materials presented here are for didactic purposes only. Under no circumstances should the application be viewed for any purpose other than to learn and master the concepts presented.

Blood inheritance optimization (BIO)
I present to you my new population optimization algorithm - Blood Inheritance Optimization (BIO), inspired by the human blood group inheritance system. In this algorithm, each solution has its own "blood type" that determines the way it evolves. Just as in nature where a child's blood type is inherited according to specific rules, in BIO new solutions acquire their characteristics through a system of inheritance and mutations.

Neural networks made easy (Part 41): Hierarchical models
The article describes hierarchical training models that offer an effective approach to solving complex machine learning problems. Hierarchical models consist of several levels, each of which is responsible for different aspects of the task.

Data Science and ML (Part 35): NumPy in MQL5 – The Art of Making Complex Algorithms with Less Code
NumPy library is powering almost all the machine learning algorithms to the core in Python programming language, In this article we are going to implement a similar module which has a collection of all the complex code to aid us in building sophisticated models and algorithms of any kind.

Developing a Replay System (Part 54): The Birth of the First Module
In this article, we will look at how to put together the first of a number of truly functional modules for use in the replay/simulator system that will also be of general purpose to serve other purposes. We are talking about the mouse module.

Low-Frequency Quantitative Strategies in MetaTrader 5 (Part 4): A Volatility-Adjusted Momentum-Based Intraday System
We present a timer-based MQL5 EA for Opening Range Breakout aligned to NYSE hours. It screens “Stocks in Play” via opening-range relative volume, enforces price/volume/ATR minimums, sizes positions by risk, and exits at 16:00 ET. A Sharpe-ranked optimization across 30 liquid Nasdaq stocks and a single-symbol test are provided, together with backtest settings and an Excel report for verification.

Developing a Replay System — Market simulation (Part 19): Necessary adjustments
Here we will prepare the ground so that if we need to add new functions to the code, this will happen smoothly and easily. The current code cannot yet cover or handle some of the things that will be necessary to make meaningful progress. We need everything to be structured in order to enable the implementation of certain things with the minimal effort. If we do everything correctly, we can get a truly universal system that can very easily adapt to any situation that needs to be handled.

Low-Frequency Quantitative Strategies in Metatrader 5: (Part 1) Setting Up An OLAP-Friendly Data Store
The article outlines a practical data pipeline for quantitative analysis based on Parquet storage, Hive-style partitions, and DuckDB. It details migrating selected SQLite tables to Parquet, structuring market data by source, symbol, timeframe, and date, and querying it with SQL window functions. A Golden Cross example illustrates cross‑symbol evaluation of forward returns. Accompanying Python scripts handle data download, conversion, and execution.

Creating a Trading Administrator Panel in MQL5 (Part IX): Code Organization (I)
This discussion delves into the challenges encountered when working with large codebases. We will explore the best practices for code organization in MQL5 and implement a practical approach to enhance the readability and scalability of our Trading Administrator Panel source code. Additionally, we aim to develop reusable code components that can potentially benefit other developers in their algorithm development. Read on and join the conversation.

MQL5 Trading Tools (Part 20): Canvas Graphing with Statistical Correlation and Regression Analysis
In this article, we create a canvas-based graphing tool in MQL5 for statistical correlation and linear regression analysis between two symbols, with draggable and resizable features. We incorporate ALGLIB for regression calculations, dynamic tick labels, data points, and a stats panel displaying slope, intercept, correlation, and R-squared. This interactive visualization aids in pair trading insights, supporting customizable themes, borders, and real-time updates on new bars

Category Theory in MQL5 (Part 23): A different look at the Double Exponential Moving Average
In this article we continue with our theme in the last of tackling everyday trading indicators viewed in a ‘new’ light. We are handling horizontal composition of natural transformations for this piece and the best indicator for this, that expands on what we just covered, is the double exponential moving average (DEMA).

Population optimization algorithms: Simulated Annealing (SA) algorithm. Part I
The Simulated Annealing algorithm is a metaheuristic inspired by the metal annealing process. In the article, we will conduct a thorough analysis of the algorithm and debunk a number of common beliefs and myths surrounding this widely known optimization method. The second part of the article will consider the custom Simulated Isotropic Annealing (SIA) algorithm.

Hidden Markov Models in Machine Learning-Based Trading Systems
Hidden Markov Models (HMMs) are a powerful class of probabilistic models designed to analyze sequential data, where observed events depend on some sequence of unobserved (hidden) states that form a Markov process. The main assumptions of HMM include the Markov property for hidden states, meaning that the probability of transition to the next state depends only on the current state, and the independence of observations given knowledge of the current hidden state.

Chaos Game Optimization (CGO)
The article presents a new metaheuristic algorithm, Chaos Game Optimization (CGO), which demonstrates a unique ability to maintain high efficiency when dealing with high-dimensional problems. Unlike most optimization algorithms, CGO not only does not lose, but sometimes even increases performance when scaling a problem, which is its key feature.

Swap Arbitrage in Forex: Building a Synthetic Portfolio and Generating a Consistent Swap Flow
Do you want to know how to benefit from the difference in interest rates? This article considers how to use swap arbitrage in Forex to earn stable profit every night, creating a portfolio that is resistant to market fluctuations.

Artificial Bee Hive Algorithm (ABHA): Tests and results
In this article, we will continue exploring the Artificial Bee Hive Algorithm (ABHA) by diving into the code and considering the remaining methods. As you might remember, each bee in the model is represented as an individual agent whose behavior depends on internal and external information, as well as motivational state. We will test the algorithm on various functions and summarize the results by presenting them in the rating table.

Redefining MQL5 and MetaTrader 5 Indicators
An innovative approach to collecting indicator information in MQL5 enables more flexible and streamlined data analysis by allowing developers to pass custom inputs to indicators for immediate calculations. This approach is particularly useful for algorithmic trading, as it provides enhanced control over the information processed by indicators, moving beyond traditional constraints.
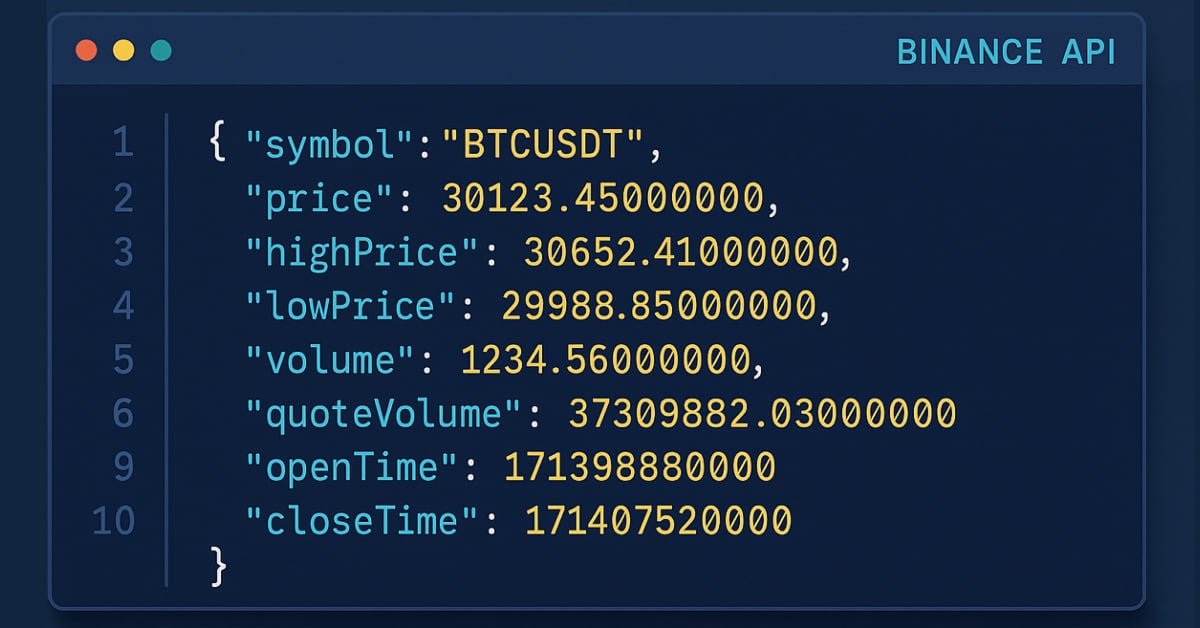
Introduction to MQL5 (Part 31): Mastering API and WebRequest Function in MQL5 (V)
Learn how to use WebRequest and external API calls to retrieve recent candle data, convert each value into a usable type, and save the information neatly in a table format. This step lays the groundwork for building an indicator that visualizes the data in candle format.

How to implement AutoARIMA forecasting in MQL5
This article presents an MQL5 implementation of AutoARIMA that builds ARIMA models without manual tuning. It estimates d via a variance-based heuristic, fits ARMA(p,q) by gradient optimization with Adam, and selects p and q using AICc. The code returns a one-step-ahead price forecast by differencing, model estimation, and integration back to price level, ready to call on a Close series.

Comet Tail Algorithm (CTA)
In this article, we will look at the Comet Tail Optimization Algorithm (CTA), which draws inspiration from unique space objects - comets and their impressive tails that form when approaching the Sun. The algorithm is based on the concept of the motion of comets and their tails, and is designed to find optimal solutions in optimization problems.

Creating a Trading Administrator Panel in MQL5 (Part IX): Code Organization (II): Modularization
In this discussion, we take a step further in breaking down our MQL5 program into smaller, more manageable modules. These modular components will then be integrated into the main program, enhancing its organization and maintainability. This approach simplifies the structure of our main program and makes the individual components reusable in other Expert Advisors (EAs) and indicator developments. By adopting this modular design, we create a solid foundation for future enhancements, benefiting both our project and the broader developer community.