Articles on data analysis and statistics in MQL5
Articles on mathematical models and laws of probability are interesting for many traders. Mathematics is the basis of technical indicators, and statistics is required to analyze trading results and develop strategies.
Read about the fuzzy logic, digital filters, market profile, Kohonen maps, neural gas and many other tools that can be used for trading.
Add a new article

You are missing trading opportunities:
- Free trading apps
- Over 8,000 signals for copying
- Economic news for exploring financial markets
Registration
Log in
You agree to website policy and terms of use
If you do not have an account, please register

Developing a Replay System (Part 71): Getting the Time Right (IV)
In this article, we will look at how to implement what was shown in the previous article related to our replay/simulation service. As in many other things in life, problems are bound to arise. And this case was no exception. In this article, we continue to improve things. The content presented here is intended solely for educational purposes. Under no circumstances should the application be viewed for any purpose other than to learn and master the concepts presented.

Feature Engineering With Python And MQL5 (Part II): Angle Of Price
There are many posts in the MQL5 Forum asking for help calculating the slope of price changes. This article will demonstrate one possible way of calculating the angle formed by the changes in price in any market you wish to trade. Additionally, we will answer if engineering this new feature is worth the extra effort and time invested. We will explore if the slope of the price can improve any of our AI model's accuracy when forecasting the USDZAR pair on the M1.

Developing a Replay System — Market simulation (Part 12): Birth of the SIMULATOR (II)
Developing a simulator can be much more interesting than it seems. Today we'll take a few more steps in this direction because things are getting more interesting.

Population optimization algorithms: Evolution Strategies, (μ,λ)-ES and (μ+λ)-ES
The article considers a group of optimization algorithms known as Evolution Strategies (ES). They are among the very first population algorithms to use evolutionary principles for finding optimal solutions. We will implement changes to the conventional ES variants and revise the test function and test stand methodology for the algorithms.

Low-Frequency Quantitative Strategies in MetaTrader 5 (Part 4): A Volatility-Adjusted Momentum-Based Intraday System
We present a timer-based MQL5 EA for Opening Range Breakout aligned to NYSE hours. It screens “Stocks in Play” via opening-range relative volume, enforces price/volume/ATR minimums, sizes positions by risk, and exits at 16:00 ET. A Sharpe-ranked optimization across 30 liquid Nasdaq stocks and a single-symbol test are provided, together with backtest settings and an Excel report for verification.

Creating a Trading Administrator Panel in MQL5 (Part IX): Code Organization (III): Communication Module
Join us for an in-depth discussion on the latest advancements in MQL5 interface design as we unveil the redesigned Communications Panel and continue our series on building the New Admin Panel using modularization principles. We'll develop the CommunicationsDialog class step by step, thoroughly explaining how to inherit it from the Dialog class. Additionally, we'll leverage arrays and ListView class in our development. Gain actionable insights to elevate your MQL5 development skills—read through the article and join the discussion in the comments section!

Royal Flush Optimization (RFO)
The original Royal Flush Optimization algorithm offers a new approach to solving optimization problems, replacing the classic binary coding of genetic algorithms with a sector-based approach inspired by poker principles. RFO demonstrates how simplifying basic principles can lead to an efficient and practical optimization method. The article presents a detailed analysis of the algorithm and test results.

Creating Custom Indicators in MQL5 (Part 10): Enhancing the Footprint Chart with Per-Bar Volume Sentiment Information Box
The article enhances an MQL5 footprint indicator with a compact box above each candle that summarizes net delta, total volume, and buy/sell percentages. We implement supersampled anti‑aliased rendering, rounded corners via arc and quadrilateral rasterization, and per‑pixel alpha compositing. Supporting utilities include ARGB conversion, scanline fills, and box‑filter downsampling. The box delivers fast sentiment reads that stay legible across zoom levels.

Statistical Arbitrage Through Cointegrated Stocks (Part 7): Scoring System 2
This article describes two additional scoring criteria used for selection of baskets of stocks to be traded in mean-reversion strategies, more specifically, in cointegration based statistical arbitrage. It complements a previous article where liquidity and strength of the cointegration vectors were presented, along with the strategic criteria of timeframe and lookback period, by including the stability of the cointegration vectors and the time to mean reversion (half-time). The article includes the commented results of a backtest with the new filters applied and the files required for its reproduction are also provided.

Data Science and ML (Part 39): News + Artificial Intelligence, Would You Bet on it?
News drives the financial markets, especially major releases like Non-Farm Payrolls (NFPs). We've all witnessed how a single headline can trigger sharp price movements. In this article, we dive into the powerful intersection of news data and Artificial Intelligence.

Population optimization algorithms: Changing shape, shifting probability distributions and testing on Smart Cephalopod (SC)
The article examines the impact of changing the shape of probability distributions on the performance of optimization algorithms. We will conduct experiments using the Smart Cephalopod (SC) test algorithm to evaluate the efficiency of various probability distributions in the context of optimization problems.

Population optimization algorithms: Intelligent Water Drops (IWD) algorithm
The article considers an interesting algorithm derived from inanimate nature - intelligent water drops (IWD) simulating the process of river bed formation. The ideas of this algorithm made it possible to significantly improve the previous leader of the rating - SDS. As usual, the new leader (modified SDSm) can be found in the attachment.

Big Bang - Big Crunch (BBBC) algorithm
The article presents the Big Bang - Big Crunch method, which has two key phases: cyclic generation of random points and their compression to the optimal solution. This approach combines exploration and refinement, allowing us to gradually find better solutions and open up new optimization opportunities.

Price Driven CGI Model: Theoretical Foundation
Let's discuss the data manipulation algorithm, as we dive deeper into conceptualizing the idea of using price data to drive CGI objects. Think about transferring the effects of events, human emotions and actions on financial asset prices to a real-life model. This study delves into leveraging price data to influence the scale of a CGI object, controlling growth and emotions. These visible effects can establish a fresh analytical foundation for traders. Further insights are shared in the article.

Data Science and ML (Part 34): Time series decomposition, Breaking the stock market down to the core
In a world overflowing with noisy and unpredictable data, identifying meaningful patterns can be challenging. In this article, we'll explore seasonal decomposition, a powerful analytical technique that helps separate data into its key components: trend, seasonal patterns, and noise. By breaking data down this way, we can uncover hidden insights and work with cleaner, more interpretable information.

MQL5 Wizard Techniques you should know (Part 31): Selecting the Loss Function
Loss Function is the key metric of machine learning algorithms that provides feedback to the training process by quantifying how well a given set of parameters are performing when compared to their intended target. We explore the various formats of this function in an MQL5 custom wizard class.

Integrating MQL5 with data processing packages (Part 4): Big Data Handling
Exploring advanced techniques to integrate MQL5 with powerful data processing tools, this part focuses on efficient handling of big data to enhance trading analysis and decision-making.

Developing a Replay System (Part 61): Playing the service (II)
In this article, we will look at changes that will allow the replay/simulation system to operate more efficiently and securely. I will also not leave without attention those who want to get the most out of using classes. In addition, we will consider a specific problem in MQL5 that reduces code performance when working with classes, and explain how to solve it.

Developing a Replay System — Market simulation (Part 18): Ticks and more ticks (II)
Obviously the current metrics are very far from the ideal time for creating a 1-minute bar. That's the first thing we are going to fix. Fixing the synchronization problem is not difficult. This may seem hard, but it's actually quite simple. We did not make the required correction in the previous article since its purpose was to explain how to transfer the tick data that was used to create the 1-minute bars on the chart into the Market Watch window.

MQL5 Wizard Techniques you should know (Part 11): Number Walls
Number Walls are a variant of Linear Shift Back Registers that prescreen sequences for predictability by checking for convergence. We look at how these ideas could be of use in MQL5.

Price Action Analysis Toolkit Development (Part 18): Introducing Quarters Theory (III) — Quarters Board
In this article, we enhance the original Quarters Script by introducing the Quarters Board, a tool that lets you toggle quarter levels directly on the chart without needing to revisit the code. You can easily activate or deactivate specific levels, and the EA also provides trend direction commentary to help you better understand market movements.

Statistical Arbitrage Through Cointegrated Stocks (Part 5): Screening
This article proposes an asset screening process for a statistical arbitrage trading strategy through cointegrated stocks. The system starts with the regular filtering by economic factors, like asset sector and industry, and finishes with a list of criteria for a scoring system. For each statistical test used in the screening, a respective Python class was developed: Pearson correlation, Engle-Granger cointegration, Johansen cointegration, and ADF/KPSS stationarity. These Python classes are provided along with a personal note from the author about the use of AI assistants for software development.
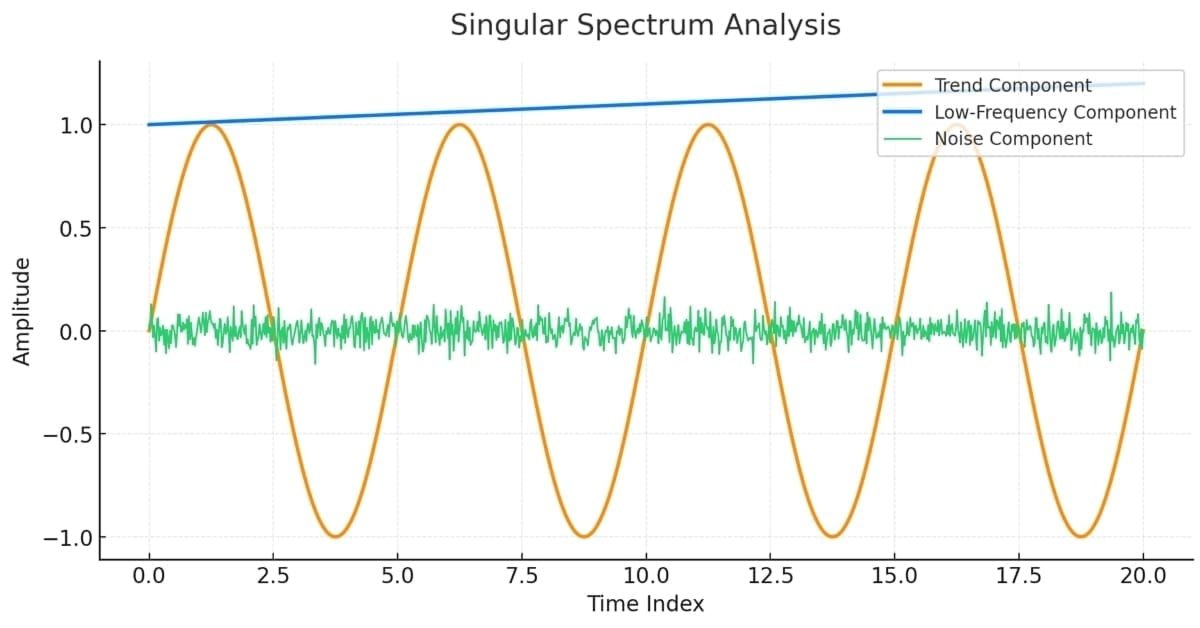
Singular Spectrum Analysis in MQL5
This article is meant as a guide for those unfamiliar with the concept of Singular Spectrum Analysis and who wish to gain enough understanding to be able to apply the built-in tools available in MQL5.

MQL5 Trading Tools (Part 26): Integrating Frequency Binning, Entropy, and Chi-Square in Visual Analyzer
In this article, we develop a frequency analysis tool in MQL5 that bins price data into histograms, computes entropy for information content, and applies chi-square tests for distribution goodness-of-fit, with interactive logs and statistical panels for market insights. We integrate per-bar or per-tick computation modes, supersampled rendering for smooth visuals, and draggable/resizable canvases with auto-scrolling logs to enhance usability in trading analysis.

Population optimization algorithms: Bird Swarm Algorithm (BSA)
The article explores the bird swarm-based algorithm (BSA) inspired by the collective flocking interactions of birds in nature. The different search strategies of individuals in BSA, including switching between flight, vigilance and foraging behavior, make this algorithm multifaceted. It uses the principles of bird flocking, communication, adaptability, leading and following to efficiently find optimal solutions.

MetaTrader 5 Machine Learning Blueprint (Part 13): Implementing Bet Sizing in MQL5
We build a production MQL5 bet‑sizing toolkit: utilities, snippets, and user‑level functions that mirror the Python originals. The methods cover probability‑to‑size mapping with overlap correction, dynamic forecast‑price sizing (calibrated sigmoid/power with limit price), occupancy‑based budgeting, and mixture‑model reserve sizing (EF3M). The result is a signed [−1, ..., 1] position plus diagnostics you can plug directly into order logic.

Dialectic Search (DA)
The article introduces the dialectical algorithm (DA), a new global optimization method inspired by the philosophical concept of dialectics. The algorithm exploits a unique division of the population into speculative and practical thinkers. Testing shows impressive performance of up to 98% on low-dimensional problems and overall efficiency of 57.95%. The article explains these metrics and presents a detailed description of the algorithm and the results of experiments on different types of functions.

Dynamic mode decomposition applied to univariate time series in MQL5
Dynamic mode decomposition (DMD) is a technique usually applied to high-dimensional datasets. In this article, we demonstrate the application of DMD on univariate time series, showing its ability to characterize a series as well as make forecasts. In doing so, we will investigate MQL5's built-in implementation of dynamic mode decomposition, paying particular attention to the new matrix method, DynamicModeDecomposition().

Creating Custom Indicators in MQL5 (Part 7): Hybrid Time Price Opportunity (TPO) Market Profiles for Session Analysis
In this article, we develop a custom indicator in MQL5 for hybrid Time Price Opportunity (TPO) market profiles, supporting multiple session timeframes such as intraday, daily, weekly, monthly, and fixed periods with timezone adjustments. The indicator quantizes prices into a grid, tracks session data including highs, lows, opens, and closes, and calculates key elements like the point of control and value area based on TPO counts. It renders profiles visually on the chart with customizable colors for TPO letters, single prints, value areas, POC, and close markers, enabling detailed session analysis

Developing a Replay System (Part 77): New Chart Trade (IV)
In this article, we will cover some of the measures and precautions to consider when creating a communication protocol. These are pretty simple and straightforward things, so we won't go into too much detail in this article. But to understand what will happen, you need to understand the content of the article.

Developing a Replay System (Part 28): Expert Advisor project — C_Mouse class (II)
When people started creating the first systems capable of computing, everything required the participation of engineers, who had to know the project very well. We are talking about the dawn of computer technology, a time when there were not even terminals for programming. As it developed and more people got interested in being able to create something, new ideas and ways of programming emerged which replaced the previous-style changing of connector positions. This is when the first terminals appeared.

Quantum Neural Network in MQL5 (Part III): A Virtual Quantum Processor Based on Qubits
The article focuses on creating a trading system with a real quantum simulator instead of mathematical analogies. The system uses 3 virtual qubits, quantum gates and superposition principles to analyze markets. It is implemented as a trading EA for MetaTrader 5 in MQL5. The main achievement is the transition from simulation to real quantum principles of financial information processing.

Chaos optimization algorithm (COA)
This is an improved chaotic optimization algorithm (COA) that combines the effects of chaos with adaptive search mechanisms. The algorithm uses a set of chaotic maps and inertial components to explore the search space. The article reveals the theoretical foundations of chaotic methods of financial optimization.

Low-Frequency Quantitative Strategies in Metatrader 5: (Part 2) Backtesting a Lead/Lag Analysis in SQL and in Metatrader 5
The article describes a complete pipeline that uses data analysis for finding low-frequency lead/lag trading opportunities. It goes into building a cross-correlation-based Lead/Lag analyser step-by-step, with special attention to the most common errors beginners may commit while developing cross-asset diffusion queries. After screening dozens of cointegrated and correlated pairs, a trading candidate pair is chosen, and its tradeability is evaluated in a pure SQL backtest. Once it is qualified, the strategy is backtested on the MetaTester for parameter optimization. The Expert Advisor with respective backtest settings and optimization inputs is provided, along with Python and SQL scripts.

Developing a Replay System — Market simulation (Part 25): Preparing for the next phase
In this article, we complete the first phase of developing our replay and simulation system. Dear reader, with this achievement I confirm that the system has reached an advanced level, paving the way for the introduction of new functionality. The goal is to enrich the system even further, turning it into a powerful tool for research and development of market analysis.

One-Dimensional Singular Spectrum Analysis
The article examines the theoretical and practical aspects of the singular spectrum analysis (SSA) method, which is an efficient method of time series analysis that allows one to represent the complex structure of a series as a decomposition into simple components, such as trend, seasonal (periodic) fluctuations and noise.

MQL5 Wizard Techniques you should know (Part 36): Q-Learning with Markov Chains
Reinforcement Learning is one of the three main tenets in machine learning, alongside supervised learning and unsupervised learning. It is therefore concerned with optimal control, or learning the best long-term policy that will best suit the objective function. It is with this back-drop, that we explore its possible role in informing the learning-process to an MLP of a wizard assembled Expert Advisor.

From Novice to Expert: Market Periods Synchronizer
In this discussion, we introduce a Higher-to-Lower Timeframe Synchronizer tool designed to solve the problem of analyzing market patterns that span across higher timeframe periods. The built-in period markers in MetaTrader 5 are often limited, rigid, and not easily customizable for non-standard timeframes. Our solution leverages the MQL5 language to develop an indicator that provides a dynamic and visual way to align higher timeframe structures within lower timeframe charts. This tool can be highly valuable for detailed market analysis. To learn more about its features and implementation, I invite you to join the discussion.

Artificial Ecosystem-based Optimization (AEO) algorithm
The article considers a metaheuristic Artificial Ecosystem-based Optimization (AEO) algorithm, which simulates interactions between ecosystem components by creating an initial population of solutions and applying adaptive update strategies, and describes in detail the stages of AEO operation, including the consumption and decomposition phases, as well as different agent behavior strategies. The article introduces the features and advantages of this algorithm.

Market Simulation (Part 23): Position View (I)
The content we will cover from this point on is much more complex in terms of theory and concepts. I will try to make the material as simple as possible. The programming part itself is quite simple and straightforward. But if you do not understand the theory behind it, you will be left with no practical basis at all for refining or adapting the replay/simulation system to tasks different from the ones I am going to show. I do not want you merely to compile and use the code I present. I want you to learn, understand and, if possible, be able to create something even better.