Articles on data analysis and statistics in MQL5
Articles on mathematical models and laws of probability are interesting for many traders. Mathematics is the basis of technical indicators, and statistics is required to analyze trading results and develop strategies.
Read about the fuzzy logic, digital filters, market profile, Kohonen maps, neural gas and many other tools that can be used for trading.
Add a new article

You are missing trading opportunities:
- Free trading apps
- Over 8,000 signals for copying
- Economic news for exploring financial markets
Registration
Log in
You agree to website policy and terms of use
If you do not have an account, please register

Implementing Practical Modules from Other Languages in MQL5 (Part 06): Python-Like File IO operations in MQL5
This article shows how to simplify complex MQL5 file operations by building a Python-style interface for effortless reading and writing. It explains how to recreate Python’s intuitive file-handling patterns through custom functions and classes. The result is a cleaner, more reliable approach to MQL5 file I/O.

MQL5 Wizard Techniques you should know (Part 47): Reinforcement Learning with Temporal Difference
Temporal Difference is another algorithm in reinforcement learning that updates Q-Values basing on the difference between predicted and actual rewards during agent training. It specifically dwells on updating Q-Values without minding their state-action pairing. We therefore look to see how to apply this, as we have with previous articles, in a wizard assembled Expert Advisor.

Market Simulation (Part 08): Sockets (II)
How about creating something practical using sockets? In today's article, we'll start creating a mini-chat. Let's look together at how this is done - it will be very interesting. Please note that the code provided here is for educational purposes only. It should not be used for commercial purposes or in ready-made applications, as it does not provide data transfer security and the content transmitted over the socket can be accessed.

Integrating MQL5 with Data Processing Packages (Part 8): Using Graph Neural Networks for Liquidity Zone Recognition
This article shows how to represent market structure as a graph in MQL5, turning swing highs/lows into nodes with features and linking them by edges. It trains a Graph Neural Network to score potential liquidity zones, exports the model to ONNX, and runs real-time inference in an Expert Advisor. Readers learn how to build the data pipeline, integrate the model, visualize zones on the chart, and use the signals for rule-based execution.

Bivariate Copulae in MQL5 (Part 1): Implementing Gaussian and Student's t-Copulae for Dependency Modeling
This is the first part of an article series presenting the implementation of bivariate copulae in MQL5. This article presents code implementing Gaussian and Student's t-copulae. It also delves into the fundamentals of statistical copulae and related topics. The code is based on the Arbitragelab Python package by Hudson and Thames.

MQL5 Wizard Techniques you should know (Part 54): Reinforcement Learning with hybrid SAC and Tensors
Soft Actor Critic is a Reinforcement Learning algorithm that we looked at in a previous article, where we also introduced python and ONNX to these series as efficient approaches to training networks. We revisit the algorithm with the aim of exploiting tensors, computational graphs that are often exploited in Python.

Role of random number generator quality in the efficiency of optimization algorithms
In this article, we will look at the Mersenne Twister random number generator and compare it with the standard one in MQL5. We will also find out the influence of the random number generator quality on the results of optimization algorithms.

Example of Causality Network Analysis (CNA) and Vector Auto-Regression Model for Market Event Prediction
This article presents a comprehensive guide to implementing a sophisticated trading system using Causality Network Analysis (CNA) and Vector Autoregression (VAR) in MQL5. It covers the theoretical background of these methods, provides detailed explanations of key functions in the trading algorithm, and includes example code for implementation.

MQL5 Wizard Techniques you should know (14): Multi Objective Timeseries Forecasting with STF
Spatial Temporal Fusion which is using both ‘space’ and time metrics in modelling data is primarily useful in remote-sensing, and a host of other visual based activities in gaining a better understanding of our surroundings. Thanks to a published paper, we take a novel approach in using it by examining its potential to traders.

Population optimization algorithms: Evolution of Social Groups (ESG)
We will consider the principle of constructing multi-population algorithms. As an example of this type of algorithm, we will have a look at the new custom algorithm - Evolution of Social Groups (ESG). We will analyze the basic concepts, population interaction mechanisms and advantages of this algorithm, as well as examine its performance in optimization problems.

Multiple Symbol Analysis With Python And MQL5 (Part II): Principal Components Analysis For Portfolio Optimization
Managing trading account risk is a challenge for all traders. How can we develop trading applications that dynamically learn high, medium, and low-risk modes for various symbols in MetaTrader 5? By using PCA, we gain better control over portfolio variance. I’ll demonstrate how to create applications that learn these three risk modes from market data fetched from MetaTrader 5.

Analyzing Price Time Gaps in MQL5 (Part I): Building a Basic Indicator
Time gap analysis helps traders identify potential market reversal points. The article discusses what a time gap is, how to interpret it, and how it can be used to detect large volume influxes into the market.

Market Simulation (Part 07): Sockets (I)
Sockets. Do you know what they are for or how to use them in MetaTrader 5? If the answer is no, let's start by studying them. In today's article, we'll cover the basics. Since there are several ways to do the same thing, and we are always interested in the result, I want to show that there is indeed a simple way to transfer data from MetaTrader 5 to other programs, such as Excel. However, the main idea is not to transfer data from MetaTrader 5 to Excel, but the opposite, that is, to transfer data from Excel or any other program to MetaTrader 5.

Two-sample Kolmogorov-Smirnov test as an indicator of time series non-stationarity
The article considers one of the most famous non-parametric homogeneity tests – the two-sample Kolmogorov-Smirnov test. Both model data and real quotes are analyzed. The article also provides an example of constructing a non-stationarity indicator (iSmirnovDistance).

MQL5 Wizard Techniques you should know (Part 20): Symbolic Regression
Symbolic Regression is a form of regression that starts with minimal to no assumptions on what the underlying model that maps the sets of data under study would look like. Even though it can be implemented by Bayesian Methods or Neural Networks, we look at how an implementation with Genetic Algorithms can help customize an expert signal class usable in the MQL5 wizard.

Population optimization algorithms: Charged System Search (CSS) algorithm
In this article, we will consider another optimization algorithm inspired by inanimate nature - Charged System Search (CSS) algorithm. The purpose of this article is to present a new optimization algorithm based on the principles of physics and mechanics.

Extremal Optimization (EO)
The article discusses the Extremal Optimization (EO) algorithm, an optimization method inspired by the Bak-Sneppen self-organized criticality model, where evolution occurs through the elimination of the worst-case components of the system. The modified population version of the algorithm demonstrates a shift away from theoretical principles in favor of practical efficiency, leading to the creation of powerful computational tools.

MQL5 Wizard Techniques you should know (Part 87): Volatility-Scaled Money Management with Monotonic Queue in MQL5
This article presents a custom MQL5 money management class that adapts position sizing to real-time volatility using a monotonic queue for O(N) sliding-window extremes. The class applies inverse volatility scaling and optionally validates risk with an RBF network. We show implementation details in the Optimize method and compare results with the inbuilt Size-Optimized class to assess latency and risk control benefits.

Beyond Maximum Drawdown: Building a Drawdown DNA Analyzer in MQL5
Maximum drawdown is one number that hides what really matters: how often an equity curve declines, how long it stays below a previous peak, and how quickly it recovers. This article builds a native MQL5 tool that reconstructs the underwater curve, breaks it into individual drawdown episodes (depth, duration, recovery time), computes the Ulcer Index, Pain Index, and Recovery Factor, and combines them into a single resilience grade with practical recommendations. No external libraries, no Python, no AI.

News Trading Made Easy (Part 4): Performance Enhancement
This article will dive into methods to improve the expert's runtime in the strategy tester, the code will be written to divide news event times into hourly categories. These news event times will be accessed within their specified hour. This ensures that the EA can efficiently manage event-driven trades in both high and low-volatility environments.

Neuroboids Optimization Algorithm (NOA)
A new bioinspired optimization metaheuristic, NOA (Neuroboids Optimization Algorithm), combines the principles of collective intelligence and neural networks. Unlike conventional methods, the algorithm uses a population of self-learning "neuroboids", each with its own neural network that adapts its search strategy in real time. The article reveals the architecture of the algorithm, the mechanisms of self-learning of agents, and the prospects for applying this hybrid approach to complex optimization problems.

MQL5 Wizard Techniques you should know (Part 33): Gaussian Process Kernels
Gaussian Process Kernels are the covariance function of the Normal Distribution that could play a role in forecasting. We explore this unique algorithm in a custom signal class of MQL5 to see if it could be put to use as a prime entry and exit signal.

MQL5 Trading Toolkit (Part 5): Expanding the History Management EX5 Library with Position Functions
Discover how to create exportable EX5 functions to efficiently query and save historical position data. In this step-by-step guide, we will expand the History Management EX5 library by developing modules that retrieve key properties of the most recently closed position. These include net profit, trade duration, pip-based stop loss, take profit, profit values, and various other important details.

Developing a Replay System (Part 65): Playing the service (VI)
In this article, we will look at how to implement and solve the mouse pointer issue when using it in conjunction with a replay/simulation application. The content presented here is intended solely for educational purposes. Under no circumstances should the application be viewed for any purpose other than to learn and master the concepts presented.

Developing a Replay System (Part 52): Things Get Complicated (IV)
In this article, we will change the mouse pointer to enable the interaction with the control indicator to ensure reliable and stable operation.

Category Theory in MQL5 (Part 11): Graphs
This article is a continuation in a series that look at Category Theory implementation in MQL5. In here we examine how Graph-Theory could be integrated with monoids and other data structures when developing a close-out strategy to a trading system.

Population optimization algorithms: Binary Genetic Algorithm (BGA). Part I
In this article, we will explore various methods used in binary genetic and other population algorithms. We will look at the main components of the algorithm, such as selection, crossover and mutation, and their impact on the optimization. In addition, we will study data presentation methods and their impact on optimization results.

Gating mechanisms in ensemble learning
In this article, we continue our exploration of ensemble models by discussing the concept of gates, specifically how they may be useful in combining model outputs to enhance either prediction accuracy or model generalization.

Deterministic Oscillatory Search (DOS)
Deterministic Oscillatory Search (DOS) algorithm is an innovative global optimization method that combines the advantages of gradient and swarm algorithms without the use of random numbers. The fitness oscillation and slope mechanism allows DOS to explore complex search spaces in a deterministic manner.

Market Simulation (Part 05): Creating the C_Orders Class (II)
In this article, I will explain how Chart Trade, together with the Expert Advisor, will process a request to close all of the users' open positions. This may sound simple, but there are a few complications that you need to know how to manage.

Market Simulation (Part 03): A Matter of Performance
Often we have to take a step back and then move forward. In this article, we will show all the changes necessary to ensure that the Mouse and Chart Trade indicators do not break. As a bonus, we'll also cover other changes that have occurred in other header files that will be widely used in the future.

MQL5 Wizard Techniques you should know (Part 35): Support Vector Regression
Support Vector Regression is an idealistic way of finding a function or ‘hyper-plane’ that best describes the relationship between two sets of data. We attempt to exploit this in time series forecasting within custom classes of the MQL5 wizard.

Analyzing binary code of prices on the exchange (Part I): A new look at technical analysis
This article presents an innovative approach to technical analysis based on converting price movements into binary code. The author demonstrates how various aspects of market behavior — from simple price movements to complex patterns — can be encoded in a sequence of zeros and ones.

Eigenvectors and eigenvalues: Exploratory data analysis in MetaTrader 5
In this article we explore different ways in which the eigenvectors and eigenvalues can be applied in exploratory data analysis to reveal unique relationships in data.

Larry Williams Market Secrets (Part 7): An Empirical Study of the Trade Day of the Week Concept
An empirical study of Larry Williams’ Trade Day of the Week concept, showing how time-based market bias can be measured, tested, and applied using MQL5. This article presents a practical framework for analyzing win rates and performance across trading days to improve short-term trading systems.
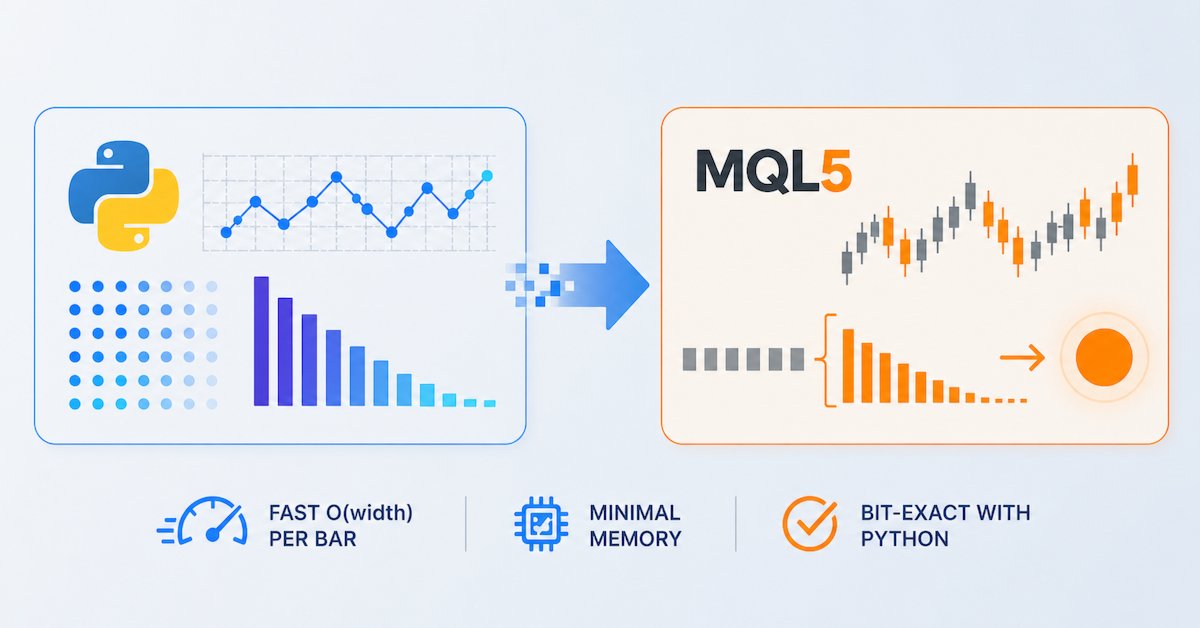
Feature Engineering for ML (Part 2): Implementing Fixed-Width Fractional Differentiation in MQL5
This article delivers a production-grade MQL5 implementation of fixed-width fractional differentiation for live MetaTrader 5 feeds. We introduce a header-only CFFDEngine that precomputes weights without a fixed cap, performs O(width) per-bar updates, and avoids per-tick allocations. The FFD.mq5 indicator supports all ENUM_APPLIED_PRICE types and prev_calculated optimization. Validation scripts confirm numerical equivalence with the standard Python frac diff_ffd pipeline.

Application of the Grey Model in Technical Analysis of Financial Time Series
This article explores the grey model, a promising tool that can expand trader's capabilities. We will look at some options for applying this model to technical analysis and building trading strategies.

Statistical Arbitrage Through Cointegrated Stocks (Part 10): Detecting Structural Breaks
This article presents the Chow test for detecting structural breaks in pair relationships and the application of the Cumulative Sum of Squares - CUSUM - for structural breaks monitoring and early detection. The article uses the Nvidia/Intel partnership announcement and the US Gov foreign trade tariff announcement as examples of slope inversion and intercept shift, respectively. Python scripts for all the tests are provided.

Population optimization algorithms: Micro Artificial immune system (Micro-AIS)
The article considers an optimization method based on the principles of the body's immune system - Micro Artificial Immune System (Micro-AIS) - a modification of AIS. Micro-AIS uses a simpler model of the immune system and simple immune information processing operations. The article also discusses the advantages and disadvantages of Micro-AIS compared to conventional AIS.

Developing a Replay System (Part 30): Expert Advisor project — C_Mouse class (IV)
Today we will learn a technique that can help us a lot in different stages of our professional life as a programmer. Often it is not the platform itself that is limited, but the knowledge of the person who talks about the limitations. This article will tell you that with common sense and creativity you can make the MetaTrader 5 platform much more interesting and versatile without resorting to creating crazy programs or anything like that, and create simple yet safe and reliable code. We will use our creativity to modify existing code without deleting or adding a single line to the source code.