
Price Action Analysis Toolkit Development (Part 18): Introducing Quarters Theory (III) — Quarters Board

Contents
Introduction
In our introduction to Quarters Theory, we began with the Quarters Drawer script, which is its first component. This script automates drawing quarter levels on a chart and features Boolean toggles to control the visibility of each level.
input bool   DrawLargeQuarters  = true;     // Draw intermediate large quarter lines.
input bool   DrawSmallQuarters  = false;    // Draw small quarter lines.
input bool   DrawOvershootAreas = true;     // Mark overshoot/undershoot areas for large quarter lines.
For example, setting DrawSmallQuarters to true displays the small quarter lines, while setting DrawLargeQuarters to false hides the large quarter lines. The same approach applies to the Overshoots and Undershoots levels. This functionality allows you to focus on specific levels, keeping the chart clean and uncluttered. If you want to view all levels, simply enable all the toggles.
Have you ever found it tedious to repeatedly dive back into the code just to toggle a setting? In this article, we introduce the Quarters Board, an enhanced tool that allows you to automatically toggle Boolean flags on or off with a single button press on the live chart. Instead of editing the code to change the DrawSmallQuarters flag, you can now make adjustments directly on the chart, streamlining the process for every trader. For instance, if you only want to view the large quarters, a simple button press will achieve that without any hassle.
Overview
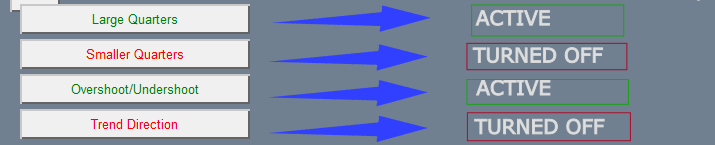
As mentioned in the introduction, this tool allows you to toggle which levels appear on the chart without needing to return to the code to edit a Boolean flag. The Quarter Board is an expert advisor that features four buttons: Large Quarters, Small Quarters, Overshoot/Undershoot, and Trend Direction. Pressing any button toggles its corresponding level: the button's text turns green when the level is active, and red when it is turned off.
The Trend Direction button is an additional feature that provides real-time market insights. With just one click, it calculates a 50-period simple moving average and compares it against the current market price, helping you quickly determine whether the market is trending upward, downward, or moving sideways. The button even changes color to show its active status, providing a clear and user-friendly method to monitor market trends directly on your chart. Let's refer to the following section to understand the core logic behind our EA's functionality.
Logic
This EA is designed to be both user-friendly and highly adaptable. The settings make it easy to customize, the interface is clean and well-organized, and the button-based controls ensure smooth interaction. By automatically handling the addition and removal of quarter lines, the EA keeps the chart neat and focused on relevant price levels. The live trend commentary adds another layer of insight, helping traders quickly gauge market direction without cluttering their screen. With both visual and analytical tools working together, this EA simplifies trading choices while keeping things intuitive and efficient.
Global Configuration and Structure
The EA starts by defining key parameters that determine how price levels and chart elements will be displayed. Input settings allow traders to customize values such as the spacing between major price levels and the colors used for various lines. These settings provide flexibility, letting users modify the EA’s appearance without changing its core logic. The code also includes several global boolean variables that act as switches, enabling or disabling specific features like large quarter lines or trend commentary. Macros are used to assign consistent names to chart objects, ensuring that every element is referenced uniformly throughout the script. Organizing these settings in one place makes it easier to adjust parameters and troubleshoot any issues without searching through multiple sections of code.#property copyright "Christian Benjamin" #property link "https://www.mql5.com/en/users/lynnchris" #property version "1.0" #property strict //---- Input parameters for drawing levels ---------------------------- input double MajorStep = 0.1000; // Difference between major whole numbers //---- Color settings --------------------------------------------------- input color MajorColor = 0x2F4F4F; // Dark Slate Gray for major lines. input color LargeQuarterColor = 0x8B0000; // Dark Red for large quarter lines. input color SmallQuarterColor = 0x00008B; // Dark Blue for small quarter lines. input color OvershootColor = clrRed; // Red for overshoot/undershoot lines. //---- Line styles and thickness settings ----------------------------- input ENUM_LINE_STYLE MajorLineStyle = STYLE_SOLID; input int MajorLineWidth = 4; input ENUM_LINE_STYLE LargeQuarterLineStyle = STYLE_DOT; input int LargeQuarterLineWidth = 3; input ENUM_LINE_STYLE OvershootLineStyle = STYLE_DASH; input int OvershootLineWidth = 1; input ENUM_LINE_STYLE SmallQuarterLineStyle = STYLE_SOLID; input int SmallQuarterLineWidth = 1; //---- Panel and button settings -------------------------------------- input int PanelX = 10; input int PanelY = 10; input int PanelWidth = 250; input int ButtonHeight = 30; input int ButtonSpacing= 5; //---- Global toggle variables ---------------------------------------- bool g_DrawLargeQuarters = true; bool g_DrawSmallQuarters = false; bool g_DrawOvershootAreas = true; bool g_DrawTrendDirection = false; //---- Object names for panel and buttons ----------------------------- #define PANEL_NAME "LevelsPanel" #define BUTTON_LARGE "btnLargeQuarters" #define BUTTON_SMALL "btnSmallQuarters" #define BUTTON_OVERSHOOT "btnOvershoot" #define BUTTON_TREND "btnTrendDirection" #define TREND_LABEL "TrendDirectionLabel"
Panel and Button Initialization
Once the configuration is set, the EA constructs the user interface. A background panel is created to group all buttons together, providing a structured layout. The panel is simulated using a rectangle label, with its dimensions adjusted by modifying the text properties. Buttons are then positioned relative to the panel, ensuring proper spacing and alignment.
These buttons allow traders to toggle features like large quarters, small quarters, overshoot areas, and trend direction commentary. Each button is given a consistent width and height, creating a clean, organized look. The setup makes it easy for users to interact with the EA, as they can enable or disable specific elements with a single click. By maintaining a uniform layout, the EA ensures that all controls are easily accessible and visually distinct.
void CreatePanel()
  {
   if(ObjectCreate(0, PANEL_NAME, OBJ_RECTANGLE_LABEL, 0, 0, 0))
     {
      ObjectSetInteger(0, PANEL_NAME, OBJPROP_CORNER, CORNER_LEFT_UPPER);
      ObjectSetInteger(0, PANEL_NAME, OBJPROP_XDISTANCE, PanelX);
      ObjectSetInteger(0, PANEL_NAME, OBJPROP_YDISTANCE, PanelY);
      ObjectSetInteger(0, PANEL_NAME, OBJPROP_COLOR, clrDarkGray);
      ObjectSetString(0, PANEL_NAME, OBJPROP_TEXT, "\n\n\n\n");
      ObjectSetInteger(0, PANEL_NAME, OBJPROP_BORDER_TYPE, BORDER_RAISED);
     }
  }
Handling User Interactions
User interaction is a crucial aspect of the EA, managed through an event-handling system. The script listens for chart events, specifically checking if a button has been clicked. When a button is pressed, the system identifies which function should be activated by matching the button’s name. Once identified, the corresponding feature is switched on or off. For example, pressing the large quarters button toggles between showing and hiding those price levels.
To enhance the user experience, button colors are updated immediately, providing clear visual feedback—active buttons might turn green, while inactive ones remain red. This system ensures that each feature operates independently, preventing conflicts and making the tool responsive to real-time user input. By structuring event handling efficiently, the EA remains stable and easy to use, even in fast-paced market conditions.
void OnChartEvent(const int id,
                  const long &lparam,
                  const double &dparam,
                  const string &sparam)
  {
   if(id == CHARTEVENT_OBJECT_CLICK)
     {
      if(sparam == BUTTON_LARGE)
        {
         g_DrawLargeQuarters = !g_DrawLargeQuarters;
         UpdateButtonColors();
         DrawQuarterLines();
        }
      else if(sparam == BUTTON_TREND)
        {
         g_DrawTrendDirection = !g_DrawTrendDirection;
         UpdateButtonColors();
         if(g_DrawTrendDirection)
            UpdateTrendComment();
         else
            DeleteTrendComment();
        }
      // Similar handling for other buttons...
     }
  }
Drawing and Removing Quarter Lines
One of the core functions of the EA is plotting price levels on the chart. The process starts by determining the current market price and calculating key price boundaries. Major levels are always drawn, while additional levels such as large quarters, small quarters, and overshoot zones are displayed only if their respective buttons are enabled. To keep the chart clean, the EA first removes any previously drawn lines before placing new ones.
This prevents overlapping or outdated lines from cluttering the display. Each quartering method follows a structured calculation, ensuring that price levels align correctly. If a feature is turned off, the script removes the corresponding lines, giving traders full control over what is displayed. This approach ensures that the chart remains organized and provides only the most relevant information based on user preferences.
void DrawQuarterLines()
  {
   DeleteQuarterLines();
   double currentPrice = SymbolInfoDouble(_Symbol, SYMBOL_BID);
   double lowerMajor = MathFloor(currentPrice / MajorStep) * MajorStep;
   DrawHorizontalLine("MajorLower", lowerMajor, MajorColor, MajorLineWidth, MajorLineStyle);
   if(g_DrawLargeQuarters)
     {
      double LQIncrement = MajorStep / 4.0;
      for(int i = 1; i < 4; i++)
        {
         double level = lowerMajor + i * LQIncrement;
         DrawHorizontalLine("LargeQuarter_" + IntegerToString(i), level, LargeQuarterColor, LargeQuarterLineWidth, LargeQuarterLineStyle);
         // Overshoot/Undershoot handling...
        }
     }
   // Additional code for small quarters...
  }
Trend Commentary Display
Beyond graphical elements, the EA also provides traders with a textual analysis of market trends. It calculates a simple moving average (SMA) over a defined period and compares it to the current price. If the price is above the SMA, the trend is considered bullish; if it is below, the trend is bearish. If there is little movement around the SMA, the market is classified as neutral. This analysis is displayed as a text label on the chart, positioned just below the Trend Direction button to ensure visibility without interfering with other elements. The commentary updates dynamically, providing real-time insights as market conditions evolve. This feature complements the graphical quartering system by giving traders an extra layer of analysis, helping them make more informed decisions.
void UpdateTrendComment()
  {
   double currentPrice = SymbolInfoDouble(_Symbol, SYMBOL_BID);
   double smaValue = 0.0;
   int handle = iMA(_Symbol, PERIOD_CURRENT, 50, 0, MODE_SMA, PRICE_CLOSE);
   if(handle != INVALID_HANDLE)
     {
      double buffer[];
      if(CopyBuffer(handle, 0, 1, 1, buffer) > 0)
         smaValue = buffer[0];
      IndicatorRelease(handle);
     }
   string trendComment = (currentPrice > smaValue) ? "Uptrend" :
                         (currentPrice < smaValue) ? "Downtrend" : "Sideways";

   int trendLabelY = PanelY + 10 + 3 * (ButtonHeight + ButtonSpacing) + ButtonHeight + ButtonSpacing;
   if(ObjectFind(0, TREND_LABEL) == -1)
     {
      ObjectCreate(0, TREND_LABEL, OBJ_LABEL, 0, 0, 0);
      ObjectSetInteger(0, TREND_LABEL, OBJPROP_CORNER, CORNER_LEFT_UPPER);
      ObjectSetInteger(0, TREND_LABEL, OBJPROP_XDISTANCE, PanelX + 10);
      ObjectSetInteger(0, TREND_LABEL, OBJPROP_YDISTANCE, trendLabelY);
      ObjectSetInteger(0, TREND_LABEL, OBJPROP_COLOR, clrWhite);
      ObjectSetInteger(0, TREND_LABEL, OBJPROP_FONTSIZE, 14);
     }
   ObjectSetString(0, TREND_LABEL, OBJPROP_TEXT, "Trend Direction: " + trendComment);
  }
Full EA code
//+------------------------------------------------------------------+
//|                                             Quarters Board EA.mq5|
//|                                Copyright 2025, Christian Benjamin|
//|                           https://www.mql5.com/en/users/lynnchris|
//+------------------------------------------------------------------+
#property copyright "Christian Benjamin"
#property link      "https://www.mql5.com/en/users/lynnchris"
#property version   "1.0"
#property strict

//---- Input parameters for drawing levels ----------------------------
input double MajorStep = 0.1000;   // Difference between major whole numbers

//---- Color settings ---------------------------------------------------
input color  MajorColor         = 0x2F4F4F; // Dark Slate Gray for major lines.
input color  LargeQuarterColor  = 0x8B0000; // Dark Red for large quarter lines.
input color  SmallQuarterColor  = 0x00008B; // Dark Blue for small quarter lines.
input color  OvershootColor     = clrRed;   // Red for overshoot/undershoot lines.

//---- Line styles and thickness settings -----------------------------
input ENUM_LINE_STYLE MajorLineStyle       = STYLE_SOLID;
input int    MajorLineWidth                 = 4;
input ENUM_LINE_STYLE LargeQuarterLineStyle  = STYLE_DOT;
input int    LargeQuarterLineWidth          = 3;
input ENUM_LINE_STYLE OvershootLineStyle     = STYLE_DASH;
input int    OvershootLineWidth             = 1;
input ENUM_LINE_STYLE SmallQuarterLineStyle  = STYLE_SOLID;
input int    SmallQuarterLineWidth          = 1;

//---- Panel and button settings --------------------------------------
input int PanelX       = 10;
input int PanelY       = 10;
input int PanelWidth   = 250;
input int ButtonHeight = 30;
input int ButtonSpacing= 5;

//---- Global toggle variables ----------------------------------------
bool g_DrawLargeQuarters   = true;
bool g_DrawSmallQuarters   = false;
bool g_DrawOvershootAreas  = true;
bool g_DrawTrendDirection  = false;

//---- Object names for panel and buttons -----------------------------
#define PANEL_NAME       "LevelsPanel"
#define BUTTON_LARGE     "btnLargeQuarters"
#define BUTTON_SMALL     "btnSmallQuarters"
#define BUTTON_OVERSHOOT "btnOvershoot"
#define BUTTON_TREND     "btnTrendDirection"
#define TREND_LABEL      "TrendDirectionLabel"

//+------------------------------------------------------------------+
//| Expert initialization function                                   |
//+------------------------------------------------------------------+
int OnInit()
  {
// Create panel background and buttons
   CreatePanel();
   CreateButtons();
// Draw quarter lines initially
   DrawQuarterLines();
// If trend commentary is toggled on, update it
   if(g_DrawTrendDirection)
      UpdateTrendComment();
   return(INIT_SUCCEEDED);
  }
//+------------------------------------------------------------------+
//| Expert deinitialization function                                 |
//+------------------------------------------------------------------+
void OnDeinit(const int reason)
  {
// Delete panel, buttons, quarter lines, and trend commentary
   ObjectDelete(0, PANEL_NAME);
   ObjectDelete(0, BUTTON_LARGE);
   ObjectDelete(0, BUTTON_SMALL);
   ObjectDelete(0, BUTTON_OVERSHOOT);
   ObjectDelete(0, BUTTON_TREND);
   DeleteQuarterLines();
   DeleteTrendComment();
  }
//+------------------------------------------------------------------+
//| Expert tick function                                             |
//+------------------------------------------------------------------+
void OnTick()
  {
// Redraw quarter lines on every tick
   DrawQuarterLines();
// Update trend commentary if enabled
   if(g_DrawTrendDirection)
      UpdateTrendComment();
  }
//+------------------------------------------------------------------+
//| Chart event function to catch button clicks                      |
//+------------------------------------------------------------------+
void OnChartEvent(const int id,
                  const long &lparam,
                  const double &dparam,
                  const string &sparam)
  {
   if(id == CHARTEVENT_OBJECT_CLICK)
     {
      if(sparam == BUTTON_LARGE)
        {
         g_DrawLargeQuarters = !g_DrawLargeQuarters;
         UpdateButtonColors();
         DrawQuarterLines();
        }
      else
         if(sparam == BUTTON_SMALL)
           {
            g_DrawSmallQuarters = !g_DrawSmallQuarters;
            UpdateButtonColors();
            DrawQuarterLines();
           }
         else
            if(sparam == BUTTON_OVERSHOOT)
              {
               g_DrawOvershootAreas = !g_DrawOvershootAreas;
               UpdateButtonColors();
               DrawQuarterLines();
              }
            else
               if(sparam == BUTTON_TREND)
                 {
                  g_DrawTrendDirection = !g_DrawTrendDirection;
                  UpdateButtonColors();
                  if(g_DrawTrendDirection)
                     UpdateTrendComment();
                  else
                     DeleteTrendComment();
                 }
     }
  }
//+------------------------------------------------------------------+
//| Create panel background                                          |
//+------------------------------------------------------------------+
void CreatePanel()
  {
   if(ObjectCreate(0, PANEL_NAME, OBJ_RECTANGLE_LABEL, 0, 0, 0))
     {
      ObjectSetInteger(0, PANEL_NAME, OBJPROP_CORNER, CORNER_LEFT_UPPER);
      ObjectSetInteger(0, PANEL_NAME, OBJPROP_XDISTANCE, PanelX);
      ObjectSetInteger(0, PANEL_NAME, OBJPROP_YDISTANCE, PanelY);
      ObjectSetInteger(0, PANEL_NAME, OBJPROP_COLOR, clrDarkGray);
      // Simulate a larger panel using newlines in the text.
      string panelText = "\n\n\n\n";
      ObjectSetString(0, PANEL_NAME, OBJPROP_TEXT, panelText);
      ObjectSetInteger(0, PANEL_NAME, OBJPROP_BORDER_TYPE, BORDER_RAISED);
     }
  }
//+------------------------------------------------------------------+
//| Create buttons on the panel                                      |
//+------------------------------------------------------------------+
void CreateButtons()
  {
   int x = PanelX + 10;
   int y = PanelY + 10;
   int btnWidth = PanelWidth - 20;
// Button for Large Quarters
   if(!ObjectCreate(0, BUTTON_LARGE, OBJ_BUTTON, 0, 0, 0))
      Print("Failed to create button ", BUTTON_LARGE);
   else
     {
      ObjectSetInteger(0, BUTTON_LARGE, OBJPROP_CORNER, CORNER_LEFT_UPPER);
      ObjectSetInteger(0, BUTTON_LARGE, OBJPROP_XDISTANCE, x);
      ObjectSetInteger(0, BUTTON_LARGE, OBJPROP_YDISTANCE, y);
      ObjectSetInteger(0, BUTTON_LARGE, OBJPROP_XSIZE, btnWidth);
      ObjectSetInteger(0, BUTTON_LARGE, OBJPROP_YSIZE, ButtonHeight);
      ObjectSetString(0, BUTTON_LARGE, OBJPROP_TEXT, "Large Quarters");
     }
// Button for Smaller Quarters
   y += ButtonHeight + ButtonSpacing;
   if(!ObjectCreate(0, BUTTON_SMALL, OBJ_BUTTON, 0, 0, 0))
      Print("Failed to create button ", BUTTON_SMALL);
   else
     {
      ObjectSetInteger(0, BUTTON_SMALL, OBJPROP_CORNER, CORNER_LEFT_UPPER);
      ObjectSetInteger(0, BUTTON_SMALL, OBJPROP_XDISTANCE, x);
      ObjectSetInteger(0, BUTTON_SMALL, OBJPROP_YDISTANCE, y);
      ObjectSetInteger(0, BUTTON_SMALL, OBJPROP_XSIZE, btnWidth);
      ObjectSetInteger(0, BUTTON_SMALL, OBJPROP_YSIZE, ButtonHeight);
      ObjectSetString(0, BUTTON_SMALL, OBJPROP_TEXT, "Smaller Quarters");
     }
// Button for Overshoot/Undershoot
   y += ButtonHeight + ButtonSpacing;
   if(!ObjectCreate(0, BUTTON_OVERSHOOT, OBJ_BUTTON, 0, 0, 0))
      Print("Failed to create button ", BUTTON_OVERSHOOT);
   else
     {
      ObjectSetInteger(0, BUTTON_OVERSHOOT, OBJPROP_CORNER, CORNER_LEFT_UPPER);
      ObjectSetInteger(0, BUTTON_OVERSHOOT, OBJPROP_XDISTANCE, x);
      ObjectSetInteger(0, BUTTON_OVERSHOOT, OBJPROP_YDISTANCE, y);
      ObjectSetInteger(0, BUTTON_OVERSHOOT, OBJPROP_XSIZE, btnWidth);
      ObjectSetInteger(0, BUTTON_OVERSHOOT, OBJPROP_YSIZE, ButtonHeight);
      ObjectSetString(0, BUTTON_OVERSHOOT, OBJPROP_TEXT, "Overshoot/Undershoot");
     }
// Button for Trend Direction
   y += ButtonHeight + ButtonSpacing;
   if(!ObjectCreate(0, BUTTON_TREND, OBJ_BUTTON, 0, 0, 0))
      Print("Failed to create button ", BUTTON_TREND);
   else
     {
      ObjectSetInteger(0, BUTTON_TREND, OBJPROP_CORNER, CORNER_LEFT_UPPER);
      ObjectSetInteger(0, BUTTON_TREND, OBJPROP_XDISTANCE, x);
      ObjectSetInteger(0, BUTTON_TREND, OBJPROP_YDISTANCE, y);
      ObjectSetInteger(0, BUTTON_TREND, OBJPROP_XSIZE, btnWidth);
      ObjectSetInteger(0, BUTTON_TREND, OBJPROP_YSIZE, ButtonHeight);
      ObjectSetString(0, BUTTON_TREND, OBJPROP_TEXT, "Trend Direction");
     }
   UpdateButtonColors();
  }
//+------------------------------------------------------------------+
//| Update button colors based on toggle state                       |
//+------------------------------------------------------------------+
void UpdateButtonColors()
  {
   color onColor  = clrGreen;
   color offColor = clrRed;
   ObjectSetInteger(0, BUTTON_LARGE,     OBJPROP_COLOR, g_DrawLargeQuarters  ? onColor : offColor);
   ObjectSetInteger(0, BUTTON_SMALL,     OBJPROP_COLOR, g_DrawSmallQuarters  ? onColor : offColor);
   ObjectSetInteger(0, BUTTON_OVERSHOOT, OBJPROP_COLOR, g_DrawOvershootAreas ? onColor : offColor);
   ObjectSetInteger(0, BUTTON_TREND,     OBJPROP_COLOR, g_DrawTrendDirection ? onColor : offColor);
  }
//+------------------------------------------------------------------+
//| Delete quarter lines                                             |
//+------------------------------------------------------------------+
void DeleteQuarterLines()
  {
   ObjectDelete(0, "MajorLower");
   ObjectDelete(0, "MajorUpper");
   for(int i = 1; i < 4; i++)
     {
      ObjectDelete(0, "LargeQuarter_" + IntegerToString(i));
      ObjectDelete(0, "Overshoot_" + IntegerToString(i) + "_up");
      ObjectDelete(0, "Undershoot_" + IntegerToString(i) + "_down");
     }
   for(int seg = 0; seg < 10; seg++)
     {
      for(int j = 1; j < 4; j++)
        {
         ObjectDelete(0, "SmallQuarter_" + IntegerToString(seg) + "_" + IntegerToString(j));
        }
     }
  }
//+------------------------------------------------------------------+
//| Delete trend commentary                                          |
//+------------------------------------------------------------------+
void DeleteTrendComment()
  {
   ObjectDelete(0, TREND_LABEL);
  }
//+------------------------------------------------------------------+
//| Update trend commentary                                          |
//+------------------------------------------------------------------+
void UpdateTrendComment()
  {
   double currentPrice = SymbolInfoDouble(_Symbol, SYMBOL_BID);
   if(currentPrice == 0)
      return;
   double smaValue = 0.0;
   double buffer[];
   int handle = iMA(_Symbol, PERIOD_CURRENT, 50, 0, MODE_SMA, PRICE_CLOSE);
   if(handle != INVALID_HANDLE)
     {
      if(CopyBuffer(handle, 0, 1, 1, buffer) > 0)
         smaValue = buffer[0];
      IndicatorRelease(handle);
     }
   string trendComment;
   if(currentPrice > smaValue)
      trendComment = "Uptrend";
   else
      if(currentPrice < smaValue)
         trendComment = "Downtrend";
      else
         trendComment = "Sideways";

// Calculate the position for the commentary label below the Trend Direction button
   int trendButtonY = PanelY + 10 + 3 * (ButtonHeight + ButtonSpacing);
   int trendLabelY = trendButtonY + ButtonHeight + ButtonSpacing;
   int trendLabelX = PanelX + 10;

   if(ObjectFind(0, TREND_LABEL) == -1)
     {
      ObjectCreate(0, TREND_LABEL, OBJ_LABEL, 0, 0, 0);
      ObjectSetInteger(0, TREND_LABEL, OBJPROP_CORNER, CORNER_LEFT_UPPER);
      ObjectSetInteger(0, TREND_LABEL, OBJPROP_XDISTANCE, trendLabelX);
      ObjectSetInteger(0, TREND_LABEL, OBJPROP_YDISTANCE, trendLabelY);
      ObjectSetInteger(0, TREND_LABEL, OBJPROP_COLOR, clrWhite);
      ObjectSetInteger(0, TREND_LABEL, OBJPROP_FONTSIZE, 14);
     }
   string txt = "Trend Direction: " + trendComment;
   ObjectSetString(0, TREND_LABEL, OBJPROP_TEXT, txt);
  }
//+------------------------------------------------------------------+
//| Draw horizontal line utility                                     |
//+------------------------------------------------------------------+
void DrawHorizontalLine(string name, double price, color lineColor, int width, ENUM_LINE_STYLE style)
  {
   if(ObjectFind(0, name) != -1)
      ObjectDelete(0, name);
   if(!ObjectCreate(0, name, OBJ_HLINE, 0, 0, price))
     {
      Print("Failed to create line: ", name);
      return;
     }
   ObjectSetInteger(0, name, OBJPROP_COLOR, lineColor);
   ObjectSetInteger(0, name, OBJPROP_STYLE, style);
   ObjectSetInteger(0, name, OBJPROP_WIDTH, width);
   ObjectSetInteger(0, name, OBJPROP_RAY_RIGHT, true);
  }
//+------------------------------------------------------------------+
//| Draw quarter lines based on toggle settings                      |
//+------------------------------------------------------------------+
void DrawQuarterLines()
  {
   DeleteQuarterLines();
   double currentPrice = SymbolInfoDouble(_Symbol, SYMBOL_BID);
   if(currentPrice == 0)
      return;
   double lowerMajor = MathFloor(currentPrice / MajorStep) * MajorStep;
   double upperMajor = lowerMajor + MajorStep;
   DrawHorizontalLine("MajorLower", lowerMajor, MajorColor, MajorLineWidth, MajorLineStyle);
   DrawHorizontalLine("MajorUpper", upperMajor, MajorColor, MajorLineWidth, MajorLineStyle);
   if(g_DrawLargeQuarters)
     {
      double LQIncrement = MajorStep / 4.0;
      for(int i = 1; i < 4; i++)
        {
         double level = lowerMajor + i * LQIncrement;
         string objName = "LargeQuarter_" + IntegerToString(i);
         DrawHorizontalLine(objName, level, LargeQuarterColor, LargeQuarterLineWidth, LargeQuarterLineStyle);
         if(g_DrawOvershootAreas)
           {
            double smallQuarter = MajorStep / 40.0;
            DrawHorizontalLine("Overshoot_" + IntegerToString(i) + "_up", level + smallQuarter, OvershootColor, OvershootLineWidth, OvershootLineStyle);
            DrawHorizontalLine("Undershoot_" + IntegerToString(i) + "_down", level - smallQuarter, OvershootColor, OvershootLineWidth, OvershootLineStyle);
           }
        }
     }
   if(g_DrawSmallQuarters)
     {
      double segStep = MajorStep / 10.0;
      double smallQuarter = segStep / 4.0;
      for(int seg = 0; seg < 10; seg++)
        {
         double segStart = lowerMajor + seg * segStep;
         for(int j = 1; j < 4; j++)
           {
            double level = segStart + j * smallQuarter;
            string objName = "SmallQuarter_" + IntegerToString(seg) + "_" + IntegerToString(j);
            DrawHorizontalLine(objName, level, SmallQuarterColor, SmallQuarterLineWidth, SmallQuarterLineStyle);
           }
        }
     }
  }
//+------------------------------------------------------------------+
Outcomes
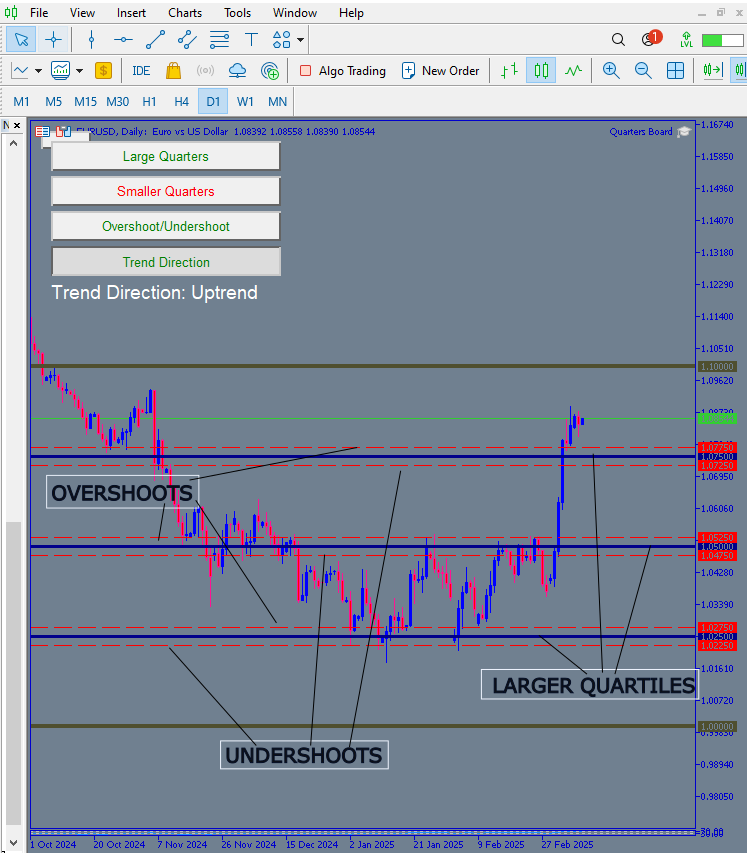
In this section, we examine the outcomes and performance of our EA. Below is a GIF diagram illustrating its behavior. When you drag the EA onto an EURUSD chart, a panel with buttons appears. Initially, the "Larger Quarter" and "Overshoot/Undershoot" buttons display green text, indicating they are deactivated. In contrast, the "Smaller Quarters" and "Trend Direction" buttons show red text, meaning these levels are active. When each button is pressed, you can see the corresponding levels appear on the chart when activated, or be removed when deactivated. Notably, after turning on the Trend Direction button, the trend commentary updates to display "Uptrend," accurately reflecting the current market condition on the chart.

Below is a diagram that clearly displays the outcomes from testing our EA. We can see that the large quarter levels, depicted by blue solid lines, and the overshoot/undershoot levels, represented by red dashed lines, are active, evidenced by both the chart lines and the button text color. Additionally, the trend direction is active, as shown by the visible commentary on the chart. In contrast, the small quarters button appears in red, indicating that those levels are not active.
Conclusion
Having introduced the article with the aim of creating a panel with buttons that toggles the required levels on the chart with a single press, either initializing or de-initializing them, we have successfully achieved that goal. This represents another step forward in handling quarter levels according to traders' requirements. The enhancement provides a user-friendly interface: sometimes you may want to focus solely on large quarters without interference from other levels, while at other times you might prefer to display all levels. Additionally, this tool offers trend direction analytics to help you understand what’s really going on in the market based on the current price.
| Date | Tool Name | Description | Version | Updates | Notes |
|---|---|---|---|---|---|
| 01/10/24 | Chart Projector | Script to overlay the previous day's price action with ghost effect. | 1.0 | Initial Release | Tool number 1 |
| 18/11/24 | Analytical Comment | It provides previous day's information in a tabular format, as well as anticipates the future direction of the market. | 1.0 | Initial Release | Tool number 2 |
| 27/11/24 | Analytics Master | Regular Update of market metrics after every two hours | 1.01 | Second Release | Tool number 3 |
| 02/12/24 | Analytics Forecaster | Regular Update of market metrics after every two hours with telegram integration | 1.1 | Third Edition | Tool number 4 |
| 09/12/24 | Volatility Navigator | The EA analyzes market conditions using the Bollinger Bands, RSI and ATR indicators | 1.0 | Initial Release | Tool Number 5 |
| 19/12/24 | Mean Reversion Signal Reaper | Analyzes market using mean reversion strategy and provides signal | 1.0 | Initial Release | Tool number 6 |
| 9/01/25 | Signal Pulse | Multiple timeframe analyzer | 1.0 | Initial Release | Tool number 7 |
| 17/01/25 | Metrics Board | Panel with button for analysis | 1.0 | Initial Release | Tool number 8 |
| 21/01/25 | External Flow | Analytics through external libraries | 1.0 | Initial Release | Tool number 9 |
| 27/01/25 | VWAP | Volume Weighted Average Price | 1.3 | Initial Release | Tool number 10 |
| 02/02/25 | Heikin Ashi | Trend Smoothening and reversal signal identification | 1.0 | Initial Release | Tool number 11 |
| 04/02/25 | FibVWAP | Signal generation through python analysis | 1.0 | Initial Release | Tool number 12 |
| 14/02/25 | RSI DIVERGENCE | Price action versus RSI divergences | 1.0 | Initial Release | Tool number 13 |
| 17/02/25 | Parabolic Stop and Reverse (PSAR) | Automating PSAR strategy | 1.0 | Initial Release | Tool number 14 |
| 20/02/25 | Quarters Drawer Script | Drawing quarters levels on chart | 1.0 | Initial Release | Tool number 15 |
| 27/02/25 | Intrusion Detector | Detect and alert when price reaches quarters levels | 1.0 | Initial Release | Tool number 16 |
| 27/02/25 | TrendLoom Tool | Multi timeframe analytics panel | 1.0 | Initial Release | Tool number 17 |
| 11/03/25 | Quarters Board | Panel with buttons to activate or disable quarters levels | 1.0 | Initial Release | Tool number 18 |
Warning: All rights to these materials are reserved by MetaQuotes Ltd. Copying or reprinting of these materials in whole or in part is prohibited.
This article was written by a user of the site and reflects their personal views. MetaQuotes Ltd is not responsible for the accuracy of the information presented, nor for any consequences resulting from the use of the solutions, strategies or recommendations described.

- Free trading apps
- Over 8,000 signals for copying
- Economic news for exploring financial markets
You agree to website policy and terms of use