
Price Action Analysis Toolkit Development (Part 45): Creating a Dynamic Level-Analysis Panel in MQL5

Contents
- Introduction
- Why Statistical Validation Matters
- From Intuition to Evidence
- MQL5 Implementation
- Outcomes
- Conclusion
Introduction
In Part 40 of our Price Action Analysis Toolkit, we explored how statistics can uncover the hidden logic behind price behavior, identifying where the market’s mean, mode, and median levels tend to align. Through that research we learned that markets are not as chaotic as they appear; prices often rotate around statistically meaningful zones that quietly influence order flow.
The purpose of that earlier work was to pinpoint those statistical price levels and observe how often price respected or rejected them over time. That study laid the foundation for a more in-depth question: if certain prices carry more statistical weight, can we measure how the market historically reacts to any level we mark in advance?
In this new article, we take that concept several steps further by introducing the Price Level Testing EA, an automated analytical assistant that allows any trader to test any price level on demand and instantly obtain objective feedback on how price has responded to that level across hundreds or thousands of past bars. The result is a tool that acts like your personal “price‑action laboratory.” You identify the level, the EA performs the historical testing, and together they reveal the empirical pattern of touches, bounces, and breakouts that defined that zone in the past.
Why Statistical Validation Matters
When analyzing naked charts, most of us draw lines instinctively. A sharp turning point, a cluster of wicks, maybe a prior high-our eye recognizes a recurring level and our brain names it support or resistance. This intuitive skill is valuable, but it is also vulnerable to two traps:
- Recent bias – we over‑weight what happened recently, ignoring long‑term frequency.
- Confirmation bias – we remember the times a level “worked” and forget the times it didn’t.
Without backtesting, a hand‑drawn level remains an opinion. What the Price Level Testing EA offers is evidence. It transforms visual impressions into measurable data:
- When did this level really act as a barrier?
- How often did price simply pass through it?
- Was it approached from above or below more frequently?
Two Core Problems the EA Solves
Problem 1–The Guesswork in Estimating a Level’s Strength
“This looks like strong resistance… or so I think.”
- Typical trader scenario:
You observe EURUSD rejecting the 1.2000 zone twice within a few weeks. It looks convincing—long upper wicks, strong sell‑offs, clear pattern recognition. You mark 1.2000 as major resistance and plan your next trades around it. Weeks later, price begins drifting upward toward 1.2000 again. You hesitate: “Will it hold this time? Was 1.2000 really that strong, or was I just lucky the last time price turned there?”
Memory can’t answer because memory only spans a handful of examples. Without statistics, you can’t know the real frequency of touches or breakouts in the past.
How the EA resolves it:
Type 1.2000 into the dashboard and click Analyze. Within seconds, the EA scans the historical record and reports:- the number of touches near that level: when price met it but reversed;
- the number of clean breakouts: when price closed decisively through it;
- and, most importantly, whether the level behaved predominantly as support or resistance over time.
Now you are no longer relying on visual memory or assumptions. You have a quantified profile for 1.2000—an objective measure of its statistical relevance. Your next decision to trade around that level is based on data rather than hunches.
Problem 2 – Misjudging Market Bias and Breakout Reliability
“Price just broke the level—is that breakout genuine or just noise?”
- Common challenge:
Consider XAUUSD (Gold) trading around 1950.00. A sharp candle prints above that level; excitement builds—“bullish breakout!”—and traders pile in. Two hours later the candle collapses, price slips back under 1950, and stop‑losses trigger everywhere. Was that really momentum, or a false breakout typical of gold’s volatility?
If you had examined the statistical behavior of 1950 in advance, you might already know the answer.
How the EA resolves it:
Enter 1950.00, press Analyze, and the tool instantly compiles a historical breakdown:
- how many bullish breakouts above 1950 continued to rally;
- how many false breakouts reversed quickly;
- how many times 1950 served as a magnet (frequent interaction) versus a barrier (sharp rejections).
Armed with those metrics, you see clearly whether 1950 tends to attract or repel price. This transforms uncertainty into measured expectation—the kind of probabilistic insight that consistently benefits disciplined traders and algorithmic systems alike.
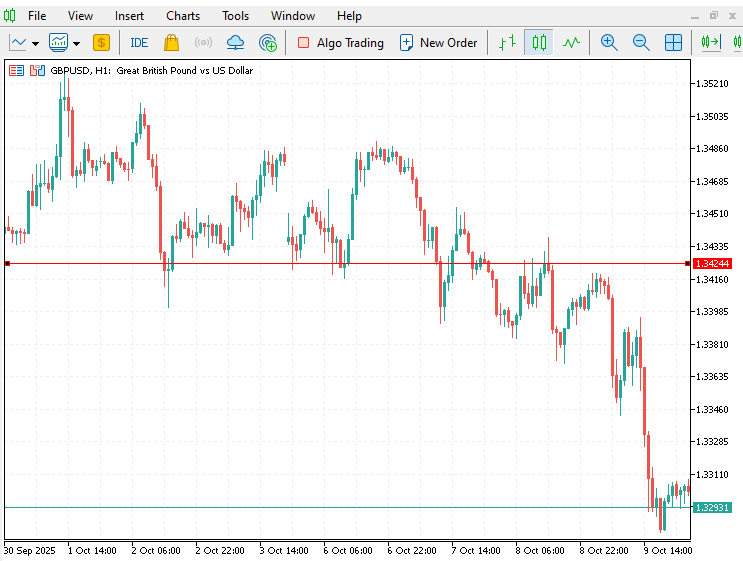
Example: Manual analysis of the 1.34244 Level (GBP/USD H1, April 2025 to October 2025)
During the period illustrated below, the Price Level Testing EA identified multiple interactions with the 1.34244 level on the GBP/USD H1 chart. Price approached the level several times and touched it within the defined tolerance range; however, it failed to achieve a confirmed breakout above the threshold. Each attempt was followed by a reversal to the downside, indicating that sellers consistently defended this zone.
This pattern of repeated contact without decisive violation suggests that, over those sessions, 1.34244 operated as a short‑term resistance level rather than support.

Between 30 September and 9 October 2025, the market traded above the 1.34244 region for several sessions, using it as an interim support line. Price repeatedly retested this area from above and initially managed to hold it, showing short‑term stability. However, as the sequence developed, buying pressure weakened, and a decisive break below 1.34244 occurred. Candles began closing beneath the level, followed by a clear continuation to the downside. This behavior confirmed that the support had collapsed and reversed its role, transforming into a new resistance zone when price attempted to retest it later.
From a structural standpoint, such a transition marks a support‑to‑resistance flip, one of the key signals that momentum has shifted in favor of sellers. The level that once contained declines became a ceiling, and subsequent moves toward it attracted supply rather than demand.
When similar reversals appear at different points in time, like those observed in earlier months, they illustrate how market sentiment evolves around recurring price levels. Studying these shifts manually underscores how valuable it is to quantify touches and breakouts systematically, as objective data can confirm what visual inspection suggests.
From Intuition to Evidence
Every trader develops an instinct for price levels that seem to attract or repel market movement. Experience builds those impressions, but intuition alone often lacks confirmation. The Price Level Testing EA formalizes that intuition. It converts a trader’s impression—“this level matters”—into verifiable, quantitative evidence.
At the surface, the EA looks deceptively simple. You enter a price level, press Analyze, and the program inspects recent history. Behind that simplicity lies a complete analytical framework that measures how price has interacted with the level over hundreds of bars. Within seconds it returns four concrete outputs:
- Count of bullish and bearish touches — how often price tested the level from each side;
- Count of confirmed breakouts — how many times price decisively crossed it;
- Probabilities describing the directional bias of those events;
- An aggregated bias reading that classifies the level as Support, Resistance, or Neutral.
What formerly required meticulous chart scrolling and subjective judgment is now processed automatically and without bias. The trader’s role evolves from spotting potential to verifying statistical significance.
Objective Event Classification
The EA employs explicit rules to ensure that every “touch” or “breakout” is validated consistently, regardless of timeframe or instrument.
1. Touch Identification
A touch represents a controlled test of the level—price approaches, makes contact, but does not close meaningfully beyond it. To filter out random price noise, the EA defines an allowable tolerance, TouchPips, expressed in pips around the chosen level. If, for any bar,
High ≥ Level − (TouchPips × pip) AND Low ≤ Level + (TouchPips × pip)
The program records that bar as a touch event. Direction is then determined by the closing price:
- Bullish touch – the candle closes above the level, indicating that buyers defended it as support.
- Bearish touch – the candle closes below the level, indicating rejection from resistance.
This distinction allows the algorithm to identify which side of the market has historically respected the level more frequently.
2. Breakout Validation
A breakout is confirmed only when the close exceeds the level by a defined margin, BreakPips, ensuring that temporary spikes are excluded.
Bullish breakout: the previous bar closed below the level and the current bar closed sufficiently above the level (more than BreakPips worth of pips).
PrevClose<LevelANDClose>Level+(BreakPips×pip)Bearish breakout: the previous bar closed above the level and the current bar closed sufficiently below the level (more than BreakPips worth of pips).
PrevClose>LevelANDClose<Level−(BreakPips×pip)
The use of closing prices and threshold displacement reproduces how professional analysts judge structural transitions rather than transient volatility.
From Counts to Empirical Probabilities
Once all bars within BarsToCheck have been examined, the EA aggregates results into four raw counts:
| Event Type | Bullish | Bearish |
|---|---|---|
| Touches | bull_touch | bear_touch |
| Breakouts | bull_break | bear_break |
These counts are transformed into empirical probabilities, direct observations of frequency within the selected historical sample.
Empirical Probabilities:
- Bullish Touch Probability
![]()
- Bearish Touch Probability
![]()
They are not forecasts or theoretical values; they represent the realized behavior of the market over the chosen window.
Finally, an overall bias is inferred:
- If both bullish touch and breakout probabilities dominate: the level has primarily acted as Support (Bullish).
- If both bearish metrics dominate: the level has functioned as Resistance (Bearish).
- If neither side is conclusive: the level is deemed Neutral.
This interpretation combines the precision of numeric data with the intuition of classical support‑resistance analysis.
MQL5 Implementation
1. Starting with Metadata and User Inputs
We begin by introducing the EA with some metadata at the top of the script. This includes the EA’s name (“Price Level Testing EA”), the copyright information, and a link to the author’s MQL5 profile. These lines don’t affect the functionality but help identify the EA and its origin. Following this, we use the #propertydirective to set the version number, copyright reference, and strict compilation mode. Enabling strict mode ensures that we write safer and more robust code by enforcing strict type-checking.
#property copyright "https://www.mql5.com/en/users/lynnchris"
#property version   "1.0"
#property strict

input int    BarsToCheck = 500;
input double TouchPips   = 10;
input double BreakPips   = 20;
input color  TextColor   = clrYellow;
Next, we define the input parameters that allow users to customize how the EA behaves. We specify how many historical bars we want to analyze (BarsToCheck), how close the price must come to a level to count as a “touch” (TouchPips), and how far it must go beyond that level to qualify as a “breakout” (BreakPips). We also let the user choose a color for the output text (TextColor). These inputs give us flexibility and control over the analysis, letting us tailor the behavior to different symbols, timeframes, or trading strategies.
2. Defining UI Constants and Layout Structure
Moving forward, we set up a series of constants using #define directives. These constants help us manage and organize the user interface (UI) elements we’ll later display on the chart. By giving each object a unique name or prefix—such as EDIT_NAME for the text input field, BTN_NAME for the analyze button, and MARK_PREFIX for the markers—we ensure that we can easily reference and manage these objects throughout the script. This is especially useful when we need to delete or update them dynamically.
#define EDIT_NAME    "UI_EDIT_LEVEL"
#define BTN_NAME     "UI_BTN_ANALYZE"
#define BOX_NAME     "UI_BOX"
#define HDR_NAME     "UI_HDR"
#define INSTR_NAME   "UI_INSTR"
#define MARK_PREFIX  "AN_"
#define LINE_PREFIX  "UI_LINE_"

#define UI_CORNER    CORNER_LEFT_UPPER
int ui_base_x = 6;
int ui_base_y = 18;
int ui_row_spacing = 17;
int ui_font_size = 9;
We also define layout-related variables like ui_base_x and ui_base_y to set the position of our UI elements on the screen. We can think of this as laying the foundation for where everything will go. The spacing between rows (ui_row_spacing) and the font size (ui_font_size) help us control the readability and alignment of our UI components. With these constants and layout settings in place, we’re ready to build a consistent and structured interface that looks clean and professional.
3. Building the User Interface in OnInit()
Now that we’ve defined our UI structure, we move into the OnInit() function, which runs when the EA is first added to a chart. Here, we start creating the graphical elements that the user will interact with. First, we create an editable text field using ObjectCreate() and name it according to the EDIT_NAME constant. We style it with appropriate dimensions, font size, and colors so that it’s both functional and visually appealing. This input box is where the user will enter the price level they want to analyze.
SafeDeleteObj(EDIT_NAME);
ObjectCreate(0, EDIT_NAME, OBJ_EDIT, 0, 0, 0);
ObjectSetInteger(0, EDIT_NAME, OBJPROP_CORNER, UI_CORNER);
ObjectSetInteger(0, EDIT_NAME, OBJPROP_XDISTANCE, ui_base_x);
ObjectSetInteger(0, EDIT_NAME, OBJPROP_YDISTANCE, ui_base_y);
ObjectSetInteger(0, EDIT_NAME, OBJPROP_XSIZE, 100);
ObjectSetInteger(0, EDIT_NAME, OBJPROP_BGCOLOR, clrBlack);
ObjectSetInteger(0, EDIT_NAME, OBJPROP_COLOR, clrLime);
ObjectSetInteger(0, EDIT_NAME, OBJPROP_FONTSIZE, ui_font_size);
ObjectSetString(0, EDIT_NAME, OBJPROP_TEXT, "1.2000");
Next, we place a button labeled “Analyze” right beside the input field. When clicked, this button will trigger our analysis. We position it carefully using the layout constants we defined earlier to ensure it lines up with the input field. Then, we add a label that acts as an instruction—prompting the user to “Press Analyze”—and place it just to the right of the button. Finally, we add a header label that displays the title “Touch & Breakout Stats” to give context to the entire interface. By the time OnInit() finishes, we’ve built a simple but interactive UI that invites users to begin their analysis with just a few clicks.
4. Cleaning Up with OnDeinit()
After setting up the interface, we also prepare for cleanup. The OnDeinit() function is executed when we remove the EA from the chart or reload it. In this step, we make sure to remove all objects that the EA created, leaving the chart clean and free from clutter. We call DeletePrefixObjects() with the appropriate prefixes to remove all markers and labels that were dynamically created during analysis.
void OnDeinit(const int reason)
{
   DeletePrefixObjects(MARK_PREFIX);
   DeletePrefixObjects(LINE_PREFIX);
   SafeDeleteObj(EDIT_NAME);
   SafeDeleteObj(BTN_NAME);
   SafeDeleteObj(BOX_NAME);
   SafeDeleteObj(HDR_NAME);
   SafeDeleteObj(INSTR_NAME);
}
We then use SafeDeleteObj() to individually remove the static UI elements—the input box, button, header, instruction label, and background box. This ensures we don’t leave any objects behind on the chart. By handling cleanup properly, we make it safe and convenient for users to reload or remove the EA without worrying about graphical leftovers interfering with other tools or indicators.
5. Responding to User Actions in OnChartEvent()
With our UI in place and cleanup procedures ready, we now define how the EA responds when the user interacts with the chart. The OnChartEvent() function listens for events like mouse clicks. Specifically, we check whether the “Analyze” button was clicked by comparing the clicked object’s name to BTN_NAME.
void OnChartEvent(const int id,const long &l,const double &d,const string &s)
{
   if(id==CHARTEVENT_OBJECT_CLICK && s==BTN_NAME)
   {
      string textlevel = ObjectGetString(0, EDIT_NAME, OBJPROP_TEXT);
      double level = StringToDouble(textlevel);
      if(level <= 0)
      {
         Alert("Enter numeric level");
         return;
      }
      DeletePrefixObjects(MARK_PREFIX);
      DeletePrefixObjects(LINE_PREFIX);
      RunAnalysis(level);
   }
}
When the button is clicked, we retrieve the text value from the input field, convert it to a numeric value using StringToDouble(), and validate that it’s greater than zero. If the value is invalid, we show an alert prompting the user to enter a valid numeric level. If it’s valid, we proceed by clearing any previous markers and analysis results using DeletePrefixObjects(). Finally, we call RunAnalysis() with the user-defined level to begin the core analysis. This step turns user input into action and sets the stage for meaningful data visualization.
6. Preparing for Analysis in RunAnalysis()
Once we’re inside the RunAnalysis() function, we start by preparing all the variables and thresholds we’ll need. We calculate the pip value for the current symbol based on its digits, which helps us define precise thresholds for what counts as a “touch” or a “break.” We then determine how many bars we can safely analyze, ensuring we stay within the available history.
double point = SymbolInfoDouble(_Symbol,SYMBOL_POINT);
double pip   = (SymbolInfoInteger(_Symbol,SYMBOL_DIGITS) > 3 ? 0.0001 : 0.01);
double touch_th = TouchPips * pip;
double break_th = BreakPips * pip;
We also initialize counters to keep track of four types of events: bullish touches (when price touches the level from above), bearish touches (from below), bullish breakouts (price breaks upwards past the level), and bearish breakouts (price breaks downwards). These counters will accumulate data as we scan each bar, giving us a snapshot of how price has historically interacted with the specified level.
7. Scanning Historical Bars for Events
Now we dive into the core loop where we scan each historical bar to detect touches and breakouts. For each bar, we retrieve the high, low, close, and previous close prices, as well as the time. We then check whether the high and low prices intersect with the level within the touch threshold. If they do, we classify it as a touch and determine its direction based on the close price.
for(int i=0; i<bars_to_check; i++)
{
   double hi = iHigh(_Symbol,_Period,i);
   double lo = iLow(_Symbol,_Period,i);
   double cl = iClose(_Symbol,_Period,i);
   double prev = iClose(_Symbol,_Period,i+1);
   datetime t = iTime(_Symbol,_Period,i);

   if(hi >= level - touch_th && lo <= level + touch_th)
   {
      if(cl < level)
         bull_touch++, DrawMarker(MARK_PREFIX+"T_BU_"+string(i), t, level + 5*point, clrLime, 241);
      else if(cl > level)
         bear_touch++, DrawMarker(MARK_PREFIX+"T_BE_"+string(i), t, level - 5*point, clrRed, 242);
   }

   if(prev < level && cl > level + break_th)
      bull_break++, DrawMarker(MARK_PREFIX+"B_BU_"+string(i), t, cl + 10*point, clrLime, 217);
   if(prev > level && cl < level - break_th)
      bear_break++, DrawMarker(MARK_PREFIX+"B_BE_"+string(i), t, cl - 10*point, clrRed, 218);
}
If the close is below the level, it’s a bullish touch, and we record it by incrementing the counter and calling DrawMarker() to place a green arrow on the chart. If it’s above the level, it’s a bearish touch, marked with a red arrow. We perform similar checks for breakouts: if the previous close is below the level and the current close is significantly above it (based on BreakPips), it’s a bullish breakout. If the inverse is true, it’s a bearish breakout. Each breakout is also marked visually on the chart to help us identify patterns at a glance.
8. Calculating Statistics and Determining Market Bias
After scanning all the bars, we calculate the total touches and breakouts, and then compute the percentage of bullish versus bearish occurrences in each category. These statistics help us understand how price has behaved relative to the level. We use safe division to avoid errors when no events are found.
double tot_touch = (double)(bull_touch + bear_touch);
double tot_break = (double)(bull_break + bear_break);
double pBT = (tot_touch > 0.0 ? 100.0 * bull_touch / tot_touch : 0.0);
double pRT = (tot_touch > 0.0 ? 100.0 * bear_touch / tot_touch : 0.0);
double pBB = (tot_break > 0.0 ? 100.0 * bull_break / tot_break : 0.0);
double pRB = (tot_break > 0.0 ? 100.0 * bear_break / tot_break : 0.0);

string bias = "Neutral";
if(pBT > pRT && pBB > pRB)
   bias = "Support (Bullish)";
else if(pRT > pBT && pRB > pBB)
   bias = "Resistance (Bearish)";
Based on the dominance of bullish or bearish activity, we determine the overall bias. If bullish touches and breakouts dominate, we label the level as “Support (Bullish)”. If bearish events dominate, it becomes “Resistance (Bearish)”. If there’s no clear dominance, we classify it as “Neutral.” This helps traders quickly identify whether the level is likely to act as a floor or ceiling in the market.
9. Composing the Results Panel
With our statistics ready, we start constructing a summary panel to display the results on the chart. We use an array of strings where each element represents a line in the panel. This includes information like the symbol name, timeframe, level tested, number of touches and breakouts, their respective percentages, and the overall bias.
ArrayResize(lines, 7);
lines[0] = StringFormat("Symbol: %s    TF: %s", _Symbol, EnumToString(_Period));
lines[1] = StringFormat("Level: %.*f    Bars Checked: %d", (int)SymbolInfoInteger(_Symbol,SYMBOL_DIGITS), level, bars_to_check);
lines[2] = " ";
lines[3] = StringFormat("Touches  ↑ %3d   ↓ %3d    P↑ %4.1f%%   P↓ %4.1f%%", bull_touch, bear_touch, pBT, pRT);
lines[4] = StringFormat("Breaks   ↑ %3d   ↓ %3d    P↑ %4.1f%%   P↓ %4.1f%%", bull_break, bear_break, pBB, pRB);
lines[5] = " ";
lines[6] = StringFormat("Overall Bias: %s", bias);
We calculate the maximum line length so we can size the panel correctly. This ensures that the text fits neatly within the background box without overlapping or being cut off. By dynamically building the content, we ensure that the panel remains flexible and adapts to different inputs and symbols.
10. Drawing the Visual Output on the Chart
Before we draw the new panel, we remove any existing output to keep the chart clean. Then, we create a rectangle label object to serve as the background box for our analysis results. We size it based on our earlier calculations and position it below the input UI.
ObjectCreate(0, BOX_NAME, OBJ_RECTANGLE_LABEL, 0, 0, 0);
ObjectSetInteger(0, BOX_NAME, OBJPROP_XDISTANCE, baseX - 6);
ObjectSetInteger(0, BOX_NAME, OBJPROP_YDISTANCE, baseY - 8);
ObjectSetInteger(0, BOX_NAME, OBJPROP_XSIZE, boxWidth + 12);
ObjectSetInteger(0, BOX_NAME, OBJPROP_YSIZE, boxHeight + 12);
ObjectSetInteger(0, BOX_NAME, OBJPROP_BGCOLOR, clrDarkSlateGray);

for(int i=0; i<7; i++)
{
   string nm = LINE_PREFIX + IntegerToString(i);
   ObjectCreate(0, nm, OBJ_LABEL, 0, 0, 0);
   ObjectSetString(0, nm, OBJPROP_TEXT, lines[i]);
}
Next, we loop through our array of result lines and create a separate label for each one. We style the first couple of lines in white to make them look like headers and use the user-defined TextColor for the rest. Each label is carefully positioned to create a neat, vertically stacked panel. This output gives traders a clear, on-chart summary of the analysis, improving usability and decision-making.
11. Logging the Report to the Terminal
In addition to displaying the results on the chart, we also print the entire report to the terminal using Print(). This allows users to review the analysis in MetaTrader’s Experts or Journal tab. It also provides a persistent log, which can be useful for tracking, debugging, or analyzing multiple levels over time. By providing both visual and textual outputs, we cater to different user preferences and ensure no information is lost.
string report = "";
for(int i=0; i<ArraySize(lines); i++)
{
   report += lines[i];
   if(i < ArraySize(lines)-1) report += "\n";
}
Print(report);
12. Drawing Markers with DrawMarker()
This utility function helps us place visual markers on the chart when we detect a touch or breakout. It first checks if a marker with the same name already exists and deletes it to avoid duplication. Then, it creates a new OBJ_ARROW object at the specified time and price and styles it with the appropriate color and arrow code.
void DrawMarker(string name, datetime t, double price, color clr, int arrow)
{
   if(ObjectFind(0, name) >= 0)
      ObjectDelete(0, name);
   ObjectCreate(0, name, OBJ_ARROW, 0, t, price);
   ObjectSetInteger(0, name, OBJPROP_COLOR, clr);
   ObjectSetInteger(0, name, OBJPROP_ARROWCODE, arrow);
}
These markers serve as visual breadcrumbs, showing exactly where price interacted with the level. They make it easy for traders to correlate the statistical data with actual price action and candles on the chart, providing a powerful visual reinforcement of the analysis.
13. Safely Deleting Objects with SafeDeleteObj()
This helper function checks whether a chart object with the given name exists, and if so, deletes it. It prevents errors from trying to delete objects that may not be present and helps us manage our UI and markers safely. We use this function repeatedly throughout the EA to clean up old objects before creating new ones.
void SafeDeleteObj(string name)
{
   if(ObjectFind(0, name) >= 0)
      ObjectDelete(0, name);
}
14. Deleting Objects by Prefix with DeletePrefixObjects()
Finally, we use DeletePrefixObjects() to delete groups of objects that share a naming convention. This is especially useful for cleaning up dynamically generated markers and labels from prior analyses. By looping through all chart objects and identifying those that start with a specific prefix, we ensure that only the EA’s objects are deleted—leaving other chart elements untouched. This keeps our operations precise and prevents accidental removal of unrelated objects.
void DeletePrefixObjects(string prefix)
{
   int total = ObjectsTotal(0);
   for(int i = total - 1; i >= 0; i--)
   {
      string nm = ObjectName(0, i);
      if(StringFind(nm, prefix) == 0)
         ObjectDelete(0, nm);
   }
}
Outcomes
In this section, we’re focusing on testing price levels and analyzing the outcomes. Below are the steps to follow when testing any price level of your choice after dragging the EA to the MetaTrader 5 chart.
1. Type the exact numeric price into the input box — for example:
- 1.2000 for EURUSD
- 1950.25 for Gold
- 80.50 for an index
Be sure to use the same decimal precision as shown on the chart.
2. Then press Analyze.
- The EA will scan the configured number of past bars, mark every historical touch and breakout of that level on the chart, and display the results as per-line statistics on the dashboard.
3. What you’ll see on the dashboard:
- Total number of touches
- Total number of breakouts
- Directional split (up/down)
- Overall directional bias
Arrow markers will appear on the chart to indicate where touches and breakouts occurred. This gives you clear, visual, and statistical insight into how price has behaved around your selected level.
- Testing on EURUSD H1
The animation above illustrates the full functionality of the Price Level Testing EA in action. In this demonstration, a specific price level is manually entered into the input field of the EA’s on‑chart interface. Once the Analyze button is pressed, the system immediately initiates the level‑testing routine. Within moments, the program evaluates the selected level across historical data, automatically displaying the results on the dashboard. Simultaneously, the chart is dynamically annotated with arrows marking each touch (price reaction near the level) and breakout (decisive movement through it). These visual markers allow the user to verify each statistical event directly against the raw price action.
As seen in the results, the analyzed level is classified as neutral, indicating that, over the tested sample of bars, price demonstrated a balanced mixture of bullish and bearish interactions. In practical terms, this means the level has not consistently behaved as either a support or resistance zone during the observed period. The neutrality itself can be informative, suggesting an equilibrium area where both buying and selling pressures have previously offset each other.
Conclusion
The Price Level Testing EA bridges the gap between visual intuition and quantitative verification—transforming the art of level recognition into a process backed by empirical testing.
Where traders once relied solely on chart‑based impressions, this tool now provides:
- Objective measurement of how frequently a level has acted as support or resistance;
- Consistent validation of touches and breakouts through pip‑based thresholds that eliminate interpretive bias;
- Empirical probabilities that describe market behavior as it actually unfolded;
- And a transparent visual record, allowing users to see precisely where and when those events occurred.
By collecting tangible statistics—bullish versus bearish touches, proportion of confirmed breakouts, and directional bias—the EA transforms historic price action into actionable evidence. It allows traders to quantify structure, not merely observe it. The key insight is simple yet profound:
Historical behavior carries information
A level that has repeatedly attracted reaction in the past has demonstrated structural relevance in market organization. Knowing this numerically, not just visually, enables smarter decision‑making: improved confidence in trade planning, more efficient back‑testing, and the opportunity to integrate objective data into automated or discretionary frameworks. Beyond immediate use, the tool opens new research pathways. Its outputs can be aggregated across instruments and timeframes to study level reliability, market regime changes, or even to feed into machine‑learning models as factual features.
Ultimately, the Price Level Testing EA is more than a convenience; it represents a methodological shift. It empowers traders to move past anecdotal reasoning and towards data‑driven interpretation of market structure—where hypotheses are testable, results are reproducible, and intuition is supported, not replaced, by evidence.
Warning: All rights to these materials are reserved by MetaQuotes Ltd. Copying or reprinting of these materials in whole or in part is prohibited.
This article was written by a user of the site and reflects their personal views. MetaQuotes Ltd is not responsible for the accuracy of the information presented, nor for any consequences resulting from the use of the solutions, strategies or recommendations described.

- Free trading apps
- Over 8,000 signals for copying
- Economic news for exploring financial markets
You agree to website policy and terms of use