Articles on data analysis and statistics in MQL5
Articles on mathematical models and laws of probability are interesting for many traders. Mathematics is the basis of technical indicators, and statistics is required to analyze trading results and develop strategies.
Read about the fuzzy logic, digital filters, market profile, Kohonen maps, neural gas and many other tools that can be used for trading.
Add a new article

You are missing trading opportunities:
- Free trading apps
- Over 8,000 signals for copying
- Economic news for exploring financial markets
Registration
Log in
You agree to website policy and terms of use
If you do not have an account, please register

Measuring Indicator Information
Machine learning has become a popular method for strategy development. Whilst there has been more emphasis on maximizing profitability and prediction accuracy , the importance of processing the data used to build predictive models has not received a lot of attention. In this article we consider using the concept of entropy to evaluate the appropriateness of indicators to be used in predictive model building as documented in the book Testing and Tuning Market Trading Systems by Timothy Masters.

Price Action Analysis Toolkit Development (Part 65): Building an MQL5 System to Monitor and Analyze Manually Drawn Fibonacci Levels
The Fibonacci retracement tool is an essential component of price action analysis, providing critical levels for potential market reactions. However, its effectiveness is often limited by the need for continuous human monitoring, which can lead to missed setups. In this part of our series, we introduce a tool that synchronizes and actively monitors manually drawn Fibonacci levels using MQL5, combining discretionary insight with automated oversight.

Developing a Replay System — Market simulation (Part 20): FOREX (I)
The initial goal of this article is not to cover all the possibilities of Forex trading, but rather to adapt the system so that you can perform at least one market replay. We'll leave simulation for another moment. However, if we don't have ticks and only bars, with a little effort we can simulate possible trades that could happen in the Forex market. This will be the case until we look at how to adapt the simulator. An attempt to work with Forex data inside the system without modifying it leads to a range of errors.

ALGLIB library optimization methods (Part II)
In this article, we will continue to study the remaining optimization methods from the ALGLIB library, paying special attention to their testing on complex multidimensional functions. This will allow us not only to evaluate the efficiency of each algorithm, but also to identify their strengths and weaknesses in different conditions.

SP500 Trading Strategy in MQL5 For Beginners
Discover how to leverage MQL5 to forecast the S&P 500 with precision, blending in classical technical analysis for added stability and combining algorithms with time-tested principles for robust market insights.

Creating Custom Indicators in MQL5 (Part 2): Building a Gauge-Style RSI Display with Canvas and Needle Mechanics
In this article, we develop a gauge-style RSI indicator in MQL5 that visualizes Relative Strength Index values on a circular scale with a dynamic needle, color-coded ranges for overbought and oversold levels, and customizable legends. We utilize the Canvas class to draw elements like arcs, ticks, and pies, ensuring smooth updates on new RSI data.

Price Action Analysis Toolkit Development (Part 5): Volatility Navigator EA
Determining market direction can be straightforward, but knowing when to enter can be challenging. As part of the series titled "Price Action Analysis Toolkit Development", I am excited to introduce another tool that provides entry points, take profit levels, and stop loss placements. To achieve this, we have utilized the MQL5 programming language. Let’s delve into each step in this article.

Developing a Replay System (Part 38): Paving the Path (II)
Many people who consider themselves MQL5 programmers do not have the basic knowledge that I will outline in this article. Many people consider MQL5 to be a limited tool, but the actual reason is that they do not have the required knowledge. So, if you don't know something, don't be ashamed of it. It's better to feel ashamed for not asking. Simply forcing MetaTrader 5 to disable indicator duplication in no way ensures two-way communication between the indicator and the Expert Advisor. We are still very far from this, but the fact that the indicator is not duplicated on the chart gives us some confidence.

Population optimization algorithms: Invasive Weed Optimization (IWO)
The amazing ability of weeds to survive in a wide variety of conditions has become the idea for a powerful optimization algorithm. IWO is one of the best algorithms among the previously reviewed ones.

From Novice to Expert: Reporting EA — Setting up the work flow
Brokerages often provide trading account reports at regular intervals, based on a predefined schedule. These firms, through their API technologies, have access to your account activity and trading history, allowing them to generate performance reports on your behalf. Similarly, the MetaTrader 5 terminal stores detailed records of your trading activity, which can be leveraged using MQL5 to create fully customized reports and define personalized delivery methods.

Automating Trading Strategies in MQL5 (Part 39): Statistical Mean Reversion with Confidence Intervals and Dashboard
In this article, we develop an MQL5 Expert Advisor for statistical mean reversion trading, calculating moments like mean, variance, skewness, kurtosis, and Jarque-Bera statistics over a specified period to identify non-normal distributions and generate buy/sell signals based on confidence intervals with adaptive thresholds

Price Action Analysis Toolkit Development (Part 12): External Flow (III) TrendMap
The flow of the market is determined by the forces between bulls and bears. There are specific levels that the market respects due to the forces acting on them. Fibonacci and VWAP levels are especially powerful in influencing market behavior. Join me in this article as we explore a strategy based on VWAP and Fibonacci levels for signal generation.

Population optimization algorithms: Monkey algorithm (MA)
In this article, I will consider the Monkey Algorithm (MA) optimization algorithm. The ability of these animals to overcome difficult obstacles and get to the most inaccessible tree tops formed the basis of the idea of the MA algorithm.

Build Self Optimizing Expert Advisors With MQL5 And Python (Part II): Tuning Deep Neural Networks
Machine learning models come with various adjustable parameters. In this series of articles, we will explore how to customize your AI models to fit your specific market using the SciPy library.

Neural networks made easy (Part 18): Association rules
As a continuation of this series of articles, let's consider another type of problems within unsupervised learning methods: mining association rules. This problem type was first used in retail, namely supermarkets, to analyze market baskets. In this article, we will talk about the applicability of such algorithms in trading.

Neural networks made easy (Part 22): Unsupervised learning of recurrent models
We continue to study unsupervised learning algorithms. This time I suggest that we discuss the features of autoencoders when applied to recurrent model training.

Developing a Replay System — Market simulation (Part 04): adjusting the settings (II)
Let's continue creating the system and controls. Without the ability to control the service, it is difficult to move forward and improve the system.
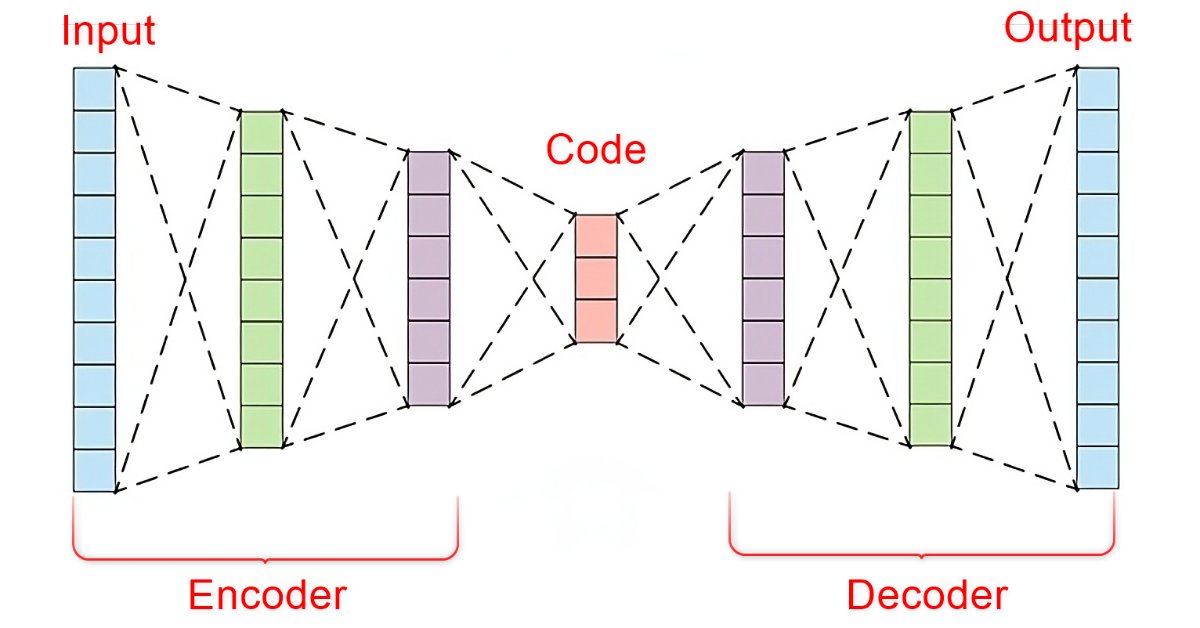
Data Science and Machine Learning (Part 22): Leveraging Autoencoders Neural Networks for Smarter Trades by Moving from Noise to Signal
In the fast-paced world of financial markets, separating meaningful signals from the noise is crucial for successful trading. By employing sophisticated neural network architectures, autoencoders excel at uncovering hidden patterns within market data, transforming noisy input into actionable insights. In this article, we explore how autoencoders are revolutionizing trading practices, offering traders a powerful tool to enhance decision-making and gain a competitive edge in today's dynamic markets.

Circle Search Algorithm (CSA)
The article presents a new metaheuristic optimization Circle Search Algorithm (CSA) based on the geometric properties of a circle. The algorithm uses the principle of moving points along tangents to find the optimal solution, combining the phases of global exploration and local exploitation.

Overcoming ONNX Integration Challenges
ONNX is a great tool for integrating complex AI code between different platforms, it is a great tool that comes with some challenges that one must address to get the most out of it, In this article we discuss the common issues you might face and how to mitigate them.

Data label for time series mining (Part 3):Example for using label data
This series of articles introduces several time series labeling methods, which can create data that meets most artificial intelligence models, and targeted data labeling according to needs can make the trained artificial intelligence model more in line with the expected design, improve the accuracy of our model, and even help the model make a qualitative leap!

Price Action Analysis Toolkit Development (Part 29): Boom and Crash Interceptor EA
Discover how the Boom & Crash Interceptor EA transforms your charts into a proactive alert system-spotting explosive moves with lightning-fast velocity scans, volatility surge checks, trend confirmation, and pivot-zone filters. With crisp green “Boom” and red “Crash” arrows guiding your every decision, this tool cuts through the noise and lets you capitalize on market spikes like never before. Dive in to see how it works and why it can become your next essential edge.

MQL5 Wizard techniques you should know (Part 04): Linear Discriminant Analysis
Todays trader is a philomath who is almost always looking up new ideas, trying them out, choosing to modify them or discard them; an exploratory process that should cost a fair amount of diligence. These series of articles will proposition that the MQL5 wizard should be a mainstay for traders in this effort.

MetaTrader 5 and the MQL5 Economic Calendar: How to Turn News into a Reproducible Trading System
The article presents a systematic approach to news trading in MetaTrader 5 using the built-in economic calendar: data structure, API functions, time synchronization rules, and event filtering. Methods of caching and incremental updating without overloading the server are described. The article also provides a working mechanism for exporting history to an .EX5 resource for deterministic testing using the same algorithm.

Data Science and Machine Learning (Part 18): The battle of Mastering Market Complexity, Truncated SVD Versus NMF
Truncated Singular Value Decomposition (SVD) and Non-Negative Matrix Factorization (NMF) are dimensionality reduction techniques. They both play significant roles in shaping data-driven trading strategies. Discover the art of dimensionality reduction, unraveling insights, and optimizing quantitative analyses for an informed approach to navigating the intricacies of financial markets.

Data Science and ML (Part 26): The Ultimate Battle in Time Series Forecasting — LSTM vs GRU Neural Networks
In the previous article, we discussed a simple RNN which despite its inability to understand long-term dependencies in the data, was able to make a profitable strategy. In this article, we are discussing both the Long-Short Term Memory(LSTM) and the Gated Recurrent Unit(GRU). These two were introduced to overcome the shortcomings of a simple RNN and to outsmart it.

Price Action Analysis Toolkit Development (Part 50): Developing the RVGI, CCI and SMA Confluence Engine in MQL5
Many traders struggle to identify genuine reversals. This article presents an EA that combines RVGI, CCI (±100), and an SMA trend filter to produce a single clear reversal signal. The EA includes an on-chart panel, configurable alerts, and the full source file for immediate download and testing.

Developing a Replay System — Market simulation (Part 15): Birth of the SIMULATOR (V) - RANDOM WALK
In this article we will complete the development of a simulator for our system. The main goal here will be to configure the algorithm discussed in the previous article. This algorithm aims to create a RANDOM WALK movement. Therefore, to understand today's material, it is necessary to understand the content of previous articles. If you have not followed the development of the simulator, I advise you to read this sequence from the very beginning. Otherwise, you may get confused about what will be explained here.

Neural networks made easy (Part 17): Dimensionality reduction
In this part we continue discussing Artificial Intelligence models. Namely, we study unsupervised learning algorithms. We have already discussed one of the clustering algorithms. In this article, I am sharing a variant of solving problems related to dimensionality reduction.

MQL5 Trading Tools (Part 8): Enhanced Informational Dashboard with Draggable and Minimizable Features
In this article, we develop an enhanced informational dashboard that upgrades the previous part by adding draggable and minimizable features for improved user interaction, while maintaining real-time monitoring of multi-symbol positions and account metrics.

Quantitative analysis in MQL5: Implementing a promising algorithm
We will analyze the question of what quantitative analysis is and how it is used by major players. We will create one of the quantitative analysis algorithms in the MQL5 language.

MQL5 Wizard Techniques you should know (Part 25): Multi-Timeframe Testing and Trading
Strategies that are based on multiple time frames cannot be tested in wizard assembled Expert Advisors by default because of the MQL5 code architecture used in the assembly classes. We explore a possible work around this limitation for strategies that look to use multiple time frames in a case study with the quadratic moving average.

Discrete Hartley transform
In this article, we will consider one of the methods of spectral analysis and signal processing - the discrete Hartley transform. It allows filtering signals, analyzing their spectrum and much more. The capabilities of DHT are no less than those of the discrete Fourier transform. However, unlike DFT, DHT uses only real numbers, which makes it more convenient for implementation in practice, and the results of its application are more visual.

Population optimization algorithms: Shuffled Frog-Leaping algorithm (SFL)
The article presents a detailed description of the shuffled frog-leaping (SFL) algorithm and its capabilities in solving optimization problems. The SFL algorithm is inspired by the behavior of frogs in their natural environment and offers a new approach to function optimization. The SFL algorithm is an efficient and flexible tool capable of processing a variety of data types and achieving optimal solutions.

Neuro-symbolic systems in algorithmic trading: Combining symbolic rules and neural networks
The article describes the experience of developing a hybrid trading system that combines classical technical analysis with neural networks. The author provides a detailed analysis of the system architecture from basic pattern analysis and neural network structure to the mechanisms behind trading decisions, and shares real code and practical observations.

Analyzing all price movement options on the IBM quantum computer
We will use a quantum computer from IBM to discover all price movement options. Sounds like science fiction? Welcome to the world of quantum computing for trading!

William Gann methods (Part III): Does Astrology Work?
Do the positions of planets and stars affect financial markets? Let's arm ourselves with statistics and big data, and embark on an exciting journey into the world where stars and stock charts intersect.

Population optimization algorithms: ElectroMagnetism-like algorithm (ЕМ)
The article describes the principles, methods and possibilities of using the Electromagnetic Algorithm in various optimization problems. The EM algorithm is an efficient optimization tool capable of working with large amounts of data and multidimensional functions.

From Novice to Expert: Statistical Validation of Supply and Demand Zones
Today, we uncover the often overlooked statistical foundation behind supply and demand trading strategies. By combining MQL5 with Python through a Jupyter Notebook workflow, we conduct a structured, data-driven investigation aimed at transforming visual market assumptions into measurable insights. This article covers the complete research process, including data collection, Python-based statistical analysis, algorithm design, testing, and final conclusions. To explore the methodology and findings in detail, read the full article.

Creating 3D bars based on time, price and volume
The article dwells on multivariate 3D price charts and their creation. We will also consider how 3D bars predict price reversals, and how Python and MetaTrader 5 allow us to plot these volume bars in real time.