Price Action Analysis Toolkit Development (Part 23): Currency Strength Meter

Contents
Introduction
Imagine you are at a car race. Each vehicle is unique, and you can't simply guess which one is the fastest or slowest. Instead, you observe lap times, assess acceleration, test braking performance, and evaluate each model individually. Only after thoroughly analyzing each car on its own do you compare them to determine overall performance.
Currencies function similarly. This EA inspects every trading pair in which a currency appears. For example, for USD, it examines USDJPY, EURUSD, GBPUSD, USDCHF, and others. It measures how much each pair has moved over different timeframes, initially over M15, then H1, and finally H4. These lookback periods are specified by the parameters Lookback_M15, Lookback_H1, and Lookback_H4.
If the currency in question is the quote currency in a pair, the EA inverts that change to accurately reflect its strength. After calculating these movements across all relevant pairs, it averages the results into a single strength value for each currency. The EA updates these calculations every few seconds, as specified by the Update_Seconds parameter. It then redraws the dashboard to display the current strengths, logs which currencies are strong, weak, or neutral, and updates visual curves showing your account's equity and drawdown.
In this article, we will develop an MQL5 tool that measures currency strength by analyzing each symbol’s performance across multiple pairs. This approach enables you to identify the strongest and weakest currencies reliably, empowering you to trade with greater confidence.
Understanding the strategy
The EA’s main job is to measure how strong or weak a single currency is by looking at all the pairs it appears in, across multiple timeframes. To do this, we follow these steps to calculate each currency’s strength across its pairs and timeframes.
Select Relevant Pairs
For each of the eight major currencies, gather all the currency-pairs in which it appears (e.g. USD in USDJPY, EURUSD, GBPUSD, USDCHF).
Compute %-Change
On your chosen timeframe (e.g. M15, H1, H4), calculate the percentage move over the lookback period for each pair:
Normalize Sign
If the currency you’re measuring is the quote (second) currency in the pair, invert the sign of that %change, so that a stronger quote currency always shows as positive strength.
Average Across Pairs
Take the (signed) %change values for all its pairs and compute a simple average. That gives you a single “strength score” for the currency on that timeframe.
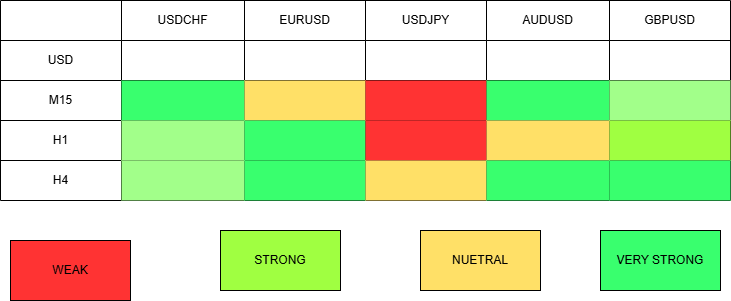
The diagram above illustrates our process using USD as an example. We measure USD strength in every pair where it appears, across multiple timeframes. This allows us to identify in which timeframe USD is strongest or weakest.
Code Breakdown
The EA starts with defining essential properties: the copyright, link, version, and strict compilation mode. These directives help identify the EA and ensure it adheres to the expected standards within the MetaTrader environment. It then includes the SymbolInfo.mqh library, which provides functions to manage and query symbol information, essential for selecting, enabling, and retrieving data from multiple currency pairs dynamically. This inclusion is crucial because the EA needs to access data for various symbols that may not be enabled by default, ensuring the script can operate smoothly across multiple pairs.
#property copyright "Copyright 2025, MetaQuotes Ltd."
#property link      "https://www.mql5.com/en/users/lynnchris"
#property version   "1.0"
#property strict

#include <Trade\SymbolInfo.mqh>
Next, the code defines several input parameters, such as Lookback_M15, Lookback_H1, and Lookback_H4, which specify how many historical bars are considered for calculating currency strength on respective timeframes. The Update_Seconds parameter determines how frequently the dashboard updates, balancing real-time responsiveness with computational efficiency.
FontSize, BackgroundColor, PanelWidth, PanelHeight, and initial position parameters allow users to customize the appearance and placement of the dashboard on their chart, making it adaptable to different screen sizes and personal preferences. The lookback periods influence how sensitive or smooth the currency strength calculations are, shorter periods react faster but can be noisy, whereas longer periods offer more stability but slower responsiveness.
input int    Lookback_M15    = 96;
input int    Lookback_H1     = 48;
input int    Lookback_H4     = 30;
input int    Update_Seconds  = 30;
input int    FontSize        = 12;
input color  BackgroundColor = clrBlack;
input int    PanelWidth      = 280;
input int    PanelHeight     = 240;
input int    InitPanelX      = 10;
input int    InitPanelY      = 10;
The arrays Currencies and Pairs are static data structures that list the major currencies and their associated currency pairs. The organization ensures that each currency's related pairs are grouped together, simplifying looping through pairs during strength calculations. For example, the Pairs array contains four pairs per currency, each including the currency either as the base or quote. This systematic grouping allows the calculation functions to efficiently assess how each currency performs relative to others by analyzing multiple pairs simultaneously, providing a more comprehensive strength measure.
static const string Currencies[8] = {"USD","EUR","GBP","JPY","CHF","CAD","AUD","NZD"};
static const string Pairs[8][4] = {
   {"USDJPY","EURUSD","GBPUSD","USDCHF"},
   {"EURUSD","EURJPY","EURGBP","EURCHF"},
   // ... .........
};
Global variables are declared to hold the calculated strength values across the different timeframes, stored in a two-dimensional array Strength[8][3]. These scores are used for display on the dashboard and for logging purposes. Additional variables like LastUpdate keep track of the last time the data was refreshed, preventing unnecessary recalculations.
The variables dragging, dragOffsetX, and dragOffsetY manage user interactions, specifically for enabling the trader to reposition the dashboard via mouse dragging. To visualize account performance, arrays times[] and equities[] are declared to store timestamped account equity data points, with dataCount tracking how many points have been collected; these are essential for plotting the account's equity and drawdown trends over time.
double Strength[8][3]; // [currency][timeframe]
datetime LastUpdate;
int dataCount;
double equities[MAX_POINTS];
datetime times[MAX_POINTS];
int PanelX, PanelY;
bool dragging;
int dragOffsetX, dragOffsetY;
During initialization (OnInit()), the EA sets the starting position of the dashboard based on user inputs. It then loops through all the currency pairs, calling SymbolSelect() on each to enable data access. This step is vital because if symbols are not enabled, subsequent data retrieval functions like iClose() would fail, leading to incorrect calculations or errors.
The code then initializes the LastUpdate timestamp and resets the data counter dataCount. It performs an initial currency strength calculation through UpdateStrengths(), ensuring that the dashboard displays current data immediately after startup. The DrawPanel() function is invoked to create the visual dashboard with labels, colored bars, and headers, providing an intuitive and visually appealing interface.
Furthermore, LogCurrencyStrengths() is called to print a textual summary of currency statuses in the terminal, giving traders a quick high-level overview. Finally, EventSetTimer() schedules the periodic update routine at intervals specified by Update_Seconds, enabling the dashboard to refresh automatically without manual intervention.
int OnInit()
{
   PanelX = InitPanelX;
   PanelY = InitPanelY;

   for(int i=0; i<8; i++)
      for(int j=0; j<4; j++)
         SymbolSelect(Pairs[i][j], true);

   LastUpdate = 0;
   dataCount = 0;

   UpdateStrengths();
   DrawPanel();
   LogCurrencyStrengths(1);
   EventSetTimer(Update_Seconds);
   return(INIT_SUCCEEDED);
}
When the EA is deinitialized (OnDeinit()), it performs cleanup activities: removing the timer event with EventKillTimer(), deleting all graphical objects associated with the dashboard (including the background, labels, bars, headers), and clearing the trend lines for equity and drawdown. This cleanup prevents leftover objects from cluttering the chart or consuming resources, ensuring a tidy environment when the EA is removed or reloaded.
void OnTimer()
{
   if(TimeCurrent() - LastUpdate < Update_Seconds)
      return;

   LastUpdate = TimeCurrent();
   UpdateStrengths();
   DrawPanel();
   LogCurrencyStrengths(1);

   double eq = AccountInfoDouble(ACCOUNT_EQUITY);
   if(dataCount < MAX_POINTS)
   {
      times[dataCount] = TimeCurrent();
      equities[dataCount] = eq;
      dataCount++;
   }
   DrawEquityLines();
   DrawDrawdownLines();
}
The core update logic resides in the OnTimer() function, which executes periodically. It first checks whether enough time has passed since the last update by comparing the current time with LastUpdate. If the specified interval hasn't elapsed, it exits early to avoid excessive computations. When triggered, it updates LastUpdate to the current time and calls UpdateStrengths() to recalculate the currency strength scores based on the latest market data.
It then calls DrawPanel() to refresh the visual dashboard, updating labels, colors, and bars to reflect current strength values. It also logs the current currency statuses via LogCurrencyStrengths(), providing textual insights. The function then fetches the current account equity (AccountInfoDouble(ACCOUNT_EQUITY)), appending the timestamp and equity value to the respective arrays, provided the maximum data points haven't been reached.
These stored data points are used by DrawEquityLines() and DrawDrawdownLines() to update the performance trend lines, visually representing the account’s growth and risk over time. This cycle ensures the entire dashboard remains synchronized with real-time market conditions and account performance.
void OnChartEvent(const int id, const long &lparam, const double &dparam, const string &sparam)
{
   if(id==CHARTEVENT_OBJECT_CLICK && sparam=="CS_BG")
   {
      dragging = true;
      dragOffsetX = (int)lparam - PanelX;
      dragOffsetY = (int)dparam - PanelY;
   }
   else if(id==CHARTEVENT_MOUSE_MOVE && dragging)
   {
      PanelX = (int)lparam - dragOffsetX;
      PanelY = (int)dparam - dragOffsetY;
      DrawPanel();
   }
   else if(dragging && id==CHARTEVENT_OBJECT_CLICK)
   {
      dragging = false;
   }
}
User interaction is managed in OnChartEvent(). When the user clicks on the background rectangle ("CS_BG"), dragging mode activates, recording the offset between the mouse position and the panel's current position. As the mouse moves (CHARTEVENT_MOUSE_MOVE), the panel's position updates dynamically, allowing the trader to reposition the dashboard interactively for better visibility. When the user releases the mouse button or clicks elsewhere, dragging mode deactivates, locking the panel in its new position. This feature enhances usability, making the dashboard customizable for different workspace layouts.
double CalculateStrength(int ci, ENUM_TIMEFRAMES tf, int lookback)
{
   double sum = 0;
   int cnt = 0;

   for(int j=0; j<4; j++)
   {
      string sym = Pairs[ci][j];
      if(Bars(sym, tf) < lookback+1) continue;
      double now = iClose(sym, tf, 0);
      double prev = iClose(sym, tf, lookback);
      if(prev == 0) continue;

      double pct = (now - prev) / prev * 100.0;

      if(StringFind(sym, Currencies[ci]) > 0)
         pct = -pct;

      sum += pct;
      cnt++;
   }
   return (cnt == 0) ? 0 : sum / cnt;
}
The calculation of currency strength is carried out in UpdateStrengths() and CalculateStrength(). UpdateStrengths() iterates through each currency index, calling CalculateStrength() for each of the three timeframes.
CalculateStrength() retrieves the latest close price (iClose()) for each relevant pair, then fetches historical close prices from the lookback period. It checks whether enough bars are available to perform the calculation; if not, it skips the pair to avoid errors. The percentage change over the lookback period is computed, and if the currency in question is the quote currency in the pair, the change's sign is inverted to measure the base currency's relative strength accurately.
This inversion ensures that an appreciation of the quote currency reflects a weakening of the base currency, maintaining consistency across calculations. The function sums these percentage changes across all four pairs for each currency and averages them to generate a representative strength score, stored in the Strength array for display and logging.
void DrawPanel()
{
   RemovePanel();
   ObjectCreate(0, "CS_BG", OBJ_RECTANGLE_LABEL, 0, 0, 0);
   ObjectSetInteger(0, "CS_BG", OBJPROP_CORNER, CORNER_LEFT_UPPER);
   ObjectSetInteger(0, "CS_BG", OBJPROP_XDISTANCE, PanelX);
   ObjectSetInteger(0, "CS_BG", OBJPROP_YDISTANCE, PanelY);
   ObjectSetInteger(0, "CS_BG", OBJPROP_XSIZE, PanelWidth);
   ObjectSetInteger(0, "CS_BG", OBJPROP_YSIZE, PanelHeight);
   // Add headers, labels, colored bars for each currency
}
The visual presentation of this data is handled by DrawPanel(), which creates a rectangle covering the designated dashboard area. Headers for each timeframe are added at the top for clarity. The function then loops through each currency, creating labels for the currency name, the numerical strength value (formatted with two decimal places), and a colored bar that visually indicates the strength or weakness.
The color scheme uses green shades for stronger currencies, orange for neutral, and red for weaker ones, allowing traders to quickly gauge market conditions visually. The bar's width is proportional to the strength value, providing an intuitive visual cue. These systematic, consistent graphical elements make the dashboard informative and easy to interpret at a glance.
void RemovePanel()
{
   for(int i=ObjectsTotal(0)-1; i>=0; i--)
   {
      string name = ObjectName(0, i);
      if(StringFind(name, "CS_") == 0 || StringFind(name, "Lbl_") == 0 || StringFind(name, "Bar_") == 0)
         ObjectDelete(0, name);
   }
}
When the dashboard needs updating or removal, RemovePanel() deletes all objects with specific name prefixes related to the dashboard, such as "CS_", "Hdr_", "Lbl_", "Val_", and "Bar_". This systematic deletion ensures the chart remains clean and prevents graphical clutter, allowing the dashboard to be rebuilt from scratch during each refresh without residual objects accumulating over time.
void DrawEquityLines()
{
   for(int i=1; i< dataCount; i++)
   {
      string id = StringFormat("EQ_%d", i);
      ObjectDelete(0, id);
      ObjectCreate(0, id, OBJ_TREND, 0,
                   times[i-1], equities[i-1],
                   times[i], equities[i]);
      ObjectSetInteger(0, id, OBJPROP_COLOR, clrYellow);
      ObjectSetInteger(0, id, OBJPROP_WIDTH, 2);
   }
}
The functions DrawEquityLines() and DrawDrawdownLines() visualize the account's performance trend. Each time new equity data is recorded, these functions delete previous trend objects ("EQ_" and "DD_") to keep the plot clean. They then create new trend objects connecting the stored data points, styled with distinct colors—yellow for equity and red for drawdown—to clearly differentiate the two.
The trend lines provide a visual history of how the account's value has evolved, as well as the maximum drawdowns experienced. These visual representations are only truly meaningful if the EA actively manages trades, as they rely on changes in account equity caused by executed orders.
void DrawDrawdownLines()
{
   double peak = -DBL_MAX;
   for(int i=1; i< dataCount; i++)
   {
      peak = MathMax(peak, equities[i-1]);
      double dd = equities[i-1] - peak;
      string id = StringFormat("DD_%d", i);
      ObjectDelete(0, id);
      ObjectCreate(0, id, OBJ_TREND, 0,
                   times[i-1], dd,
                   times[i], equities[i] - peak);
      ObjectSetInteger(0, id, OBJPROP_COLOR, clrRed);
      ObjectSetInteger(0, id, OBJPROP_WIDTH, 2);
   }
}
This is an important point: while the code for plotting equity and drawdown is included and will generate trend lines, their utility heavily depends on whether the EA performs automated trading operations. If the EA is purely informational or manual-only, the account equity will only change when the trader manually makes trades or deposits/withdrawals. In such cases, the equity plot may not accurately reflect real-time trading performance, and the trend lines could be static or less meaningful.
Therefore, these plotting features are most valuable when integrated into an EA that actively performs automatic trades, adjusting the account balance continually. When such an auto-trading system is in place, the equity plot provides a real-time visual of account growth, drawdowns, and overall performance, which can be invaluable for risk management and performance evaluation.
void LogCurrencyStrengths(int tfIdx)
{
   string sStrong="", sWeak="", sNeutral="";
   for(int i=0; i<8; i++)
   {
      double v = Strength[i][tfIdx];
      if(v > 0.3) sStrong += Currencies[i] + " ";
      else if(v < -0.3) sWeak += Currencies[i] + " ";
      else sNeutral += Currencies[i] + " ";
   }
   Print("Strong: ", sStrong, "| Weak: ", sWeak, "| Neutral: ", sNeutral);
}
Finally, LogCurrencyStrengths() provides a textual summary by categorizing each currency as strong, weak, or neutral based on predefined thresholds (e.g., greater than +0.3%, less than -0.3%). It concatenates the currency codes into strings for each category and outputs these summaries to the terminal window. This textual overview offers a quick snapshot of market sentiment across the major currencies, supplementing the graphical display for traders who prefer quick, high-level insights.
Outcomes
In this section, we will review the results of our EA testing on MetaTrader 5. 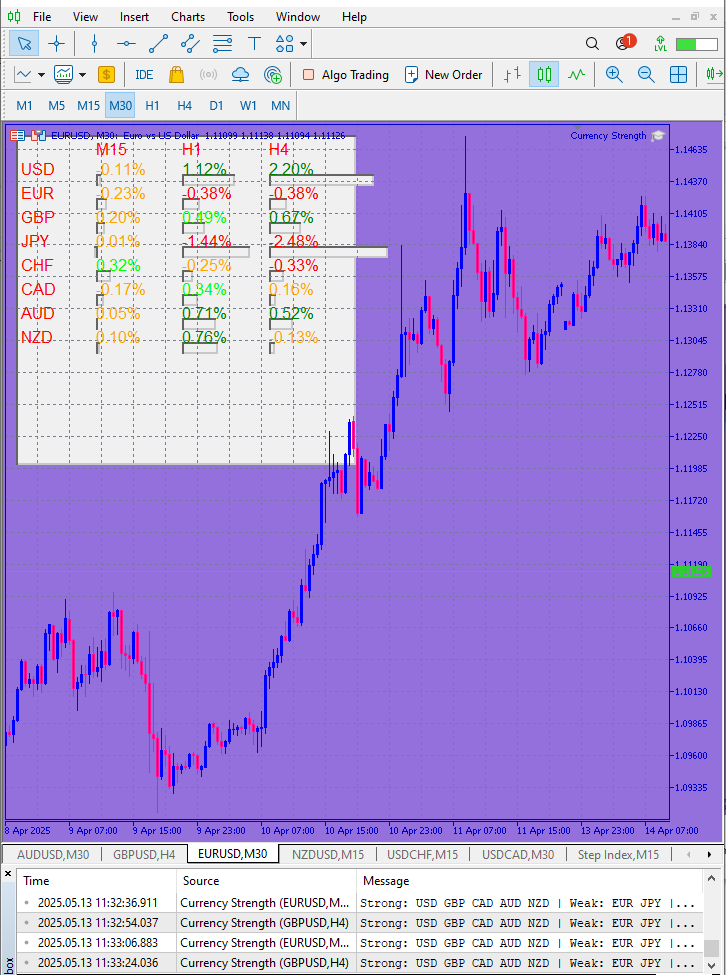
| Currency | M15 | H1 | H4 |
|---|---|---|---|
| USD | -0.11 | +1.12 | +2.20 |
| EUR | -0.23 | -0.38 | -0.38 |
| GBP | +0.20 | +0.49 | +0.67 |
| JPY | +0.01 | -1.44 | -2.48 |
| CHF | +0.32 | -0.25 | -0.33 |
| CAD | +0.17 | +0.34 | +0.16 |
| AUD | +0.05 | +0.71 | +0.52 |
| NZD | +0.10 | +0.76 | +0.13 |
- USD is the strongest on both H1 (+1.12 ) and H4 (+2.20 ), despite a brief M15 dip.
- JPY and EUR are the weakest on H1 (–1.44 and –0.38 ) and H4 (–2.48 and –0.38).
- GBP, CAD, AUD, NZD show mild to moderate strength on H1/H4, making them secondary “strong” candidates.
Now let’s draw out the trading implications from our strength scores. On the H4 timeframe, USD registers +2.20 % while JPY sits at –2.48 %. That wide gap tells us USD is firmly in control and JPY is weak—an ideal setup to go long USDJPY. Likewise, EUR shows –0.38 % on H4, again confirming USD’s dominance. In that case you’d look for short opportunities on EURUSD.
Conclusion
The currency strength meter helps you identify shifts in a pair across multiple timeframes. It provides a clear snapshot of potential market direction. That doesn’t mean you should trade immediately; instead, use it to find optimal entry levels and apply your risk management and confirmation strategies. This tool is a starting point for measuring currency strength, and there is room to refine the analysis and improve how the results are presented. Stay tuned for further developments in upcoming projects.
| Date | Tool Name | Description | Version | Updates | Notes |
|---|---|---|---|---|---|
| 01/10/24 | Chart Projector | Script to overlay the previous day's price action with a ghost effect. | 1.0 | Initial Release | Tool number 1 |
| 18/11/24 | Analytical Comment | It provides previous day's information in a tabular format, as well as anticipates the future direction of the market. | 1.0 | Initial Release | Tool number 2 |
| 27/11/24 | Analytics Master | Regular Update of market metrics after every two hours | 1.01 | Second Release | Tool number 3 |
| 02/12/24 | Analytics Forecaster | Regular Update of market metrics after every two hours with telegram integration | 1.1 | Third Edition | Tool number 4 |
| 09/12/24 | Volatility Navigator | The EA analyzes market conditions using the Bollinger Bands, RSI and ATR indicators | 1.0 | Initial Release | Tool Number 5 |
| 19/12/24 | Mean Reversion Signal Reaper | Analyzes market using mean reversion strategy and provides signal | 1.0 | Initial Release | Tool number 6 |
| 9/01/25 | Signal Pulse | Multiple timeframe analyzer | 1.0 | Initial Release | Tool number 7 |
| 17/01/25 | Metrics Board | Panel with button for analysis | 1.0 | Initial Release | Tool number 8 |
| 21/01/25 | External Flow | Analytics through external libraries | 1.0 | Initial Release | Tool number 9 |
| 27/01/25 | VWAP | Volume Weighted Average Price | 1.3 | Initial Release | Tool number 10 |
| 02/02/25 | Heikin Ashi | Trend Smoothening and reversal signal identification | 1.0 | Initial Release | Tool number 11 |
| 04/02/25 | FibVWAP | Signal generation through python analysis | 1.0 | Initial Release | Tool number 12 |
| 14/02/25 | RSI DIVERGENCE | Price action versus RSI divergences | 1.0 | Initial Release | Tool number 13 |
| 17/02/25 | Parabolic Stop and Reverse (PSAR) | Automating PSAR strategy | 1.0 | Initial Release | Tool number 14 |
| 20/02/25 | Quarters Drawer Script | Drawing quarters levels on chart | 1.0 | Initial Release | Tool number 15 |
| 27/02/25 | Intrusion Detector | Detect and alert when price reaches quarters levels | 1.0 | Initial Release | Tool number 16 |
| 27/02/25 | TrendLoom Tool | Multi timeframe analytics panel | 1.0 | Initial Release | Tool number 17 |
| 11/03/25 | Quarters Board | Panel with buttons to activate or disable quarters levels | 1.0 | Initial Release | Tool number 18 |
| 26/03/25 | ZigZag Analyzer | Drawing trendlines using ZigZag Indicator | 1.0 | Initial Release | Tool number 19 |
| 10/04/25 | Correlation Pathfinder | Plotting currency correlations using Python libraries. | 1.0 | Initial Release | Tool number 20 |
| 23/04/25 | Market Structure Flip Detector Tool | Market structure flip detection | 1.0 | Initial Release | Tool number 21 |
| 08/05/25 | Correlation Dashboard | Relationship between different pairs | 1.0 | Initial Release | Tool number 22 |
| 13/05/25 | Currency Strength Meter | measuring the strength of each currency across pairs | 1.0 | Initial Release | Tool number 22 |
Warning: All rights to these materials are reserved by MetaQuotes Ltd. Copying or reprinting of these materials in whole or in part is prohibited.
This article was written by a user of the site and reflects their personal views. MetaQuotes Ltd is not responsible for the accuracy of the information presented, nor for any consequences resulting from the use of the solutions, strategies or recommendations described.

- Free trading apps
- Over 8,000 signals for copying
- Economic news for exploring financial markets
You agree to website policy and terms of use