Data Science and ML (Part 41): Forex and Stock Markets Pattern Detection using YOLOv8

Contents
- Introduction
- What is YOLOv8?
- Getting chart patterns from MetaTrader 5
- Using YOLOv8 for pattern detection
- Biases, risks, and limitations of YOLOv8
- Chart Patterns Detection in MetaTrader 5 using YOLOv8
- Conclusion
Introduction
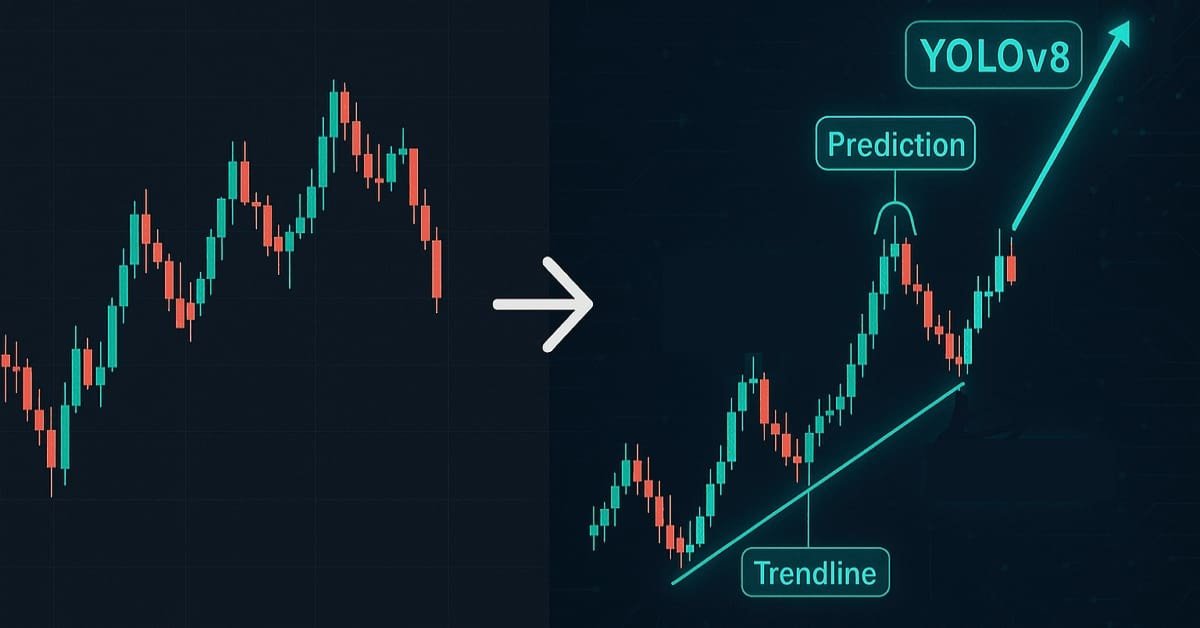
Pattern detection in financial markets is a challenging task in machine learning and AI. As effortlessly as it seems to us human beings, it requires some work for a machine to be able to detect and interpret these patterns, simply because unlike the tabular two-dimensional (tabular) data we often use in trading, pattern detection extends to two-dimensional image data which is usually stored in formats types such as .png, .jpg, etc.
There is a huge number of traders with strategies that depend on price action and specific chart patterns in the markets, such as:
- Ascending and descending staircases
- Ascending triangle
- Descending triangle
- Symmetrical triangle
- Flag
- Wedge
- Double top
- Double bottom
- Head and shoulders
- Rounded top or bottom
- Cup and handle
- and many more.
When it comes to programming, patterns such as candlestick patterns and indicator reactions, which can be identified even without sophisticated lines of code, the chart patterns mentioned above are quite complex.
It will take sophisticated, well-written, and optimized code to be able to detect even a simple pattern such as the W bottom, so why not use AI to help us with this boring task?
To address this problem using Artificial Intelligence (AI), in this article, we are going to discuss a very fascinating model named YOLOv8 that I came across on huggingface.co.
This model helps detect chart patterns from images and charts with a decent accuracy.
A basic understanding of machine learning and the Python programming language is required to fully grasp the contents of this article.
What is YOLOv8?
According to their documentation.
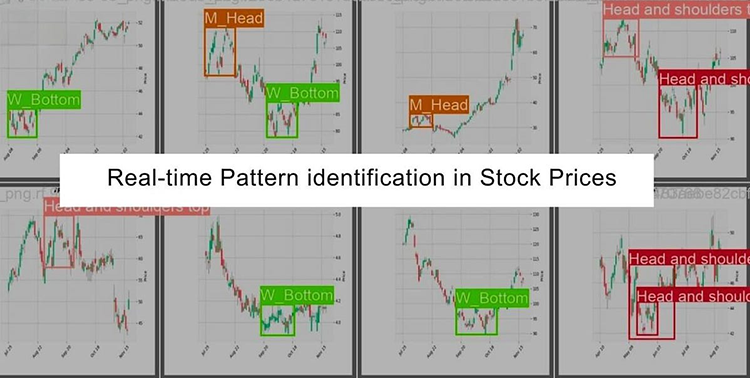
YOLOv8s is an object detection model based on the YOLO (You Only Look Once) framework. This model is designed to detect various chart patterns in real-time from screen-captured stock market trading data.
The model aids traders and investors by automating the analysis of chart patterns, providing timely insights for informed decision-making.
The model has been fine-tuned on a diverse dataset and achieves high accuracy in detecting and classifying stock market patterns in live trading scenarios.
As it stands currently, this model can accurately predict a couple of patterns, including.
Head and Shoulders Top

A brief description of the pattern
This pattern indicates that a reversal in the market is possible.
Traders believe that three sets of peaks and troughs, with a larger peak in the middle, indicate that a stock's price will begin falling.
The neckline represents the point at which bearish traders start selling. Read more.
Head and Shoulders Bottom
This is the opposite of the head and shoulders top pattern.
M Head Pattern:

A brief description of the pattern
Also known as a double top, this is a pattern formed from two consecutive rounding tops.
These rounding tops can often be an indicator for a bearish reversal as they often occur after an extended bullish rally.
If a double top occurs, the second rounded top will usually be slightly below the first rounded top's peak, indicating resistance and exhaustion.
Double tops can be rare occurrences, with their formation often indicating that investors are seeking to obtain final profits from a bullish trend. Read more.
W Bottom Pattern:

This works the same but opposite as the M Head pattern, read more.
Stock Line
I couldn't find references of it in the documentation or online, let's skip it for now.
Triangle(s) Pattern:
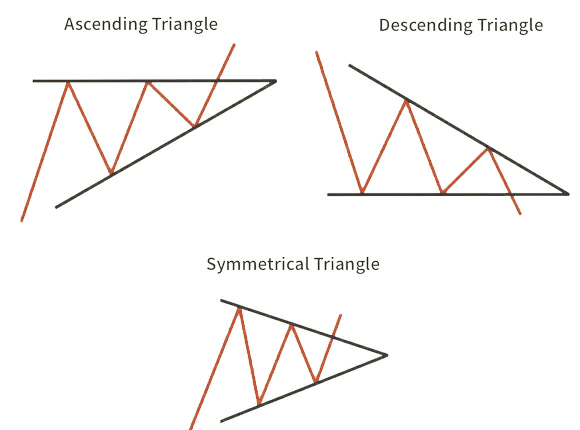
These patterns can be either a continuation pattern, if validated, or a powerful reversal pattern, in the event of failure.
Traders use triangles to pinpoint when the narrowing of a stock or security's trading range after a downtrend or uptrend occurs. Read more.
Getting Chart Patterns from MetaTrader 5
Since YOLOv8 works with images (image data), we need to extract a plenty of high-quality images that we can use for testing and playing with the model.
Luckily, MetaTrader 5 and the MQL5 programming language offers a functionality for taking a screenshot from whatever chart and symbol we'd like. Let us collect a couple of images using a script.
File: ChartScreenshots.mq5
#property script_show_inputs

input uint BarsToCapture = 1000; //Total Bars
input uint BarsShift = 50; //Bars Shift
//+------------------------------------------------------------------+
//| Script program start function                                    |
//+------------------------------------------------------------------+
void OnStart()
{
//--- Save current chart position

    long firstVisibleBar = ChartGetInteger(0, CHART_FIRST_VISIBLE_BAR);
    long chartShift = ChartGetInteger(0, CHART_SHIFT);
    double priceMax = ChartGetDouble(0, CHART_PRICE_MAX);
    double priceMin = ChartGetDouble(0, CHART_PRICE_MIN);

//--- Set chart properties for clean screenshots

    ChartSetInteger(0, CHART_SHOW_PRICE_SCALE, true);
    ChartSetInteger(0, CHART_SHOW_DATE_SCALE, true);
    ChartSetInteger(0, CHART_SHOW_GRID, false); // Disable grid for cleaner images
    ChartSetInteger(0, CHART_SHOW_VOLUMES, false);
    ChartSetInteger(0, CHART_SHOW_TRADE_HISTORY, false);
    ChartSetInteger(0, CHART_AUTOSCROLL, false);  // prevent scrolling

    int steps = (int)MathCeil((double)BarsToCapture / BarsShift);

    for(int i = 0; i < steps; i++)
    {
        // Shift chart view
        int shift = i * (int)BarsShift;
        ChartNavigate(0, CHART_END, -shift);

        // Wait a moment for the chart to update
        Sleep(500);

        // Take screenshot
        string filename = StringFormat("Screenshots\\%s.%s.%d.png", Symbol(), EnumToString(Period()), i+1);

        FileDelete(filename); //we delete a previous screenshot with the same name
        if(!ChartScreenShot(0, filename, 640, 480, ALIGN_CENTER))
         {
            printf("Failed to take screenshot #:%d Error = %d", i+1, GetLastError());
            continue;
         }
        else
         {
            printf("Screenshot saved: %s", filename);
         }
    }

//--- Restore original chart position

    ChartNavigate(0, CHART_END, -(int)firstVisibleBar);
    ChartSetDouble(0, CHART_PRICE_MAX, priceMax);
    ChartSetDouble(0, CHART_PRICE_MIN, priceMin);
    ChartSetInteger(0, CHART_SHIFT, chartShift);
}
This function captures multiple screenshots from the current chart for 1000 bars (default), shifting 50 bars (default) backwards from the previous screenshot.
Before calling a function to capture a screenshot, we have to ensure that the chart is as clean as possible. Even a few noises, such as the grid lines and tick volumes, could distract the models from detecting major patterns appearing in the chart.
    ChartSetInteger(0, CHART_SHOW_PRICE_SCALE, true);
    ChartSetInteger(0, CHART_SHOW_DATE_SCALE, true); // Showing the timescale on a chart
    ChartSetInteger(0, CHART_SHOW_GRID, false); // Disable grid for cleaner images
    ChartSetInteger(0, CHART_SHOW_VOLUMES, false); //Prevent displaying the tick volumes
    ChartSetInteger(0, CHART_SHOW_TRADE_HISTORY, false); //Prevent drawing arrows that displays trading history
    ChartSetInteger(0, CHART_AUTOSCROLL, false);  // prevent scrolling
All images will be saved under the path MQL5\Files\Screenshots.
Using YOLOv8 for Pattern Detection
According to their documentation, below is the minimum code required to run this model and receive the predicted outcome.
Installing
$pip install ultralytics
Getting started.
from ultralytics import YOLOvv8

model = YOLOvv8.from_pretrained("foduucom/stockmarket-pattern-detection-yolov8")
source = 'http://images.cocodataset.org/val2017/000000039769.jpg'
model.predict(source=source, save=True)
But, this code will produce errors in your environment because currently there is no YOLOvv8 from ultralytics (the documentation is kinda outdated), below is the right way to do it.
Firstly, we need to import the YOLO object and populate it with a trained model for the task.
from ultralytics import YOLO
import os

model = YOLO(os.path.join('Models','model.pt'))
The file model.pt, can be located here. After downloading the file, save it under a subfolder named Models in your currently working directory.
Thereafter, we have to call the predict method from a model object and parse an image name to it, and that's it, you get the predicted outcome :).
model.predict("image_name.png", save=True)
When save=True, the model saves the resulting image which contains highlighted patterns in it.
But, this is too simple and insufficient, let us create a class for this predictor to ensure that we have a reliable and robust code for analyzing and predicting multiple images from a folder which contains our screenshots.
Also, we need the best way to handle the predictions and visualize the outcome.
Detecting Patterns in a Single Image
Our class constructor takes the YOLO model object and the images folder, which contains all the screenshots taken from MetaTrader 5.
class YOLOv8deploy:

    def __init__(self, model: YOLO, images_folder: str):

        """A simple class for deploying YOLOv8 model for detecting trading patterns in chart images

        Args:
            model (YOLO): YOLO model object
            images_folder (str): A path where images will be imported from
        """

        self.model = model
        self.images_folder = images_folder
We also need a function in the class for getting all the images present in the specified folder.
This function will be handy when making multiple predictions as it lets us know the number of images available in a folder by returning a tuple containing the total number of images their names in a Python list.
def _get_images(self, folder: str, img_extensions: list=['*.png', '*.jpg', '*.jpeg']) -> tuple:

   """ A function to help us detect the number of images present in a folder

   Args:
       folder (str): A path where images are located
       img_extensions (list, optional): Image filenames extensions. Defaults to ['*.png', '*.jpg', '*.jpeg'].

   Returns:
       tuple: Returns the number of images present in a folder and their names
   """

   image_files = []
   for ext in img_extensions:
       image_files.extend(glob.glob(os.path.join(folder, ext)))

   return (len(image_files), image_files) # Get the number of images and their names
Let's extend the predict function to let it predict a single image, this function should also let us know the detected patterns and the confidence level for those patterns.
def predict_image(self, img_name: str, hist: bool=True):

   """This function predicts a single image

   Args:
       img_name (str): name of the image
       hist (bool, optional): When set to false it means the function isn't predicting multiple instances and the outcome will be displayed.

       Defaults to True.
   """

   if os.path.exists(img_name) == False: # Check if an image exists
       print(f"Failed to detect patterns, {img_name} not found")
       return

   results = self.model.predict(source=img_name, save=True) # Predict an image

   # Loop through the results
   for result in results:
       boxes = result.boxes  # Contains bounding boxes and confidence
       names = result.names  # Class index to name mapping

       if boxes is not None and len(boxes) > 0:
           for box in boxes:
               cls_id = int(box.cls[0])  # class id
               conf = box.conf[0].item()  # confidence score
               label = names[cls_id]

               print(f"Detected: {label} (confidence: {conf:.2f})")

               # Open the saved image if this is a single (non-historical) run

           if not hist:
               base_name = os.path.splitext(os.path.basename(img_name))[0] + ".jpg"
               saved_path = os.path.join(result.save_dir, base_name)

               print("saved path: ",saved_path)

               if os.path.exists(saved_path):
                   print(f"Opening detected image: {saved_path}")
                   img = cv2.imread(saved_path)
                   cv2.imshow("Detected Patterns", img)
                   cv2.waitKey(0)
                   cv2.destroyAllWindows()
       else:
           print("No detections.")
The predict function offered YOLOv8 returns a dictionary containing information about the box which is then displayed inside an image, this box is wrapped around a pattern detected followed with the confidence level for a particular chart pattern detected.
After extracting this information, we print it in a Python console or Command Prompt (CMD).
At the end of the function, when hist is set to False, this function uses the cv2 module to display the predicted outcome on a window's dialog.
This is practical when you want to visualize the resulting image containing patterns produced by the model.
Example.
images_path = r"C:\Users\Omega Joctan\AppData\Roaming\MetaQuotes\Terminal\F4F6C6D7A7155578A6DEA66D12B1D40D\MQL5\Files\Screenshots" # Change this for to the right path on your pc :)
symbol = "EURUSD"
timeframe = "PERIOD_H1"
imgs = 100

pattern_detector = YOLOv8deploy(model=model, images_folder=images_path)

pattern_detector.predict_image(img_name=os.path.join(images_path, f"{symbol}.{timeframe}.{11}.png"),
                               hist=False)
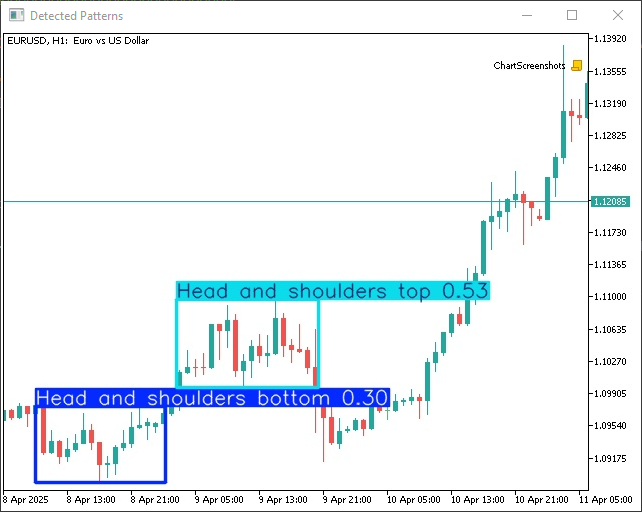
We have an image taken from EURUSD.PERIOD_H1 with a marked number 11 inside the Screenshots folder that we intend to visualize.
Original image.

Below is the resulting image produced by the model after the predict function, in a separate window dialog.
Detecting Patterns across Multiple Images
After receiving images from the Screenshots folder, we loop through them all and pass each image to the predict_image function we just created above.
def predict_images(self):

   _, image_names = self._get_images(self.images_folder) # Get all images from a folder

   for image_name in image_names:
       self.predict_image(img_name=image_name)
Now, let's call this function to predict multiple images we collected. This is similar to back-testing, by passing multiple images collected historically, we can check if this model is decent one or not.
pattern_detector.predict_images()Outputs.
All the predicted outcomes and images produced by this model can be found in the current working directory under runs\predict*
As you can see above, the model got some decent predictions, but just like any machine learning model ever built, it has some weaknesses and limitations. Below are some of those.
Biases, Risks, and Limitations of YOLOv8
01: The performance may be affected by variations in chart styles, screen resolution, and market conditions.
It is crucial to ensure that your candlestick colors on the chart are less puzzling; the background and candlestick colors should be very distinct from each other for better outcomes.
The scale of the chart also matters, a larger chart scale in MetaTrader 5 could lead to seeing incomplete patterns, while a smaller one might introduce noise.
You have to find the right balance in the chart scale and image size.
02: Rapid market fluctuations and noise in trading data may impact accuracy.
Fluctuations can lead to false breakthroughs and weird patterns. This model is bound to make errors on such charts and markets.
03: Market-specific patterns not well-represented in the training data may pose challenges for detection.
You have to avoid markets and timeframes with uncertain patterns, deploying the model on the right market(s) is the best way to ensure you get the best out of the model.
Chart Patterns Detection in MetaTrader 5 using YOLOv8
Again, the YOLOv8 model works with images and produces the predicted outcome in image format which is impossible to read and interpret in the native MQL5 language. However, the language has an ability to work with images in bitmap format .BMP, this is a good starting point.
Since it is possible to create an image-based object or to embed an image into the back of MetaTrader 5 chart using MQL5, as it has been done several times. Let's open these images produced by YOLOv8 which contains chart patterns detected inside MetaTrader 5 at the back of the chart just like they did in this article.
After adding an image at the back of the chart (background), we can hide current bars running in the foreground and update the chart as an image with candles.
To achieve this, we have to modify a couple of things in our Python class, starting with improving the predict function, making it capable of saving all the images containing predictions to a specific/same directory (folder).
Filename: deploy.py
def predict_image(self, img_name: str, save_path: str):

    """This function predicts a single image

    Args:
       img_name (str): name of the image
       hist (bool, optional): When set to false it means the function isn't predicting multiple instances and the outcome will be displayed.

       Defaults to True.
   """

   if os.path.exists(img_name) == False: # Check if an image exists
       print(f"Failed to detect patterns, {img_name} not found")
       return

   results = self.model.predict(source=img_name,
                                save=True,
                                project=save_path,
                                name="YOLOv8 Images",
                                exist_ok=True
                                ) # Predict an image

   # Loop through the results
   for result in results:
       boxes = result.boxes  # Contains bounding boxes and confidence
       names = result.names  # Class index to name mapping

       # Convert a jpg image to bmp suitable for MQL5 diplay purposes

       base_name = os.path.splitext(os.path.basename(img_name))[0] + ".jpg"
       saved_path = os.path.join(result.save_dir, base_name)

       convert_jpg_to_bmp(saved_path, os.path.join(result.save_dir, os.path.splitext(os.path.basename(img_name))[0] + '.bmp'))

       if boxes is not None and len(boxes) > 0:
           for box in boxes:
               cls_id = int(box.cls[0])  # class id
               conf = box.conf[0].item()  # confidence score
               label = names[cls_id]

               print(f"Detected: {label} (confidence: {conf:.2f})")
       else:
           print("No detections.")
Given this ability to save the images in a specified folder using the predict function, we can save all the files under a subfolder named YOLOv8 Images created under the MQL5 files parent path.
YOLOv8 produces an image in JPEG or JPG format, if we want to use this image in MetaTrader 5 we have to convert it into a Bitmap format (BMP). Below is the function for the task.
def convert_jpg_to_bmp(jpg_path, bmp_path):
    """
    Convert a JPG image to 24-bit RGB BMP format

    Args:
        jpg_path (str): Path to input JPG file
        bmp_path (str): Path to save output BMP file
    """
    try:
        # Open the JPG image
        with Image.open(jpg_path) as img:
            # Convert to RGB if not already (handles CMYK, grayscale, etc.)
            if img.mode != 'RGB':
                img = img.convert('RGB')

            # Save as 24-bit BMP
            img.save(bmp_path, 'BMP')

        print(f"Successfully converted {jpg_path} to {bmp_path}")
        return True

    except Exception as e:
        print(f"Conversion failed: {str(e)}")
        return False
Now, here is how we can detect and predict the patterns available on a single image.
files_path = r"C:\Users\Omega Joctan\AppData\Roaming\MetaQuotes\Terminal\F4F6C6D7A7155578A6DEA66D12B1D40D\MQL5\Files"
images_path = os.path.join(files_path, "Screenshots") # Change this for to the right path on your pc :)

# ....
# ....

pattern_detector = YOLOv8deploy(model=model, images_folder=images_path)
pattern_detector.predict_image(img_name=image_filename, save_path=files_path)
We can automate this process. After several minutes have passed, we want our script to read an image from MQL5\Files\Screenshots, make predictions, and save an image to MQL5\Files\YOLOv8 Images.
files_path = r"C:\Users\Omega Joctan\AppData\Roaming\MetaQuotes\Terminal\F4F6C6D7A7155578A6DEA66D12B1D40D\MQL5\Files"
images_path = os.path.join(files_path, "Screenshots") # Change this for to the right path on your pc :)
symbol = "EURUSD"
timeframe = "PERIOD_H1"

def scheduledYOLOv8Run():

    now = datetime.now() # Get the current local date and time

    # Extract current day and hour

    date = now.day
    current_day = now.weekday()  # e.g., 'Wednesday'
    current_hour = now.strftime("%H")  # e.g., '14' for 2 PM in 24-hour format

    image_filename = os.path.join(images_path, f"{symbol}.{timeframe}.{date}.{current_day+1}.{current_hour}.png")

    pattern_detector = YOLOv8deploy(model=model, images_folder=images_path)

    pattern_detector.predict_image(img_name=image_filename,
                                    save_path=files_path)

    print(f"Processed image at {datetime.now().strftime('%Y-%m-%d %H:%M:%S')}")


# Schedule the pattern detection after every minute(s)

schedule.every(1).minutes.do(scheduledYOLOv8Run)

print("Scheduler started. Press Ctrl+C to stop.")

# Run forever
while True:
    schedule.run_pending()
    time.sleep(1)
Now, let's prepare the right environment for deploying the produced image present in a Bitmap (.BMP) format in a MetaTrader 5 chart.
We start by initializing the timer handling function to help us automate the process of taking a screenshot and updating the chart with the image containing predicted (detected) patterns.
Filename: YOLOv8 EA.mq5
input uint chart_scale = 3;
input uint timer_seconds = 60;

int chart_width, chart_height;
//+------------------------------------------------------------------+
//| Expert initialization function                                   |
//+------------------------------------------------------------------+
int OnInit()
  {
//---

   if (!EventSetTimer(timer_seconds))
     {
       printf("%s failed to set the timer, Error = %d",__FUNCTION__,GetLastError());
       return INIT_FAILED;
     }

    showBars(true);

//---

   return(INIT_SUCCEEDED);
  }
The function named showBars, is responsible for cleaning and preparing the right environment on the chart for taking a screenshot.
void showBars(bool show=true)
 {
//--- Cleaning the chart

    ChartSetInteger(0, CHART_SHOW_PRICE_SCALE, true);
    ChartSetInteger(0, CHART_SHOW_DATE_SCALE, true);
    ChartSetInteger(0, CHART_SHOW_GRID, false); // Disable grid for cleaner images
    ChartSetInteger(0, CHART_SHOW_VOLUMES, false);
    ChartSetInteger(0, CHART_SHOW_TRADE_HISTORY, false);
    ChartSetInteger(0, CHART_AUTOSCROLL, true);  // prevent scrolling
    ChartSetInteger(0, CHART_SHIFT, true);

    if (ChartGetInteger(0, CHART_SCALE) != chart_scale)
         ChartSetInteger(0, CHART_SCALE, chart_scale);

   if (show)
     {
         ChartSetInteger(0, CHART_COLOR_BACKGROUND, clrWhite);
         ChartSetInteger(0, CHART_COLOR_FOREGROUND, clrBlack);
         ChartSetInteger(0, CHART_COLOR_CHART_UP, clrTomato);
         ChartSetInteger(0, CHART_COLOR_CANDLE_BULL, clrTomato);
         ChartSetInteger(0, CHART_COLOR_CHART_DOWN, clrLightSeaGreen);
         ChartSetInteger(0, CHART_COLOR_CANDLE_BEAR, clrLightSeaGreen);
         ChartSetInteger(0, CHART_SHOW_ASK_LINE, true);
         ChartSetInteger(0, CHART_SHOW_BID_LINE, true);
         ChartSetInteger(0, CHART_COLOR_ASK, clrTurquoise);
     }
   else
     {
         ChartSetInteger(0, CHART_COLOR_BACKGROUND, clrWhite);
         ChartSetInteger(0, CHART_COLOR_FOREGROUND, clrBlack);

         ChartSetInteger(0, CHART_COLOR_CHART_UP, clrWhite);
         ChartSetInteger(0, CHART_COLOR_CANDLE_BULL, clrWhite);
         ChartSetInteger(0, CHART_COLOR_CHART_DOWN, clrWhite);
         ChartSetInteger(0, CHART_COLOR_CANDLE_BEAR, clrWhite);
         ChartSetInteger(0, CHART_SHOW_ASK_LINE, true);
         ChartSetInteger(0, CHART_SHOW_BID_LINE, true);
         ChartSetInteger(0, CHART_COLOR_ASK, clrTurquoise);
     }

   ChartRedraw();
 }
When this function is called with a false value, all the properties of the chart (including candlestick colors) are set to the same color as the background of the chart, this is done to make everything invisible.
This is necessary as we will be populating the current chart with an image in the background so, we don't want the bars in the foreground to appear on our image as they can create a confusing environment.
Below is the function for turning a Bitmap (.BMP) image into an object, then assigning it to the background of the current chart.
//+------------------------------------------------------------------+
//|       Function to set a BMP image as chart background            |
//+------------------------------------------------------------------+
bool chartBackGroundSet(string filename, int width, int height)
{
    string obj_name = "background-img";

   if(!ObjectCreate(0,obj_name,OBJ_BITMAP_LABEL,0,0,0))
     {
      printf("%s failed to create a bitmap in the chart window! Error = %s",__FUNCTION__,ErrorDescription(GetLastError()));
      return(false);
     }

//--- set the path to the image file
   if(!ObjectSetString(0,obj_name,OBJPROP_BMPFILE, filename))
     {
      printf("%s failed to load the image! Error = %s",__FUNCTION__,ErrorDescription(GetLastError()));
      return(false);
     }

//--- Position the image to cover the entire chart

    ObjectSetInteger(0, obj_name, OBJPROP_XDISTANCE, 0);
    ObjectSetInteger(0, obj_name, OBJPROP_YDISTANCE, 0);
    ObjectSetInteger(0, obj_name, OBJPROP_XSIZE, width);
    ObjectSetInteger(0, obj_name, OBJPROP_YSIZE, height);

//--- Send the image to the background

    ObjectSetInteger(0, obj_name, OBJPROP_BACK, true);
    ObjectSetInteger(0, obj_name, OBJPROP_ZORDER, -1);

//--- Make sure the object is visible
    ObjectSetInteger(0, obj_name, OBJPROP_SELECTABLE, false);
    ObjectSetInteger(0, obj_name, OBJPROP_HIDDEN, true);

//--- Redraw the chart to see changes

    ChartRedraw(0);
//---
   return true;
}
Finally, let's automate the process of taking screenshots and sending them to the Screenshot path to be read by our Python script, we also automate the process of reading the predicted image(s) from the folder YOLOv8 Images, and the process of painting the image on the MetaTrader 5 chart.
void OnTimer(void)
  {
//---

    showBars(true); //explicitly show the bars

    // Clear the objects before taking a screenshot
    ObjectsDeleteAll(0);
    ObjectsDeleteAll(0,0);

    if (takeScreenShot())
     {
       Print("Screen shot taken: ",TimeCurrent());
       Sleep(100);
     }

    chart_width = (int)ChartGetInteger(0, CHART_WIDTH_IN_PIXELS);
    chart_height = (int)ChartGetInteger(0, CHART_HEIGHT_IN_PIXELS);

//--- Take screenshot

    MqlDateTime time_struct;
    TimeToStruct(TimeLocal(), time_struct);

    string filename = StringFormat("\\Files\\YOLOv8 Images\\%s.%s.%d.%d.%d.bmp",Symbol(),EnumToString(Period()),time_struct.day, time_struct.day_of_week, time_struct.hour);
    string fileshort_name = filename;

    bool checkfile = false;
    if (StringReplace(fileshort_name, "\\Files\\","")>0)
      checkfile = true; //If the parent folder was removed we can proceed to check if a file exists before drawing an object

    if (checkfile)
     while (!FileIsExist(fileshort_name))
       {
         printf("%s not found",fileshort_name);
         return;
       }

//--- Set the image with patterns detected to a chart

    if (!chartBackGroundSet(filename, chart_width, chart_height))
        return;

    showBars(false);
  }
Finally, an Expert Advisor (EA) was attached to EURUSD, PERIOD_H1 (same as in the Python script). The Python script was up and running, and the timer was set to 60 seconds.
After 60 seconds had passed in the EURUSD chart, MetaTrader 5 received an image from the model.
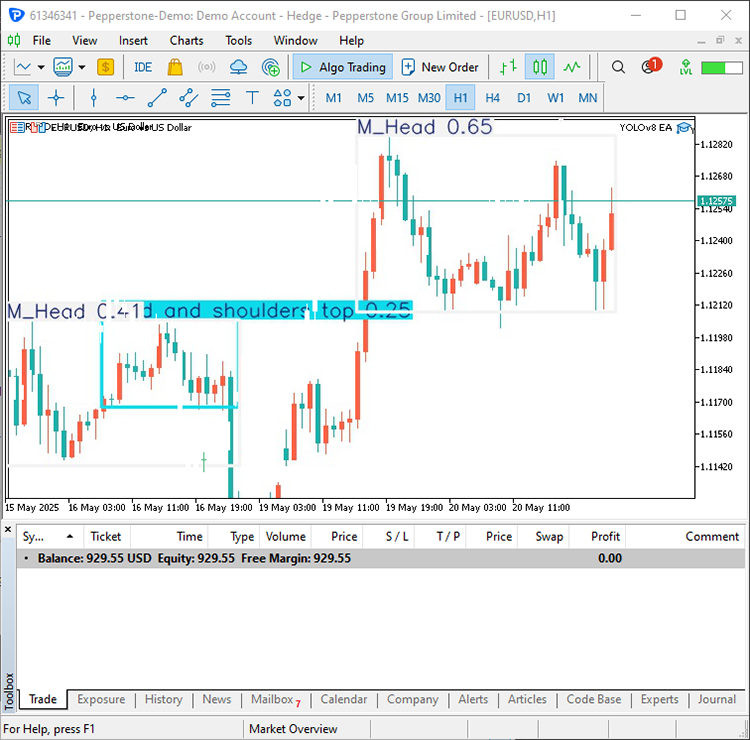
So cool!
The method used for attaching an image as the background of the chart used above is crude, and it assumes that the size of the chart is constant, or it remains the same for some time (at least for the time set on the timer functionality).
So, adjusting the chart size will interrupt the process of drawing an image on the chart for some time, I recommend using the method discussed here to get a robust way of visualizing the image as the background of a chart.
Final Thoughts
YOLOv8 is an impressive model in my opinion, just like any other machine learning models, it has its limitations and drawbacks but, when it comes to detecting the chart patterns discussed earlier, it does get some patterns right so, kudos to its writers because I have tried creating a similar model for this task in the past and got bad results.
While we always use AI models to automate our trading strategies, this model isn't practical for algorithmic trading since it produces images that only a human can read for now. It is more of a cool way of detecting patterns for manual traders, to use it for algorithmic strategies you can find a way to establish a connection between Python and MetaTrader for sending raw information in texts or JSON formats about the state of the model and the predictions which are offered by the predict method of this model.
Best regards.
Stay tuned and contribute to machine learning algorithms development for the MQL5 language in this GitHub repository.
Attachments Table
Filename & Path | Description & Usage |
|---|---|
| Experts\YOLOv8 EA.mq5 | An expert advisor for collecting screenshots from the chart and adding the predicted image by YOLOv8 to the current chart. |
| Include\errordescription.mqh | A library for converting error codes produced in MetaTrader 5 and MQL5, from integers to human-readable strings. |
| Scripts\ChartScreenshots.mq5 | A script for taking multiple screenshots historically from a specified chart in MetaTrader 5. |
| YOLOv8 Proj\test.py | A Python script for testing the YOLOv8 model across multiple images. |
| YOLOv8 Proj\deploy.py | A Python script for deploying and running the YOLOv8 model continuously. |
| YOLOv8 Proj\requirements.txt | Contains all the Python dependencies used in the project and their version number. |
Warning: All rights to these materials are reserved by MetaQuotes Ltd. Copying or reprinting of these materials in whole or in part is prohibited.
This article was written by a user of the site and reflects their personal views. MetaQuotes Ltd is not responsible for the accuracy of the information presented, nor for any consequences resulting from the use of the solutions, strategies or recommendations described.

- Free trading apps
- Over 8,000 signals for copying
- Economic news for exploring financial markets
You agree to website policy and terms of use