
Price Action Analysis Toolkit Development (Part 30): Commodity Channel Index (CCI), Zero Line EA

Introduction
In this article, we build an MQL5-powered tool that simplifies price-action trading. The system automates a strategy based on four elements: a dual Commodity Channel Index (CCI), a 34-period Exponential Moving Average (EMA), the Average True Range (ATR), and pure price action. After reviewing each indicator and outlining the full trading strategy, we will walk through the step-by-step development of the Expert Advisor, test it, analyze the results, and draw conclusions. A summary of the other tools we have developed is presented in the table on the last page of the article.
Please review the table of contents below.
Indicator Overview
The Commodity Channel Index (CCI) is a momentum oscillator that compares the current price to its recent average to flag potential overbought, oversold, or trend-reversal conditions. The Commodity Channel Index (CCI) can be derived as illustrated below:
CI = (Typical Price − SMA) / (0.015 × Mean Deviation)CCI - Commodity Channel Index
Typical Price (TP) – It is obtained by summing the period’s high, low, and closing prices and then dividing that total by three:
           h + l + c
TP =       ---------
               3
SMA - Simple Moving Average
A simple moving average (SMA) takes the typical prices from a specified window, such as the most recent 20 sessions, adds them up, and divides by the number of periods. This process smooths out daily swings, making the underlying trend easier to see.
Mean Deviation
It is the mean of the absolute deviations of the typical prices from their simple moving average.
This statistic expresses how far, on average, each typical price lies from the SMA, offering a practical gauge of price variability (volatility) during the selected period.
Constant Factor 0.015Multiplying by this fixed coefficient compresses the CCI output so that the vast majority of values sit roughly between −100 and +100, making the indicator more readable and allowing sharp deviations that signal pronounced overbought or oversold conditions to stand out.
Developed by Donald Lambert and first published in 1980 for analyzing cyclical movements in commodities, the indicator is now widely applied to equities, currencies, and other asset classes. In this strategy, we employ two CCIs simultaneously: a fast CCI (25) to capture short-term momentum and a slow CCI (50) to gauge broader market strength. Most CCI readings fall between –100 and +100, and excursions beyond that band often reveal exceptional strength or weakness. While these outer levels can serve as a volatility filter, the zero line itself remains the primary trigger in our strategy. A cross from negative to positive territory signals a potential shift to bullish momentum; a move in the opposite direction flags emerging bearish pressure.
Because zero-line crosses appear earlier than ±100 breaks, they give our Expert Advisor faster entries, albeit with the possibility of occasional whipsaws. To temper that noise, the EA optionally looks for additional confirmation: a sustained push above +100 reinforces long signals, and a drop below –100 strengthens short signals. In short, zero-line crossovers generate the core alerts, while the ±100 levels act as a secondary filter rather than a substitute.
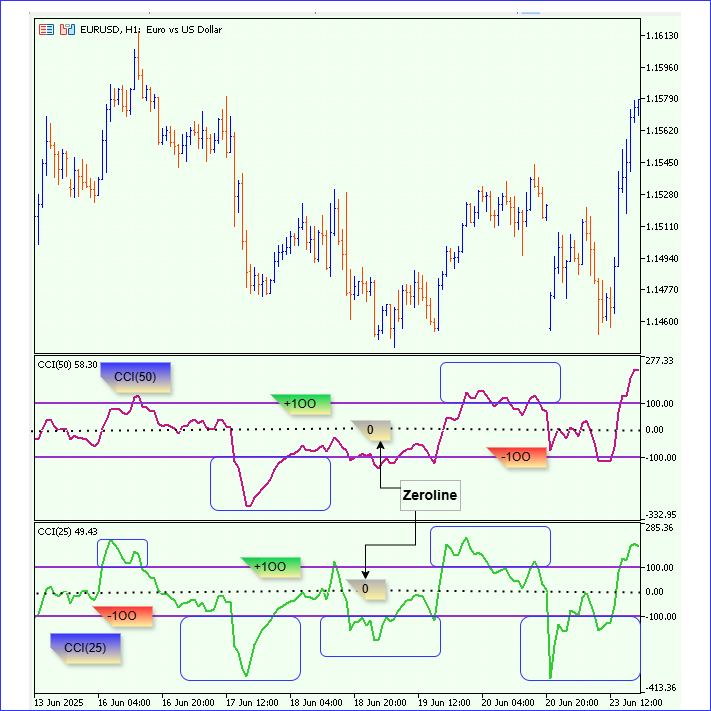
Fig 2: CCI Indicator
The following explains how to create two CCI handles in MQL5, manage them correctly, and retrieve their values.
- Creating the CCI handles in OnInit() with
handleCCI_Long  = iCCI(_Symbol, _Period, CCI_LongPeriod, PRICE_TYPICAL);
handleCCI_Short = iCCI(_Symbol, _Period, CCI_ShortPeriod, PRICE_TYPICAL);
- Copying buffer values with CopyBuffer() in OnTick()
CopyBuffer(handleCCI_Long,  0, 0, 2, cciL);
CopyBuffer(handleCCI_Short, 0, 0, 1, cciS);
Exponential Moving Average (EMA) 34-Period
An Exponential Moving Average (EMA) is a trend-following indicator that responds quickly to new price information by assigning greater weight to the most recent candles. This exponential weighting filters out short-term noise and makes the prevailing trend easier to see. On a one-hour chart, a 34-period EMA is often used because it spans roughly one trading week. Trade only in the direction of the 34-period EMA: go long when price is above the EMA, and go short when price is below it. This rule functions as a continuous trend filter, keeping the strategy out of counter-trend trades.
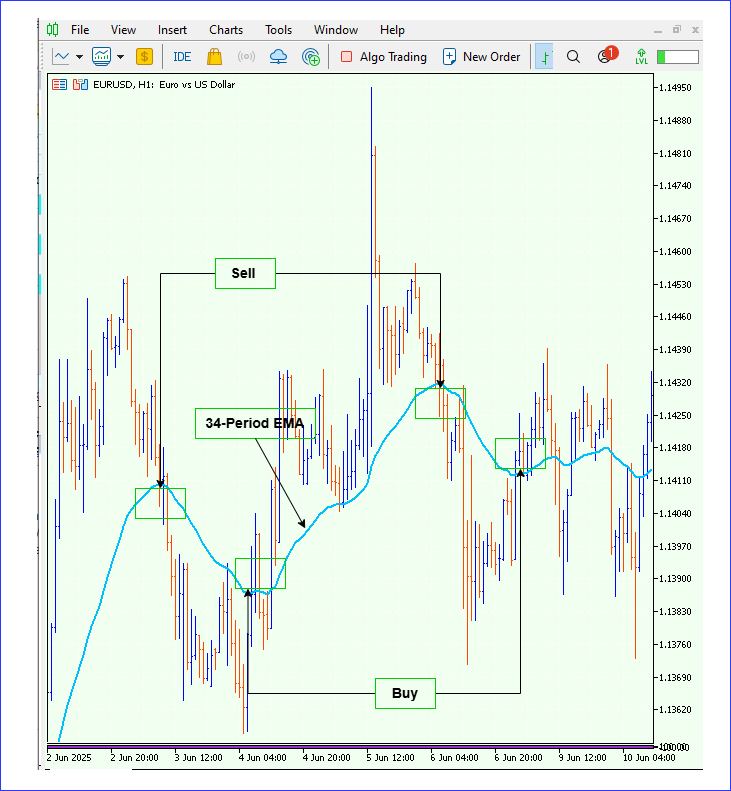
Fig 3: 34-Period EMA
Below is how to create a 34-period EMA handle in MQL5
- Declaration:
input int EMAPeriod = 34;
- Initialization:
handleEMA = iMA(_Symbol, _Period, EMAPeriod, 0, MODE_EMA, PRICE_CLOSE);
- Copying Buffer (same logic):
double ema34[1];
if(CopyBuffer(handleEMA, 0, 0, 1, ema34) < 1) return;
double ema_now = ema34[0];
Average True Range (ATR)
The Average True Range (ATR) is a volatility gauge developed by J. Welles Wilder Jr. and introduced in his 1978 book “New Concepts in Technical Trading Systems.” It averages the True Range over a chosen look-back-14 periods by default, so it reflects the market’s “raw” price swings.
In this article, we use the Average True Range (ATR) to determine and set our stop-loss (SL) and take-profit (TP) levels. Below is how to implement it in MQL5:
- Declaration
int handleATR = INVALID_HANDLE;
input int ATR_Period = 14;
- Initialization
handleATR = iATR(_Symbol, _Period, ATR_Period);
if(handleATR == INVALID_HANDLE) return INIT_FAILED;
- Copying Buffer
double atrBuf[1];
if(CopyBuffer(handleATR, 0, 0, 1, atrBuf) > 0)
{
   double atrValue = atrBuf[0];
   // use atrValue here…
}
- Cleanup
if(handleATR != INVALID_HANDLE)
    IndicatorRelease(handleATR);
Strategy Logic
In this section, we explain how our CCI Zero-Line Expert Advisor generates entry signals by combining two Commodity Channel Index (CCI) indicators and a 34‑period Exponential Moving Average (EMA). When the price crosses above the zero line of the Commodity Channel Index (CCI), it indicates that the market momentum is shifting upward, suggesting a potential bullish signal or an increase in buying pressure. Conversely, when the price crosses below the zero line of the CCI, it signals that the market momentum is turning downward, indicating a possible bearish trend or increased selling pressure.
When the price moves above the 34-period EMA, it generally signifies an upward shift in market momentum, implying a possible bullish trend or opportunity to buy. On the other hand, if the price drops below the 34 EMA, it suggests a decline in momentum and the potential start of a bearish trend, indicating a possible signal to sell.
Indicators Used
- CCI (25) – fast Commodity Channel Index
- CCI (50) – slow Commodity Channel Index
- EMA (34) – 34-period Exponential Moving Average on closing prices
Buy Signal Criteria
- CCI (25) Above Zero: CCI (25) must be above the zero line, indicating short‑term bullish momentum.
- CCI (50) Zero-Line Crossover: CCI (50) must cross up through the zero line, confirming longer‑term trend shift.
- Price Confirmation: The current candle must close above the EMA (34), validating the bullish bias.
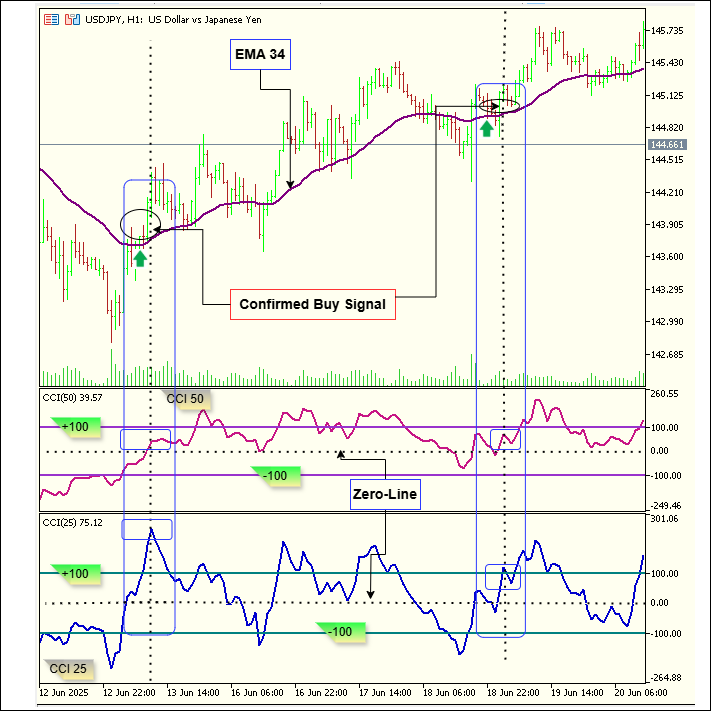
Fig 4: Buy Signal Conditions
When all three conditions occur on a new bar, the EA registers a buy signal.
Sell Signal Criteria
- CCI (25) Below Zero: CCI (25) must be below the zero line, indicating short‑term bearish momentum.
- CCI (50) Zero-Line Crossover: CCI (50) must cross down through the zero line, confirming longer‑term bearish shift.
- Price Confirmation: The current candle must close below the EMA (34), validating the bearish bias.
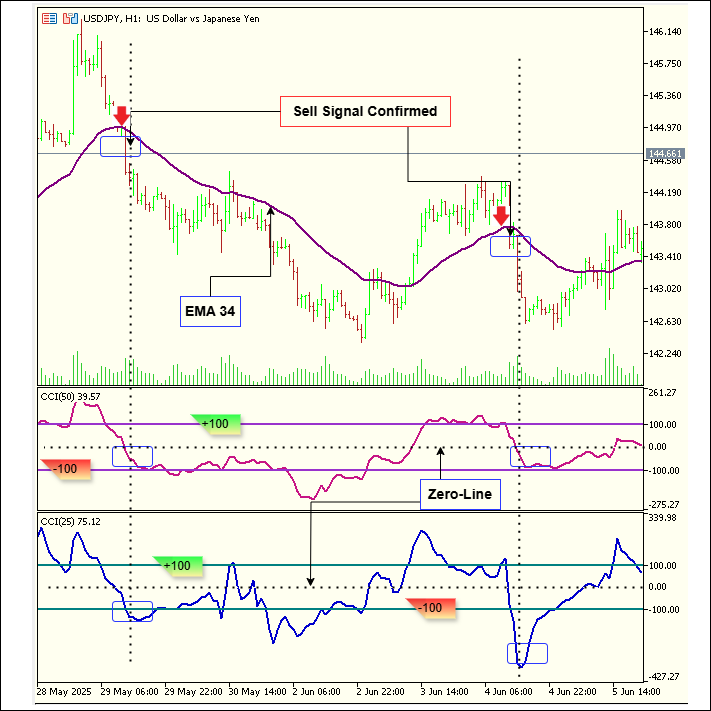
Fig 5: Sell Signal Conditions
When all three conditions occur on a new bar, the EA registers a sell signal.
Designing The Expert Advisor
When the EA starts, it first sets up the necessary indicator handles that allow it to retrieve real-time data from the chart. This process occurs in the OnInit() function. The handles include two CCIs, one with a long period (50) to identify the broader trend and another with a shorter period (25) to serve as a confirmation indicator, and an EMA with a period of 34 that acts as a trend filter. Specifically, the code creates these handles using functions like iCCI() and iMA(), which request the indicators from MetaTrader’s internal engine.
Proper creation of these handles is critical; if any handle fails to initialize, indicated by returning INVALID_HANDLE, the EA will halt, preventing false signals or errors during operation. Additionally, there is an optional ATR handle, created only if ATR-based stop-loss and take-profit management are enabled (UseATR parameter).
handleCCI_Long  = iCCI(_Symbol, _Period, CCI_LongPeriod, PRICE_TYPICAL);
handleCCI_Short = iCCI(_Symbol, _Period, CCI_ShortPeriod, PRICE_TYPICAL);
handleEMA       = iMA(_Symbol, _Period, EMAPeriod, 0, MODE_EMA, PRICE_CLOSE);
if(UseATR)
    handleATR = iATR(_Symbol, _Period, ATR_Period);
- This approach ensures that the EA has all necessary data streams to make informed trading decisions during each tick.
The EA includes a feature to restrict trading activity to specific hours, particularly the Tokyo session for USDJPY, helping to avoid trading during low-volume periods that can cause unpredictable price movements. This is implemented by checking the current server time within the OnTick() function. If the session filter is enabled, the code converts the current time into a structured format (MqlDateTime) and compares the hour component against user-defined start and end hours. If the current hour falls outside this window, the EA simply exits, skipping further analysis or trading.
if(UseTokyoSessionFilter && _Symbol == "USDJPY")
{
    datetime now = TimeTradeServer();
    MqlDateTime tm;
    TimeToStruct(now, tm);
    int hr = tm.hour;
    if(hr < TokyoStartHour || hr >= TokyoEndHour)
        return;
}
- Trading only during designated hours helps reduce the risk of slippage and false signals that are common in thin markets during off-peak times.
To prevent multiple evaluations within the same candle, the EA employs a simple but effective logic: it records the timestamp of the last processed bar and only proceeds if a new bar has formed. This is achieved through a static variable lastTime which retains its value across function calls. When a new tick arrives, the code compares the current bar time (iTime()) with this stored value. If they match, the function returns early, ensuring that all calculations and decisions are made once per bar.
static datetime lastTime=0;
datetime t = iTime(_Symbol, _Period, 0);
if(t == lastTime) return; // same bar, skip
lastTime = t;
- By optimizing performance, preventing duplicate signals, and aligning execution with the trader’s typical timeframe-based analysis, this approach enhances the overall efficiency and accuracy of the trading strategy.
On every new bar, the EA calls CopyBuffer() to pull the latest CCI (25), CCI (50) and EMA (34) values (including the prior bar for crossover detection). The slow CCI (50) defines the broader trend, while the fast CCI (25) confirms entry momentum. The EMA filters out noise to ensure price is moving with the trend. If you’ve enabled ATR‑based stops, the EA also retrieves the current ATR (14).
double cciL[2], cciS[1], emaVal[1];
if(CopyBuffer(handleCCI_Long, 0, 0, 2, cciL) < 2) return;
if(CopyBuffer(handleCCI_Short, 0, 0, 1, cciS) < 1) return;
if(CopyBuffer(handleEMA, 0, 0, 1, emaVal) < 1) return;

double atrValue = 0.0;
if(UseATR)
{
    double atrBuf[1];
    if(CopyBuffer(handleATR, 0, 0, 1, atrBuf) < 1) return;
    atrValue = atrBuf[0];
}
- Together, these readings drive all trade decisions: CCIs spot reversals or continuations, the EMA validates trend alignment, and ATR dynamically sizes your risk.
The core of the trading logic revolves around detecting when the long-term CCI crosses its zero line, signaling a potential shift in trend. A crossing upward (from negative to positive) suggests a bullish move, while a crossing downward indicates bearish momentum. The code captures these moments by comparing the previous and current values of the long CCI buffer. Once a cross is detected, the EA applies additional filters: the short CCI must be in agreement (positive for bullish, negative for bearish), and the current price must be above or below the EMA, respectively.
double price = SymbolInfoDouble(_Symbol, SYMBOL_BID);

if(crossUp && cciS[0] > 0 && price > emaVal[0])
    RegisterSignal(true, price, atrValue);
if(crossDown && cciS[0] < 0 && price < emaVal[0])
    RegisterSignal(false, price, atrValue);
- This layered confirmation helps filter out false signals, ensuring trades are entered only when multiple indicators align and the trend filter supports the move.
Once a valid signal is identified, the EA calculates appropriate levels for stop-loss (SL) and take-profit (TP). If ATR-based management is enabled, these levels are dynamically derived by multiplying the current ATR value by the user-defined multiplier (e.g., 1.5). The SL is placed at a distance from the entry price, either below for long trades or above for short trades. The TP is set proportionally farther away based on the risk-reward ratio, typically 1.5 times the SL distance.
double dist = UseATR ? atrValue * ATR_Multiplier : SLBufferPoints * _Point;
double slPrice = isBuy ? price - dist : price + dist;
double tpPrice = isBuy ? price + dist * RiskRewardRatio : price - dist * RiskRewardRatio;
- The EA then creates visual indicators on the chart: arrows just outside the current candle to mark entry points, and horizontal lines showing SL and TP levels.
ObjectCreate(0, name, OBJ_ARROW, 0, barTime, arrowPrice);
ObjectSetInteger(0, name, OBJPROP_ARROWCODE, arrowCode);
ObjectSetInteger(0, name, OBJPROP_COLOR, isBuy ? BuyArrowColor : SellArrowColor);
ObjectCreate(0, "SL_Line", OBJ_HLINE, 0, 0, slPrice);
ObjectCreate(0, "TP_Line", OBJ_HLINE, 0, 0, tpPrice);
- These visual cues help to verify signals visually and ensure the EA’s logic aligns with the actual market conditions.
After plotting visual markers, the EA issues an alert message with detailed information about the trade: entry price, SL, and TP levels.
Alert("CCI ZeroLine EMA + R:R 1:1.5 " + (isBuy ? "BUY" : "SELL") +
      StringFormat(" @%.5f | SL: %.5f | TP: %.5f", price, slPrice, tpPrice));
It also updates internal tracking arrays that store each trade’s SL and TP levels along with a boolean flag indicating whether the trade outcome has been resolved. These arrays are essential for monitoring ongoing trades, especially during backtesting or live trading, allowing the EA to manage multiple open positions simultaneously and evaluate their performance.
signalSL[totalSignals] = slPrice;
signalTP[totalSignals] = tpPrice;
resolved[totalSignals] = false;
The ResolveSignals() function is responsible for tracking active trades. It loops through all open signals, checking recent bars’ high and low prices to see if the SL or TP levels have been hit. If the high exceeds the TP, the trade is marked as a win; if the low breaches the SL, it’s marked as a loss. This process updates counters for total signals and wins, providing statistical feedback on the strategy’s effectiveness. This monitoring is crucial for backtests, where precise outcome recording influences the overall performance metrics like win rate, profit factor, and drawdown.
double high = iHigh(_Symbol, _Period, idx);
double low = iLow(_Symbol, _Period, idx);
if(high >= signalTP[i]) { winSignals++; resolved[i]=true; }
if(low <= signalSL[i]) { resolved[i]=true; }
When the EA is removed or the chart is closed, the OnDeinit() function ensures that all indicator handles are released using IndicatorRelease(). It also deletes any graphical objects created during operation, such as arrows and horizontal lines. Proper resource management prevents memory leaks and keeps the chart uncluttered, ensuring that subsequent runs or other EAs function correctly without residual artifacts.
IndicatorRelease(handleCCI_Long);
IndicatorRelease(handleCCI_Short);
ObjectDelete(0, "SL_Line");
ObjectDelete(0, "TP_Line");
Full Code
//+------------------------------------------------------------------+
//|                                                  CCI Zero-Line EA|
//|                                   Copyright 2025, MetaQuotes Ltd.|
//|                           https://www.mql5.com/en/users/lynnchris|
//+------------------------------------------------------------------+
#property copyright "Copyright 2025, MetaQuotes Ltd."
#property link      "https://www.mql5.com/en/users/lynnchris"
#property version   "1.0"
#property strict

#include <Trade\Trade.mqh>
#include <Tools\Datetime.mqh>

CTrade trade;

//--- Session filter for USDJPY (Tokyo session)
input bool UseTokyoSessionFilter = false;  // enable Tokyo session filter
input int  TokyoStartHour        = 0;      // session start hour (server time)
input int  TokyoEndHour          = 9;      // session end hour   (server time, exclusive)

//--- SL/TP settings
input bool   UseATR           = true;   // true = ATR-based SL/TP, false = fixed points
input int    ATR_Period       = 14;     // ATR look-back
input double ATR_Multiplier   = 1.5;    // SL/TP distance = ATR × this
input double SLBufferPoints   = 10.0;   // fallback SL offset in pips if UseATR=false
input double RiskRewardRatio  = 1.5;    // TP = SL × 1.5 (1:1.5 RR)

//--- Indicator periods
input int CCI_LongPeriod   = 50;  // CCI long period (zero-line cross)
input int CCI_ShortPeriod  = 25;  // CCI short period (confirmation)
input int EMAPeriod        = 34;  // EMA period for trend filter

//--- Arrow colors
input color BuyArrowColor  = clrLime;
input color SellArrowColor = clrRed;

//--- Indicator handles
int handleCCI_Long = INVALID_HANDLE;
int handleCCI_Short= INVALID_HANDLE;
int handleEMA      = INVALID_HANDLE;
int handleATR      = INVALID_HANDLE;

//--- Signal-tracking arrays
int    totalSignals = 0;
int    winSignals   = 0;
int    signalBar[];
double signalSL[];
double signalTP[];
bool   resolved[];

//+------------------------------------------------------------------+
//| Expert initialization                                            |
//+------------------------------------------------------------------+
int OnInit()
  {
   handleCCI_Long  = iCCI(_Symbol, _Period, CCI_LongPeriod, PRICE_TYPICAL);
   handleCCI_Short = iCCI(_Symbol, _Period, CCI_ShortPeriod, PRICE_TYPICAL);
   handleEMA       = iMA(_Symbol, _Period, EMAPeriod, 0, MODE_EMA, PRICE_CLOSE);
   if(handleCCI_Long == INVALID_HANDLE ||
      handleCCI_Short== INVALID_HANDLE ||
      handleEMA      == INVALID_HANDLE)
      return(INIT_FAILED);

   if(UseATR)
     {
      handleATR = iATR(_Symbol, _Period, ATR_Period);
      if(handleATR == INVALID_HANDLE)
         return(INIT_FAILED);
     }

   if(RiskRewardRatio <= 0 ||
      ATR_Multiplier   <= 0 ||
      (SLBufferPoints <= 0 && !UseATR))
      return(INIT_FAILED);

   return(INIT_SUCCEEDED);
  }

//+------------------------------------------------------------------+
//| Expert deinitialization                                          |
//+------------------------------------------------------------------+
void OnDeinit(const int reason)
  {
   if(handleCCI_Long  != INVALID_HANDLE)
      IndicatorRelease(handleCCI_Long);
   if(handleCCI_Short != INVALID_HANDLE)
      IndicatorRelease(handleCCI_Short);
   if(handleEMA       != INVALID_HANDLE)
      IndicatorRelease(handleEMA);
   if(UseATR && handleATR != INVALID_HANDLE)
      IndicatorRelease(handleATR);

   ObjectDelete(0, "SL_Line");
   ObjectDelete(0, "TP_Line");
  }

//+------------------------------------------------------------------+
//| Strategy Tester summary                                          |
//+------------------------------------------------------------------+
double OnTester()
  {
   double winRate = totalSignals > 0
                    ? 100.0 * winSignals / totalSignals
                    : 0.0;
   PrintFormat("=== Backtest Win-Rate ===\nSignals: %d  Wins: %d  Win-Rate: %.2f%%",
               totalSignals, winSignals, winRate);
   return(winRate);
  }

//+------------------------------------------------------------------+
//| Tick handler                                                     |
//+------------------------------------------------------------------+
void OnTick()
  {
// Tokyo session filter for USDJPY
   if(UseTokyoSessionFilter && _Symbol == "USDJPY")
     {
      datetime now = TimeTradeServer();
      MqlDateTime tm;
      TimeToStruct(now, tm);
      int hr = tm.hour;
      if(hr < TokyoStartHour || hr >= TokyoEndHour)
         return;
     }

// Only act on new bar
   static datetime lastTime = 0;
   datetime t = iTime(_Symbol, _Period, 0);
   if(t == lastTime)
      return;
   lastTime = t;

// Copy indicator buffers
   double cciL[2], cciS[1], emaVal[1];
   if(CopyBuffer(handleCCI_Long,  0, 0, 2, cciL)  < 2)
      return;
   if(CopyBuffer(handleCCI_Short, 0, 0, 1, cciS)  < 1)
      return;
   if(CopyBuffer(handleEMA,       0, 0, 1, emaVal) < 1)
      return;

// ATR if needed
   double atrValue = 0.0;
   if(UseATR)
     {
      double atrBuf[1];
      if(CopyBuffer(handleATR, 0, 0, 1, atrBuf) < 1)
         return;
      atrValue = atrBuf[0];
     }

   double price = SymbolInfoDouble(_Symbol, SYMBOL_BID);

// Detect zero-line cross
   bool crossUp   = (cciL[1] < 0 && cciL[0] > 0);
   bool crossDown = (cciL[1] > 0 && cciL[0] < 0);

// Confirm with short CCI & EMA trend filter
   if(crossUp   && cciS[0] >  0 && price > emaVal[0])
      RegisterSignal(true,  price, atrValue);
   if(crossDown && cciS[0] <  0 && price < emaVal[0])
      RegisterSignal(false, price, atrValue);

// Resolve pending signals for SL/TP hits
   ResolveSignals();
  }

//+------------------------------------------------------------------+
//| Register new buy/sell signal                                     |
//+------------------------------------------------------------------+
void RegisterSignal(bool isBuy, double price, double atrVal)
  {
   double dist    = UseATR
                    ? atrVal * ATR_Multiplier
                    : SLBufferPoints * _Point;
   double slPrice = isBuy ? price - dist : price + dist;
   double tpPrice = isBuy
                    ? price + dist * RiskRewardRatio
                    : price - dist * RiskRewardRatio;

// Arrow placement just outside the candle
   datetime barTime = iTime(_Symbol, _Period, 0);
   double   barHigh = iHigh(_Symbol, _Period, 0);
   double   barLow  = iLow(_Symbol, _Period, 0);
   double   offset  = 5 * _Point;  // e.g. 5-pip offset

   double arrowPrice = isBuy
                       ? barLow  - offset
                       : barHigh + offset;

// Use numeric arrow codes directly
   int arrowCode = isBuy ? 233 : 234;

   string name = (isBuy ? "BUY_" : "SELL_")
                 + TimeToString(TimeTradeServer(), TIME_SECONDS);
   ObjectCreate(0, name, OBJ_ARROW, 0, barTime, arrowPrice);
   ObjectSetInteger(0, name, OBJPROP_ARROWCODE, arrowCode);
   ObjectSetInteger(0, name, OBJPROP_COLOR,     isBuy ? BuyArrowColor : SellArrowColor);
   ObjectSetInteger(0, name, OBJPROP_WIDTH,     2);

// Draw SL/TP lines
   DrawLine("SL_Line", slPrice, clrRed);
   DrawLine("TP_Line", tpPrice, clrLime);

// Alert
   Alert("CCI ZeroLine EMA + R:R 1:1.5 "
         + (isBuy ? "BUY" : "SELL")
         + StringFormat(" @%.5f | SL: %.5f | TP: %.5f",
                        price, slPrice, tpPrice));

// Track for backtest metrics
   totalSignals++;
   ArrayResize(signalBar,  totalSignals);
   ArrayResize(signalSL,   totalSignals);
   ArrayResize(signalTP,   totalSignals);
   ArrayResize(resolved,   totalSignals);

   signalBar[totalSignals-1] = 0;
   signalSL[totalSignals-1]  = slPrice;
   signalTP[totalSignals-1]  = tpPrice;
   resolved[totalSignals-1]  = false;
  }

//+------------------------------------------------------------------+
//| Resolve pending signals (SL/TP checks)                           |
//+------------------------------------------------------------------+
void ResolveSignals()
  {
   int bars = Bars(_Symbol, _Period);
   for(int i = 0; i < totalSignals; i++)
     {
      if(resolved[i])
         continue;
      signalBar[i]++;
      int idx = signalBar[i];
      if(idx >= bars)
         continue;

      double high = iHigh(_Symbol, _Period, idx);
      double low  = iLow(_Symbol, _Period, idx);

      if(high >= signalTP[i])
        {
         winSignals++;
         resolved[i] = true;
        }
      else
         if(low <= signalSL[i])
           {
            resolved[i] = true;
           }
     }
  }

//+------------------------------------------------------------------+
//| Draw a horizontal SL/TP line                                     |
//+------------------------------------------------------------------+
void DrawLine(string name, double price, color clr)
  {
   if(ObjectFind(0, name) >= 0)
      ObjectDelete(0, name);
   ObjectCreate(0, name, OBJ_HLINE, 0, 0, price);
   ObjectSetInteger(0, name, OBJPROP_COLOR, clr);
   ObjectSetInteger(0, name, OBJPROP_WIDTH, 2);
   ObjectSetString(0, name, OBJPROP_TEXT, name);
  }
//+------------------------------------------------------------------+
Testing
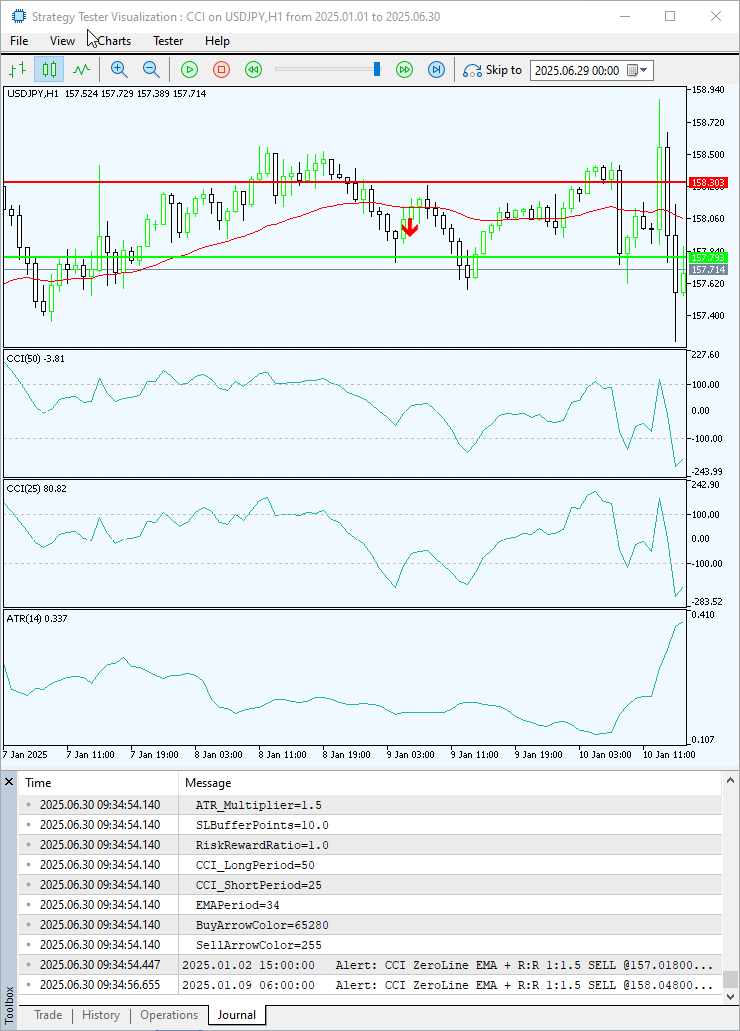
Below are the backtesting results for our EA.
I have backtested the EA on USDJPY, and the following are the logs from the journal.
- Inputs
2025.06.30 09:34:54.140   UseTokyoSessionFilter=false
2025.06.30 09:34:54.140   TokyoStartHour=0
2025.06.30 09:34:54.140   TokyoEndHour=9
2025.06.30 09:34:54.140   UseATR=true
2025.06.30 09:34:54.140   ATR_Period=14
2025.06.30 09:34:54.140   ATR_Multiplier=1.5
2025.06.30 09:34:54.140   SLBufferPoints=10.0
2025.06.30 09:34:54.140   RiskRewardRatio=1.0
2025.06.30 09:34:54.140   CCI_LongPeriod=50
2025.06.30 09:34:54.140   CCI_ShortPeriod=25
2025.06.30 09:34:54.140   EMAPeriod=34
2025.06.30 09:34:54.140   BuyArrowColor=65280
2025.06.30 09:34:54.140   SellArrowColor=255
The configuration indicates that the Tokyo session filter is disabled, allowing trades to occur outside specific Tokyo hours; however, if enabled, trading would be restricted between 00:00 and 09:00 Tokyo time. The Expert Advisor utilizes the ATR indicator with a period of 14, applying a multiplier of 1.5 to adjust stop-loss and take-profit levels based on current market volatility. A buffer of 10 points is added to the stop-loss to mitigate premature exits, while the risk-reward ratio is set to 1:1, balancing potential gains and losses.
The Commodity Channel Index (CCI) employs a period of 50 for long signals and 25 for short signals, and an Exponential Moving Average (EMA) with a period of 34 is included in the strategy. Visual signals are represented by arrows, with green indicating buy signals and blue representing sell signals, corresponding to their respective color codes.
The inputs can be customized according to your preferences. The settings provided are the ones I used during testing, which yielded results I consider to be favorable.
- Signals
2025.06.30 09:34:54.447 2025.01.02 15:00:00   Alert: CCI ZeroLine EMA + R:R 1:1.5 SELL @157.01800 | SL: 157.45075 | TP: 156.58525
2025.06.30 09:34:56.655 2025.01.09 06:00:00   Alert: CCI ZeroLine EMA + R:R 1:1.5 SELL @158.04800 | SL: 158.30343 | TP: 157.79257
2025.06.30 09:40:35.572 2025.01.29 07:00:00   Alert: CCI ZeroLine EMA + R:R 1:1.5 SELL @155.21100 | SL: 155.47704 | TP: 154.94496
2025.06.30 09:40:36.759 2025.01.31 07:00:00   Alert: CCI ZeroLine EMA + R:R 1:1.5 BUY @154.68200 | SL: 154.25439 | TP: 155.10961
2025.06.30 09:40:45.870 2025.02.26 06:00:00   Alert: CCI ZeroLine EMA + R:R 1:1.5 BUY @149.42600 | SL: 149.05400 | TP: 149.79800
2025.06.30 09:40:46.737 2025.02.28 03:00:00   Alert: CCI ZeroLine EMA + R:R 1:1.5 SELL @149.51900 | SL: 150.03650 | TP: 149.00150
2025.06.30 09:40:49.726 2025.03.06 01:00:00   Alert: CCI ZeroLine EMA + R:R 1:1.5 SELL @149.14200 | SL: 149.68200 | TP: 148.60200
2025.06.30 09:40:58.522 2025.03.21 16:00:00   Alert: CCI ZeroLine EMA + R:R 1:1.5 SELL @148.97200 | SL: 149.35418 | TP: 148.58982
2025.06.30 09:41:01.363 2025.04.01 00:00:00   Alert: CCI ZeroLine EMA + R:R 1:1.5 BUY @149.93500 | SL: 149.57425 | TP: 150.29575
2025.06.30 09:41:16.557 2025.04.28 13:00:00   Alert: CCI ZeroLine EMA + R:R 1:1.5 SELL @143.33500 | SL: 143.69232 | TP: 142.97768
2025.06.30 09:41:36.021 2025.06.18 14:00:00   Alert: CCI ZeroLine EMA + R:R 1:1.5 SELL @144.85500 | SL: 145.08911 | TP: 144.62089
2025.06.30 09:41:37.454 2025.06.23 19:00:00   Alert: CCI ZeroLine EMA + R:R 1:1.5 SELL @146.15000 | SL: 146.65711 | TP: 145.64289
2025.06.30 09:41:38.360 2025.06.25 23:00:00   Alert: CCI ZeroLine EMA + R:R 1:1.5 SELL @145.21700 | SL: 145.47286 | TP: 144.96114
- Win rate
2025.06.30 09:41:39.206 2025.06.29 23:59:59 Signals: 13 Wins: 10 Win-Rate: 76.92%
Below is a GIF visualizing the test outcomes: red downward arrows indicate sell signals, green upward arrows represent buy signals, red lines denote stop-loss levels, and green lines indicate take-profit targets.
Conclusion
In wrapping up, this CCI Zero‑Line EA puts everything you need for clear, rule‑driven entries right on your chart:
- We use CCI (50) to sense the bigger trend and CCI (25) to confirm that momentum is ready, so we only act when both lines up.
- The 34‑period EMA keeps us from chasing random spikes. If price closes on the right side of that line, we know the trend is genuine.
- With ATR‑based stops, our stop‑loss distance flexes with volatility, tight in calm markets, wider when things kick off. Our profit target stays in proportion, locking in a steady reward ratio.
That combination means arrows only appear when price, momentum and volatility all point the same way. You get fewer false signals, responsive risk management, and total transparency on why each entry and exit level was chosen. Fine‑tune CCI periods, EMA length or ATR multiplier to suit any symbol or timeframe, and trade with the confidence of a tool built on solid, multi‑layered analysis. This EA is intended for educational purposes only. Do not deploy it to the live market without thorough backtesting on historical data or testing on demo accounts. Ensure that you are satisfied with the results before considering any live trading.
Warning: All rights to these materials are reserved by MetaQuotes Ltd. Copying or reprinting of these materials in whole or in part is prohibited.
This article was written by a user of the site and reflects their personal views. MetaQuotes Ltd is not responsible for the accuracy of the information presented, nor for any consequences resulting from the use of the solutions, strategies or recommendations described.

- Free trading apps
- Over 8,000 signals for copying
- Economic news for exploring financial markets
You agree to website policy and terms of use