
Quantitative analysis in MQL5: Implementing a promising algorithm

What is quantitative analysis in the financial market
What is quantitative analysis in the financial market? Quantitative analysis appeared as a kind of forerunner of machine learning, being in fact a subsection of statistical learning. Back in the days when computers just began to appear, took up an entire room, and worked on punched cards, progressive minds were trying to adapt them for analyzing big data and statistics. At that time the set of statistical operations and functions through which prices could be run was extremely small, the functions themselves were quite simple, and the patterns found were not particularly complex.
These studies were simple calculations to identify certain relationships in the data, mostly linear.
The simplest and easiest to learn method of quantitative analysis in financial markets is the analysis of the spread between related assets. For example, we can plot a spread between two correlated assets and, using quantitative analysis, find the average, maximum and median deviation of this spread. Having received a quantitative description of the data, we can understand how much one asset has deviated from the other, and roughly understand the equilibrium state of the two assets, where they both will definitely return when the discrepancy between them is eliminated (when the assets move towards each other). In general, the use of quantitative analysis in pairs trading is a very interesting topic; we will definitely touch on this point in future articles.
How quantitative analysis is used by hedge funds
The first attempt to use quantitative analysis was Edward O. Thorp's practice, who in the 1970s learned to analyze the spread between a stock and a warrant on that stock, calculating how overvalued or undervalued the asset is relative to its warrant. Thorp's computer at that time occupied an entire room, and also ran on punch cards. Edward O. Thorp was generally the first to apply computer quantitative analysis to financial markets. It was a breakthrough of that time, recognized by the whole world. Thorp created the world's first "quantitative" hedge fund.
As you understand, the first example of quantitative analysis in the stock market that comes to our mind is its application in pairs trading, or basket trading. We will definitely consider these options, but today's quantitative analysis algorithm will be based on other principles.
How else do major market participants use quantitative analysis?
Statistical arbitrage allows them to detect differences in the prices of financial instruments in different markets or at different points in time. This allows funds to identify and take advantage of profitable trading opportunities across a variety of related markets. In addition, quantitative models help hedge funds predict future market movements based on statistical data, which helps them make informed trading decisions.
Risk management is another extremely important application of quantitative analysis. Hedge funds use models to evaluate and manage risk in their portfolios. They optimize the asset structure based on risk to minimize potential losses. There are different examples of this, such as portfolio optimization according to the Markowitz portfolio theory (which is based on the risk so that the deviation of the portfolio does not exceed the potential profit) and risk management according to the VaR system. The latter is a unique model that allows us to calculate the drawdown, which we will not exceed with a chance of 99%.
Of course, the real market is sometimes quite difficult to describe using mathematics, so there are also negative examples. The LTCM hedge fund in 1998 calculated that its positions would not bring a large loss and entered with an arbitrage strategy targeting spread between long-term and near-term US bonds based on quantitative analysis. Russia defaulted, Asia had crisis, and as a result, this, through the butterfly effect, led to panic in the US government bond market. The LTCM fund used models that suggested that the spread was abnormally high, that the price would definitely "roll back" in the opposite direction, and the fund's positions would definitely be closed with a profit.
As a result, the fund applied averaging, extremely aggressively gained a large leverage, loading up on debt with assets, and blew up, although Nobel laureates on the company's staff spoke about the impossibility of such an outcome. This was the case when one quantitative analysis model entitled VaR almost destroyed the entire US market. Fed Chairman Alan Greenspan had to urgently call the heads of the largest US banks to buy out the fund's marginal positions, otherwise, the sale of such a huge pool of assets "to the market" would have caused an immediate reset of the US stock market and panic worse than the Great Depression.
Therefore, when applying quantitative analysis and averaging of any indicators, it is important to remember the tails of the normal probability distribution. The bell-shaped probability curve, in the case of financial markets, has "fat tails" that reflect significant deviations which are also referred to as :black swans". On the one hand, they are statistically extremely unlikely, on the other hand, the scale and power of these events can destroy investors' portfolios and hedge-fund portfolios, eliminate marginal positions, destroy markets and change them in each new cycle. We saw this in 1998, 2008, 2020, and 2022. Furthermore, we will see this many times in the future.
Quantitative analysis gives hedge funds quite a lot and is constantly used by them in their daily work. But it is important to remember there are no such functions that are capable of calculating the decisions of millions of people, their panic, and reactions to certain events. It is also important to remember about the tails of the normal distribution, which can ruin the deposit when using aggressive trading tactics.
Algorithm basis: counting movement waves
The basis of our idea was first expressed by trader Artem Zvezdin, who calculates the size of price movement waves in order to understand how overvalued or undervalued an asset is in relation to itself. For example, we count bullish and bearish waves over the last 500-5000 bars to understand how far the price moved in each of its small cycles. Each cycle of price movement reflects someone's positions, someone's money, and buy or sell decisions. Each new cycle is a new birth and death of the market. We will use the idea of analyzing price movements without rollbacks, from top to bottom. This is a separate set of participants that act approximately the same, so we hypothesize that the length of the cycles will always be roughly the same. We will calculate the average price movement using the ZigZag indicator, which is included in the standard MetaTrader 5 terminal package.
Let's look at the Expert Advisor that I created as part of this article. First, take a look at the header part of the EA. The settings here are quite straightforward. For trading we use the standard Trade library. For lot settings, you can specify either a lot to trade a fixed lot or lot calculation based on the balance value. If you indicate a closing profit greater than 0, then the EA will close trades based on the total profit. Stop loss and take profit are calculated based on the ATR value, that is, the depend on the current volatility of the instrument. The ZigZag settings for the EA's calculations are generally standard; we will not dwell on them. Also, please note that our EA template is multi-currency, capable of working on a variety of assets. We need this to reduce the overall risk by trading baskets of related assets in future versions of the Expert Advisor. The current version 0.90 will only work on one symbol.
//+------------------------------------------------------------------+
//|                                          QuantAnalysisSample.mq5 |
//|                                                   Copyright 2023 |
//|                                                Evgeniy Koshtenko |
//+------------------------------------------------------------------+
#property copyright   "Copyright 2023, Evgeniy Koshtenko"
#property link        "https://www.mql5.com"
#property version     "0.90"
#property strict

#include <Trade\Trade.mqh>
#include <Graphics\Graphic.mqh>
#include <Math\Stat\Normal.mqh>
#include <Math\Stat\Math.mqh>
CTrade trade;
//--- Inputs
input double Lots       = 0.1;      // lot
input double Risk       = 0.1;     // risk
input double Profit     = 0;     // profit
input int StopLoss      = 0;        // ATR stop loss
input int TakeProfit    = 0;        // ATR take profit
input string Symbol1    = "EURUSD";
input int    Magic      = 777;    // magic number
//--- Indicator inputs
input uint   InpDepth       =  120;   // ZigZag Depth
input uint   InpDeviation   =  50;    // ZigZag Deviation
input uint   InpBackstep    =  30;    // ZigZag Backstep
input uchar  InpPivotPoint  =  1;    // ZigZag pivot point
datetime t=0;
double last=0;
double countMovements;
double currentMovement;
// Global variable for storing the indicator descriptor
int zigzagHandle;
Now let's look at the remaining functions of the EA. The functions of initialization and deinitialization are generally simple and understandable. We set the EA's magic number, a unique identifier that will allow the EA to distinguish its orders from others. At the same time, we set the handle in an additional self-written function, because if we load a multicurrency handle directly via OnInit, the EA will throw an error. That's why we use this fairly simple and easy solution.
//+------------------------------------------------------------------+
//| Expert initialization function                                   |
//+------------------------------------------------------------------+
int OnInit()
  {
   trade.SetExpertMagicNumber(Magic);
   return(INIT_SUCCEEDED);
  }
//+------------------------------------------------------------------+
//| Expert initialization function custom                            |
//+------------------------------------------------------------------+
int OnIniti(string symb)
  {// Loading the ZigZag indicator
   zigzagHandle = iCustom(symb, _Period, "ZigZag", InpDepth, InpDeviation, InpBackstep, InpPivotPoint);
   if (zigzagHandle == INVALID_HANDLE)
     {
      Print("Error loading the ZigZag indicator: ", GetLastError());
      return(INIT_FAILED);
     }
   return(INIT_SUCCEEDED);
  }
//+------------------------------------------------------------------+
//| Expert deinitialization function                                 |
//+------------------------------------------------------------------+
void OnDeinit(const int reason)
  {
   Comment("");
  }
Let's look at other functions of the Expert Advisor. Next we have functions for calculating the total profit for all positions, and a function for closing all orders completely:
//+------------------------------------------------------------------+
//|  Position Profit                                                 |
//+------------------------------------------------------------------+
double AllProfit(int type=-1)
  {
   double p=0;

    for(int i=PositionsTotal()-1; i>=0; i--)
     {
      if(PositionSelectByTicket(PositionGetTicket(i)))
        {
         if(PositionGetInteger(POSITION_MAGIC)==Magic)
           {
            if(PositionGetInteger(POSITION_TYPE)==type || type==-1)
               p+=PositionGetDouble(POSITION_PROFIT);
           }
        }
     }

   return(p);
  }
//+------------------------------------------------------------------+
//|   CloseAll                                                       |
//+------------------------------------------------------------------+
void CloseAll(int type=-1)
  {
   for(int i=PositionsTotal()-1; i>=0; i--)
     {
      if(PositionSelectByTicket(PositionGetTicket(i)))
        {
         if(PositionGetInteger(POSITION_MAGIC)==Magic)
           {
            if(PositionGetInteger(POSITION_TYPE)==type || type==-1)
               trade.PositionClose(PositionGetTicket(i));
           }
        }
     }
  }
Next, we have the lot calculation function and the function for calculating the number of open positions:
//+------------------------------------------------------------------+
//|     CountTrades                                                  |
//+------------------------------------------------------------------+
int CountTrades(string symb)
  {
   int count=0;

   for(int i=PositionsTotal()-1; i>=0; i--)
     {
      if(PositionSelectByTicket(PositionGetTicket(i)))
        {
         if(PositionGetString(POSITION_SYMBOL)==symb)
           {
            count++;
           }
        }
     }
   return(count);
  }
//+------------------------------------------------------------------+
//|     Lot                                                          |
//+------------------------------------------------------------------+
double Lot()
  {
   double lot=Lots;

   if(Risk>0)
      lot=AccountInfoDouble(ACCOUNT_BALANCE)*Risk/100000;

   return(NormalizeDouble(lot,2));
  }
We also have functions for calculating the last deal price for Buys and Sells (we will use this later) and a function for determining the direction of the position.
//+------------------------------------------------------------------+
//|                                                                  |
//+------------------------------------------------------------------+
double FindLastBuyPrice(string symb)
  {
   double pr=0;

   for(int i=PositionsTotal()-1; i>=0; i--)
     {
      if(PositionSelectByTicket(PositionGetTicket(i)) && PositionGetInteger(POSITION_TYPE)==0)
        {
         if(PositionGetString(POSITION_SYMBOL)==symb)
           {
            pr=PositionGetDouble(POSITION_PRICE_OPEN);
            break;
           }
        }
     }
   return(pr);
  }
//+------------------------------------------------------------------+
//|                                                                  |
//+------------------------------------------------------------------+
double FindLastSellPrice(string symb)
  {
   double pr=0;

   for(int i=PositionsTotal()-1; i>=0; i--)
     {
      if(PositionSelectByTicket(PositionGetTicket(i)) && PositionGetInteger(POSITION_TYPE)==1)
        {
         if(PositionGetString(POSITION_SYMBOL)==symb)
           {
            pr=PositionGetDouble(POSITION_PRICE_OPEN);
            break;
           }
        }
     }
   return(pr);
  }
//+------------------------------------------------------------------+
//|  PositionType                                                    |
//+------------------------------------------------------------------+
int PositionType(string symb)
  {
   int type=8;

   for(int i=PositionsTotal()-1; i>=0; i--)
     {
      if(PositionSelectByTicket(PositionGetTicket(i)))
        {
         if(PositionGetString(POSITION_SYMBOL)==symb)
           {
            type=(int)PositionGetInteger(POSITION_TYPE);
            break;
           }
        }
     }
   return(type);
  }
And of course, our most important function is the function of calculating the average and current movement. They are calculated not in points, but in the amount of movement of a price unit, for convenience. It's simple: we call our "custom initialization", copy the buffers, and in the for loop we calculate the size of the price movement from the top of ZigZag to its last extremum. The function outputs the current movement in units of price movement and the average movement.
//+------------------------------------------------------------------+ //| CalculateAverageMovement | //+------------------------------------------------------------------+ void CalculateAverageMovement(string symb, double &averageMovement, double ¤tMovement) { const int lookback = 500; // Number of bars for analysis double sumMovements = 0.0; int countMovements = 0; double lastExtremePrice = 0.0; double zigzagArray[500]; // Array to store ZigZag values OnIniti(symb); // Copy ZigZag values to array if (CopyBuffer(zigzagHandle, 0, 0, lookback, zigzagArray) <= 0) { Print("Error copying indicator data"); averageMovement = -1; currentMovement = -1; return; } // Copy ZigZag values to array if (CopyBuffer(zigzagHandle, 0, 0, lookback, zigzagArray) <= 0) { Print("Error copying indicator data"); averageMovement = -1; currentMovement = -1; return; } for (int i = 0; i < lookback; i++) { if (zigzagArray[i] != 0 && zigzagArray[i] != lastExtremePrice) { if (lastExtremePrice != 0) { // Determine the movement direction double movement = zigzagArray[i] - lastExtremePrice; sumMovements += movement; countMovements++; } lastExtremePrice = zigzagArray[i]; } } // Calculate the current movement double lastMovement = iClose(symb, _Period, 0) - lastExtremePrice; currentMovement = lastMovement; // Calculate the average movement averageMovement = countMovements > 0 ? sumMovements / countMovements : 0.0; // Print the result Print("Average movement: ", averageMovement); Print("Current movement: ", currentMovement); // Release resources IndicatorRelease(zigzagHandle); }
Another function which is among the key ones is the function of multicurrency trading based on signals showing that the current price movement exceeds its average value. Take profit and stop loss are set based on ATR. Also, ATR is used for grid steps (averaging). Trades are opened on new bars. This is important for us. This function is then called in OnTick and works on either one or several symbols. I haven't been able to successfully run the EA on several symbols yet, as I already said, I will use only one symbol on which the EA is launched. This symbol should be specified in the EA settings.
//+------------------------------------------------------------------+
//| Expert Trade unction                                             |
//+------------------------------------------------------------------+
void Trade(string symb)
  {
   double averageMovement = 0;
   double currentMovement = 0;
   double pr=0,sl=0,tp=0,hi=0,lo=0;
// Call function for calculation
   CalculateAverageMovement(symb, averageMovement, currentMovement);

// Use results
   double Ask = SymbolInfoDouble(symb, SYMBOL_ASK);
   double Bid = SymbolInfoDouble(symb, SYMBOL_BID);
   int dg=(int)SymbolInfoInteger(symb,SYMBOL_DIGITS);
   double pp=SymbolInfoDouble(symb,SYMBOL_POINT);

   double atr = iATR(symb, PERIOD_CURRENT, 3);

// Here define your logic for buying and selling
   bool sell  = currentMovement > -averageMovement; // Buy condition
   bool buy = -currentMovement > averageMovement; // Sell condition

   if(AllProfit()>Profit && Profit>0)
      CloseAll();

   if(t!=iTime(symb,PERIOD_CURRENT,0))
     {
      if(buy && CountTrades(symb)<1)
        {
         if(StopLoss>0)
            sl=NormalizeDouble(Bid-(atr*StopLoss)*Point(),_Digits);
         if(TakeProfit>0)
            tp=NormalizeDouble(Bid+(atr*TakeProfit)*Point(),_Digits);
         pr=NormalizeDouble(Bid,dg);
         trade.Buy(Lot(),symb,pr,sl,tp,"");
         last=pr;
        }
      if(sell && CountTrades(symb)<1)
        {
         if(StopLoss>0)
            sl=NormalizeDouble(Ask+(atr*StopLoss)*Point(),_Digits);
         if(TakeProfit>0)
            tp=NormalizeDouble(Ask-(atr*TakeProfit)*Point(),_Digits);
         pr=NormalizeDouble(Ask,dg);
         trade.Sell(Lot(),symb,Ask,sl,tp,"");
         last=pr;
        }
      if(CountTrades(symb)>0)
        {
         if(PositionType(symb)==0 && (FindLastBuyPrice(symb)-Ask)/pp>=atr*30)
           {
            if(StopLoss>0)
               sl=NormalizeDouble(Bid-(atr*StopLoss)*Point(),_Digits);
            if(TakeProfit>0)
               tp=NormalizeDouble(Bid+(atr*TakeProfit)*Point(),_Digits);
            trade.Buy(Lot(),symb,Ask,sl,tp);
           }
         if(PositionType(symb)==1 && (Bid-FindLastSellPrice(symb))/pp>=atr*30)
           {
            if(StopLoss>0)
               sl=NormalizeDouble(Ask+(atr*StopLoss)*Point(),_Digits);
            if(TakeProfit>0)
               tp=NormalizeDouble(Ask-(atr*TakeProfit)*Point(),_Digits);
            trade.Sell(Lot(),symb,Bid,sl,tp);
           }
        }
      t=iTime(symb,0,0);
     }
  }
Testing the model
It's time for the fun part: we will test our model on the real market. Please note that loop-based calculations are quite processor-intensive, so it makes more sense to run the EA only on opening prices. Let's run a single test on EURUSD, open prices, H1 timeframe, from January 1, 2020 to December 6, 2023:
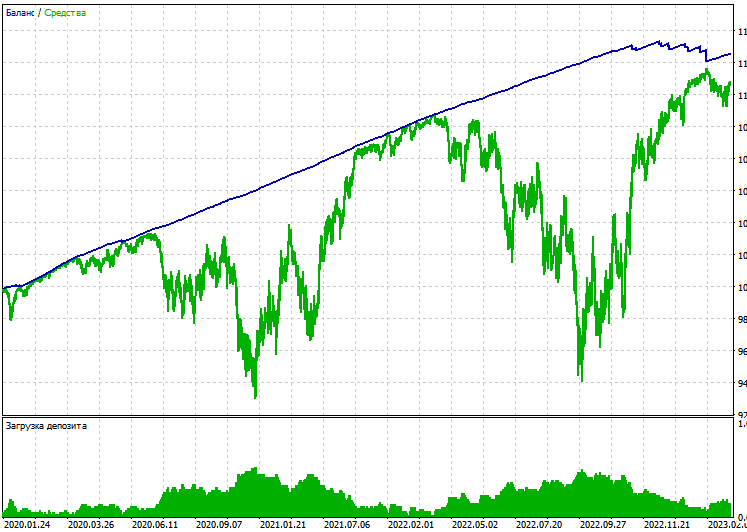
A single test is profitable, but the drawdown is high. No one would like to take extra risks when trading. Remember that we also have a profit-based closing. We can run a test on a netting account
To run a test with profit-based closing, set closing with a profit above 0. Let's try testing. Perhaps we will get a stable test. Run the EA on the same asset at open prices. Our account type is hedging. And this is what we see:
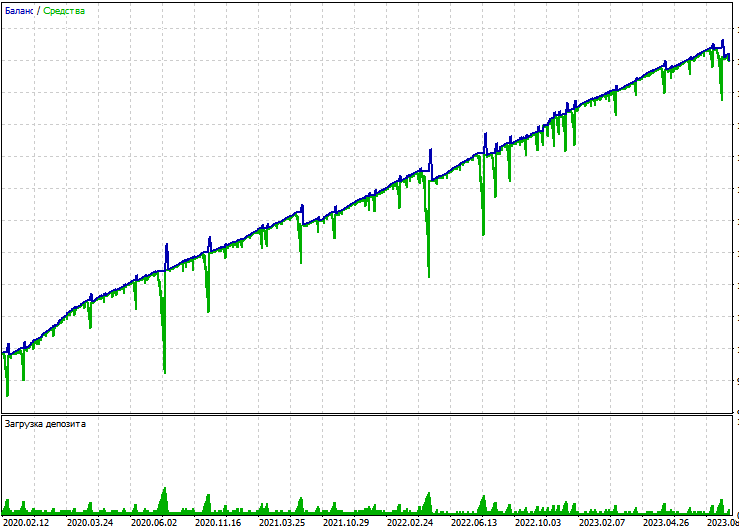
The EA turned out to be extremely risky because of the averaging. Let's try to run the same test on a netting account.
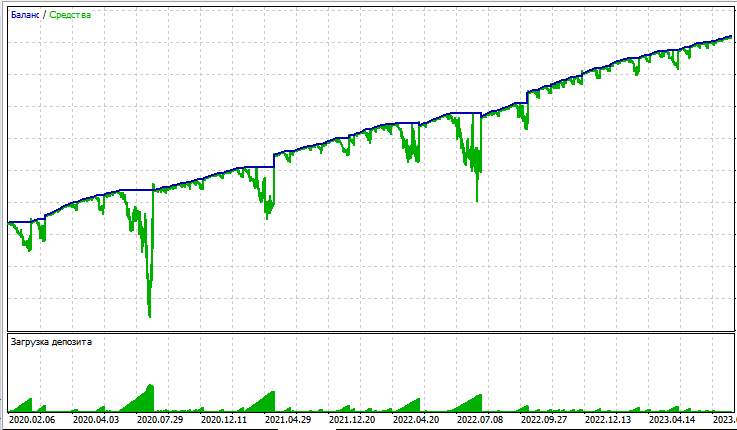
Again we have a large drawdown; the profit is completely not worth the risk. Let's try to revise the code. This time we will implement closing by a signal (when a bullish signal changes to a bearish one, previous positions will be closed). We add closing by profit using the following code:
if (CloseSig)
   {
      if (buy)
         CloseAll(1);
      if (sell)
         CloseAll(0);
   }
And add this setting:
input bool CloseSig = 1; // close by signal
Repeat the test. The results are not good again:
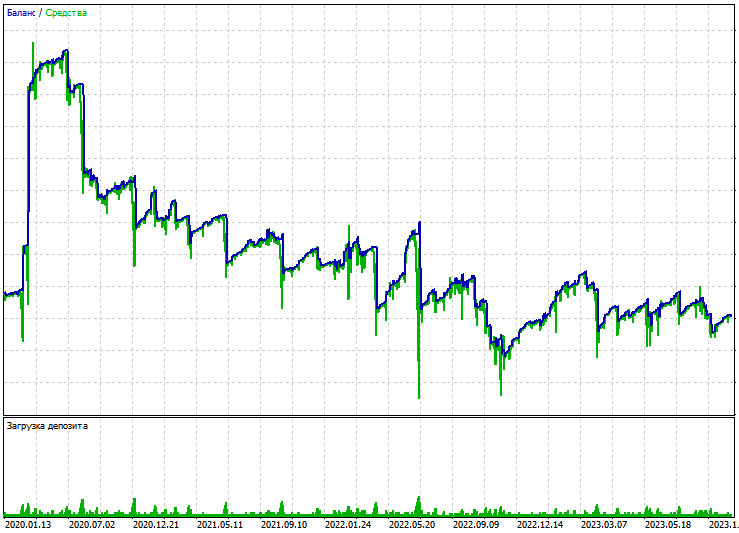
Testing in general cannot be called ideal. The drawdown is huge, there are large drawdowns on both the netting and hedging accounts. Furthermore, closing based on a signal does not generate any positive results and is generally unprofitable. This is quite upsetting.
Conclusion
We have looked at a simple example of creating a basic and simple quantitative analysis algorithm in MQL5. We counted price movement waves, compared them with average values, and based on this data made a decision to buy or sell. Unfortunately, this resulted in a loss-making algorithm, although the basis of the idea was pretty good. In future articles we will continue our exploration of quantitative analysis.
Translated from Russian by MetaQuotes Ltd.
Original article: https://www.mql5.com/ru/articles/13835
Warning: All rights to these materials are reserved by MetaQuotes Ltd. Copying or reprinting of these materials in whole or in part is prohibited.
This article was written by a user of the site and reflects their personal views. MetaQuotes Ltd is not responsible for the accuracy of the information presented, nor for any consequences resulting from the use of the solutions, strategies or recommendations described.

- Free trading apps
- Over 8,000 signals for copying
- Economic news for exploring financial markets
You agree to website policy and terms of use