
Data Science and Machine Learning(Part 14): Finding Your Way in the Markets with Kohonen Maps

Introduction
Kohonen Maps or Self-Organizing maps(SOM) or Self-Organizing Feature Map(SOFM). Is an unsupervised machine learning technique used to produce a low-dimensional(typically two-dimensional) representation of a higher dimensional data set while preserving the topological structure of the data. For example; A dataset with p variables measured in n observations could be represented as clusters of observations with similar values for the variables. These clusters then could be visualized as a "two-dimensional map" such that observations in proximal clusters have more similar values than the observations in distal clusters, This can make high-dimensional data easier to visualize and analyze.
Kohonen maps were developed by a Finnish mathematician known as Teuvo Kohonen in the 1980s.
Overview
A Kohonen map consists of a grid of neurons that are connected to its neighboring neurons, During training, the input data is presented to the network, and each neuron calculates its similarity to the input data. The neuron with the highest similarity is called the winner and its weights are adjusted to better match the input data.

Over time, the neighboring neurons also adjust their weights to become more similar to the winner neuron, resulting in a topological ordering of the neurons in the map. This process of self-organization allows the Kohonen map to represent complex relationships between the input data in a lower dimensional space. Making it useful for data visualization and clustering.
Learning Algorithm
The goal of this algorithm in the self-organizing map is to cause different parts of the network to respond similarly to certain input patterns. This is partially motivated by how visuals, auditory and other information are handled in some parts of the human brain.
Let's see how this Algorithm works when it comes to mathematical terms and MQL5 code.
Steps Involved in the Algorithm
There are four major steps to consider when attempting to code this algorithm:
Step 01: Initialize the weights ![]() . Random values may be assumed. Other parameters such as the learning rate and number of clusters are also initialized at this stage.
. Random values may be assumed. Other parameters such as the learning rate and number of clusters are also initialized at this stage.
CKohonenMaps::CKohonenMaps(matrix &matrix_, bool save_clusters=true, uint clusters=2, double alpha=0.01, uint epochs=100)
 {
   Matrix = matrix_;

   n = (uint)matrix_.Cols();
   rows = matrix_.Rows();
   m = clusters;

   cluster_tensor = new CTensors(m);

   w_matrix =matrix_utils.Random(0.0, 1.0, n, m, RANDOM_STATE);
 }
As usual, the parameters are initialized in the Kohonen maps class constructor.
Kohonen maps is a data mining technique. After its all said and done, We need to obtain the mined data that's why you see the boolean argument save_clusters=true this will let us get the clusters that Kohonen maps have obtained for us.
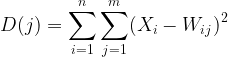
Step 02: Calculate the Euclidean distance between each and every inputs to their respective weights
where:
![]() = Input vector
= Input vector
![]() = Weights vector
= Weights vector
double CKohonenMaps:: Euclidean_distance(const vector &v1, const vector &v2)
  {
   double dist = 0;

   if(v1.Size() != v2.Size())
      Print(__FUNCTION__, " v1 and v2 not matching in size");
   else
     {
      double c = 0;
      for(ulong i=0; i<v1.Size(); i++)
         c += MathPow(v1[i] - v2[i], 2);

      dist = MathSqrt(c);
     }

   return(dist);
  }
To apply this formula and clarify everything we need a simple dataset to help us in coding and testing things out.
   matrix Matrix = {
                     {1.2, 2.3},
                     {0.7, 1.8},
                     {3.6, 4.8},
                     {2.8, 3.9},
                     {5.2, 6.7},
                     {4.8, 5.6}
                   };

   maps = new CKohonenMaps(Matrix); //Giving our kohonen maps class data
When the constructor is called and the weights are generated below are the output.
CS      0       15:52:27.572    Self Organizing map (EURUSD,H1) w Matrix
CS      0       15:52:27.572    Self Organizing map (EURUSD,H1) [[0.005340739158299509,0.01220740379039888]
CS      0       15:52:27.572    Self Organizing map (EURUSD,H1)  [0.5453352458265939,0.9172643208105716]]
CS      0       15:52:27.572    Self Organizing map (EURUSD,H1) Matrix
CS      0       15:52:27.572    Self Organizing map (EURUSD,H1) [[1.2,2.3]
CS      0       15:52:27.572    Self Organizing map (EURUSD,H1)  [0.7,1.8]
CS      0       15:52:27.572    Self Organizing map (EURUSD,H1)  [3.6,4.8]
CS      0       15:52:27.572    Self Organizing map (EURUSD,H1)  [2.8,3.9]
CS      0       15:52:27.572    Self Organizing map (EURUSD,H1)  [5.2,6.7]
CS      0       15:52:27.572    Self Organizing map (EURUSD,H1)  [4.8,5.6]]
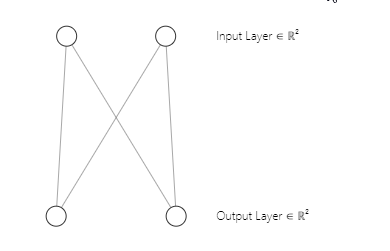
You may have noticed that our neural network architecture is a [2 inputs and 2 outputs] That's why we have a 2x2 matrix of weights. This matrix was generated considering [2 input matrix columns marked n and 2 clusters selected marked m]. from the below line of code we saw in the first part.
w_matrix =matrix_utils.Random(0.0, 1.0, n, m, RANDOM_STATE);Just to clarify, Below is how our Kohonen maps neural network architecture looks like;
Step 03:Find the winning unit index i so that D(j) is minimum. In simple words find the unit cluster, this brings me to an important subject on kohonen maps competitive learning.
Competitive Learning.
A self-organizing map is a type of artificial neural network that unlike others types of artificial neural networks that are trained using error-correction learning such as backpropagation with gradient descent in it, Kohonen maps are trained using competitive learning.
In competitive learning, neurons in the Kohonen map compete with each other to become the "winner" by being the neuron that is most similar to the input data.
During the training phase, each input data point is presented to the Kohonen map, and the similarity between the input data and each neuron's weight vector is computed. The neuron whose weight vector is most similar to the input data is called the winner or the "best-matching unit" (BMU).
The BMU is selected based on the smallest Euclidean distance between the input data and the neuron's weight vector. The winning neuron then updates its weight vector to become more similar to the input data. The weight update formula used is known as the Kohonen learning rule, which moves the weight vector of the winning neuron and its neighboring neurons closer to the input data.
To code this step 03. It takes a few lines of code.
   vector D(m); //Euclidean distance btn clusters  | Remember m is the number of clusters selected

   for (ulong i=0; i<rows; i++)
       {
         for (ulong j=0; j<m; j++)
           {
             D[j] = Euclidean_distance(Matrix.Row(i),w_matrix.Col(j));
           }

         #ifdef DEBUG_MODE
            Print("Euc distance ",D," Winning cluster ",D.ArgMin());
         #endif
Always remember, the Neuron that produces the class with a smaller Euclidean distance of all is the winning cluster.
Through competitive learning, the Kohonen map learns to create a topological representation of the input data in a lower-dimensional space while preserving the relationships between the input data.
Step 04: Updating the weights.
Updating the weights can be achieved using the below formula.
![]()
where:
![]() = New weights vector
= New weights vector
![]() = Old weights vector
= Old weights vector
![]() = Learning rate
= Learning rate
![]() = Inputs vector
= Inputs vector
Below is the code for this formula:
//--- weights update

   ulong min = D.ArgMin(); //winning cluster

   vector w_new =  w_matrix.Col(min) + (alpha * (Matrix.Row(i) - w_matrix.Col(min)));

   w_matrix.Col(w_new, min);
Unlike other types of artificial neural networks where all the weights for a particular layer engage, Kohonen maps are mindful of the weights for a particular cluster and use them to engage in finding that cluster only.
We are done with the steps and our algorithm is complete, time to run to see how everything works out.
Below is the entire code for the algorithm to this point.
CKohonenMaps::CKohonenMaps(matrix &matrix_, bool save_clusters=true, uint clusters=2, double alpha=0.01, uint epochs=100)
 {
   Matrix = matrix_;

   n = (uint)matrix_.Cols();
   rows = matrix_.Rows();
   m = clusters;

   cluster_tensor = new CTensors(m);

   w_matrix =matrix_utils.Random(0.0, 1.0, n, m, RANDOM_STATE);

   vector D(m); //Euclidean distance btn clusters


   for (uint epoch=0; epoch<epochs; epoch++)
    {
      double epoch_start = GetMicrosecondCount()/(double)1e6, epoch_stop=0;

      for (ulong i=0; i<rows; i++)
       {
         for (ulong j=0; j<m; j++)
           {
             D[j] = Euclidean_distance(Matrix.Row(i),w_matrix.Col(j));
           }

         #ifdef DEBUG_MODE
            Print("Euc distance ",D," Winning cluster ",D.ArgMin());
         #endif

   //--- weights update

         ulong min = D.ArgMin();

         vector w_new =  w_matrix.Col(min) + (alpha * (Matrix.Row(i) - w_matrix.Col(min)));

         w_matrix.Col(w_new, min);

       }

      epoch_stop =GetMicrosecondCount()/(double)1e6;

      printf("Epoch [%d/%d] | %sElapsed ",epoch+1,epochs, CalcTimeElapsed(epoch_stop-epoch_start));

    }  //end of training

//---

  #ifdef DEBUG_MODE
      Print("\nNew weights\n",w_matrix);
  #endif

 }
Outputs:
CS      0       04:13:26.617    Self Organizing map (EURUSD,H1) Euc distance [2.122748018266242,1.822857430002081] Winning cluster 1
CS      0       04:13:26.617    Self Organizing map (EURUSD,H1) Euc distance [1.434132188481296,1.100846180984197] Winning cluster 1
CS      0       04:13:26.617    Self Organizing map (EURUSD,H1) Euc distance [5.569896531530945,5.257391342266398] Winning cluster 1
CS      0       04:13:26.617    Self Organizing map (EURUSD,H1) Euc distance [4.36622216533946,4.000958814345993] Winning cluster 1
CS      0       04:13:26.617    Self Organizing map (EURUSD,H1) Euc distance [8.053842751911217,7.646959164093921] Winning cluster 1
CS      0       04:13:26.617    Self Organizing map (EURUSD,H1) Euc distance [6.966950064745546,6.499246789416081] Winning cluster 1
CS      0       04:13:26.617    Self Organizing map (EURUSD,H1) Epoch [1/100] | 0.000 Seconds Elapsed
....
....
....
CS      0       04:13:26.622    Self Organizing map (EURUSD,H1) Euc distance [0.7271897806071723,4.027137175049654] Winning cluster 0
CS      0       04:13:26.622    Self Organizing map (EURUSD,H1) Euc distance [0.08133608432880858,4.734224801594559] Winning cluster 0
CS      0       04:13:26.622    Self Organizing map (EURUSD,H1) Euc distance [4.18281664576938,0.5635073709012016] Winning cluster 1
CS      0       04:13:26.622    Self Organizing map (EURUSD,H1) Euc distance [2.979092473547668,1.758946102746018] Winning cluster 1
CS      0       04:13:26.622    Self Organizing map (EURUSD,H1) Euc distance [6.664860479474853,1.952054507391296] Winning cluster 1
CS      0       04:13:26.622    Self Organizing map (EURUSD,H1) Euc distance [5.595867985957728,0.8907607121421737] Winning cluster 1
CS      0       04:13:26.622    Self Organizing map (EURUSD,H1) Epoch [100/100] | 0.000 Seconds Elapsed
CS      0       04:13:26.622    Self Organizing map (EURUSD,H1)
CS      0       04:13:26.622    Self Organizing map (EURUSD,H1) New weights
CS      0       04:13:26.622    Self Organizing map (EURUSD,H1) [[0.75086979456201,4.028060179594681]
CS      0       04:13:26.622    Self Organizing map (EURUSD,H1)  [1.737580668068743,5.173650598091957]]
Great everything works, Our kohonen maps was able to cluster our primary matrix,
   matrix Matrix = {
                     {1.2, 2.3}, //Into cluster 0
                     {0.7, 1.8}, //Into cluster 0
                     {3.6, 4.8}, //Into cluster 1
                     {2.8, 3.9}, //Into cluster 1
                     {5.2, 6.7}, //Into cluster 1
                     {4.8, 5.6}  //Into cluster 1
                   };
This is exactly what it was supposed to be, this is great however, presenting this output and visualizing them on a plot isn't a simple task as it seems. We have two clusters one is a 2x2 matrix the other is a 4x2 matrix. One has 4 values the other has 8 values. If you remember in the article about K-Means Clustering, I struggled to present the clusters due to this difference in the size of clusters this time extreme measures have been taken.
Tensors in Machine Learning
A tensor is a generalization of vectors and matrices inside a multi-dimensional array. Simply put, a tensor is an array that contains matrices and vectors inside, In python, it looks like this;
# create tensor
from numpy import array

T = array([
  [[1,2,3],    [4,5,6],    [7,8,9]],
  [[11,12,13], [14,15,16], [17,18,19]],
  [[21,22,23], [24,25,26], [27,28,29]],
  ])
Tensors are the fundamental data structure used by machine learning frameworks such as TensorFlow, PyTorch, and Keras.
Tensors are used in machine learning algorithms for operations such as matrix multiplication, convolution, and pooling. Tensors are also used for storing and manipulating the weights and biases of neural networks during training and inference. Overall, Tensors are crucial data structure in machine learning that allows for efficient computation and representation of complex data.
I had to import Tensors.mqh library. Read about it on my GitHub wiki,
I added tensors to help us with the collection of clusters to each tensor.
CKohonenMaps::CKohonenMaps(matrix &matrix_, bool save_clusters=true, uint clusters=2, double alpha=0.01, uint epochs=100)
 {
   Matrix = matrix_;

   n = (uint)matrix_.Cols();
   rows = matrix_.Rows();
   m = clusters;

   cluster_tensor = new CTensors(m);

   w_matrix =matrix_utils.Random(0.0, 1.0, n, m, RANDOM_STATE);

   Print("w Matrix\n",w_matrix,"\nMatrix\n",Matrix);

   vector D(m); //Euclidean distance btn clusters


   for (uint epoch=0; epoch<epochs; epoch++)
    {
      double epoch_start = GetMicrosecondCount()/(double)1e6, epoch_stop=0;

      for (ulong i=0; i<rows; i++)
       {
         for (ulong j=0; j<m; j++)
           {
             D[j] = Euclidean_distance(Matrix.Row(i),w_matrix.Col(j));
           }

         #ifdef DEBUG_MODE
            Print("Euc distance ",D," Winning cluster ",D.ArgMin());
         #endif

   //--- weights update

         ulong min = D.ArgMin();

         if (epoch == epochs-1) //last iteration
            cluster_tensor.TensorAppend(Matrix.Row(i), min);

         vector w_new =  w_matrix.Col(min) + (alpha * (Matrix.Row(i) - w_matrix.Col(min)));

         w_matrix.Col(w_new, min);

         //Print("New w_Matrix\n ",w_matrix);
       }

      epoch_stop =GetMicrosecondCount()/(double)1e6;

      printf("Epoch [%d/%d] | %sElapsed ",epoch+1,epochs, CalcTimeElapsed(epoch_stop-epoch_start));

    }  //end of the training

//---

  #ifdef DEBUG_MODE
      Print("\nNew weights\n",w_matrix);
  #endif

//---

   Print("\nclusters");
   cluster_tensor.TensorPrint();
}
Outputs:
CS      0       04:13:26.624    Self Organizing map (EURUSD,H1) clusters
CS      0       04:13:26.624    Self Organizing map (EURUSD,H1) TENSOR INDEX <<0>>
CS      0       04:13:26.624    Self Organizing map (EURUSD,H1) [[1.2,2.3]
CS      0       04:13:26.624    Self Organizing map (EURUSD,H1)  [0.7,1.8]]
CS      0       04:13:26.624    Self Organizing map (EURUSD,H1) TENSOR INDEX <<1>>
CS      0       04:13:26.624    Self Organizing map (EURUSD,H1) [[3.6,4.8]
CS      0       04:13:26.624    Self Organizing map (EURUSD,H1)  [2.8,3.9]
CS      0       04:13:26.624    Self Organizing map (EURUSD,H1)  [5.2,6.7]
CS      0       04:13:26.624    Self Organizing map (EURUSD,H1)  [4.8,5.6]]
Great, now the clusters are stored in their respective tensors, Time to make something useful out of this.
Extracting the Clusters
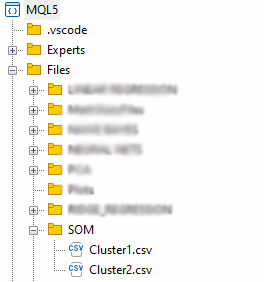
Let's extract the clusters by saving them into CSV files.
  matrix mat= {};

  if (save_clusters)
     for (uint i=0; i<this.cluster_tensor.TENSOR_DIMENSION; i++)
       {
          mat = this.cluster_tensor.Tensor(i); //Obtain a matrix located at I index in a cluster tensor

         string header[]; ArrayResize(header, (int)mat.Cols());

         for (int k=0; k<ArraySize(header); k++)
           header[k] = "col"+string(k);

         if (this.matrix_utils.WriteCsv("SOM\\Cluster"+string(i+1)+".csv",mat,header))
            Print("Clusters CSV files saved under the directory Files\\SOM");
       }
The files will be stored under SOM directory inside the Files parent directory.
We are done extracting the data but the essential part of Kohonen maps is visualizing the clusters and plotting the maps the algorithm has prepared for us. Python libraries and other frameworks usually use Hit maps, We are going to use the Curve plot for this library.
   vector v;
   matrix plotmatrix(rows, m);

     for (uint i=0; i<this.cluster_tensor.TENSOR_DIMENSION; i++)
       {
          mat = this.cluster_tensor.Tensor(i);

          v  = this.matrix_utils.MatrixToVector(mat);

          plotmatrix.Col(v, i);
       }

    this.plt.ScatterCurvePlotsMatrix("kom",plotmatrix,"Map","clusters","clusters");
Outputs:
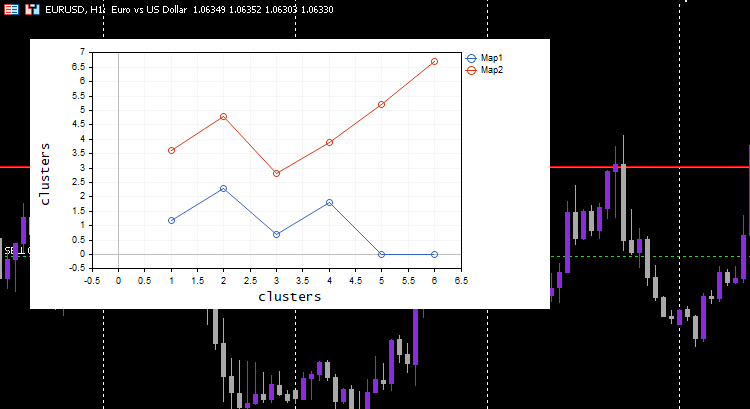
cool, Everything works and the plot was able to visualize the data well as intended, let's try the algorithm on something useful.
Clustering Indicator values.
Let's collect 100 bars for different 5 Moving averages indicators and let's try to cluster them using Kohonen maps. These indicators will be from the same chart, period, and the applied price except for the periods which will be different for each indicator.
#include <MALE5\Neural Networks\kohonen maps.mqh>
#include <MALE5\matrix_utils.mqh>


CMatrixutils matrix_utils;
CKohonenMaps *maps;

input int bars = 100;

int handles[5];
int period[5] = {10,20,30,50,100};
matrix Matrix(bars,5);
//+------------------------------------------------------------------+
//| Expert initialization function                                   |
//+------------------------------------------------------------------+
int OnInit()
  {
//---

   vector v;

   for (int i=0; i<5; i++)
      {
         handles[i] = iMA(Symbol(),PERIOD_CURRENT,period[i],0,MODE_LWMA,PRICE_CLOSE);
         matrix_utils.CopyBufferVector(handles[i],0,0,bars, v);

         Matrix.Col(v, i); //store indicators into a matrix
      }


   maps = new CKohonenMaps(Matrix,true,2,0.01,1000);

//---
   return(INIT_SUCCEEDED);
  }
I chose the learning rate/alpha = 0.01 and the epochs = 1000, Below is the kohonen maps.
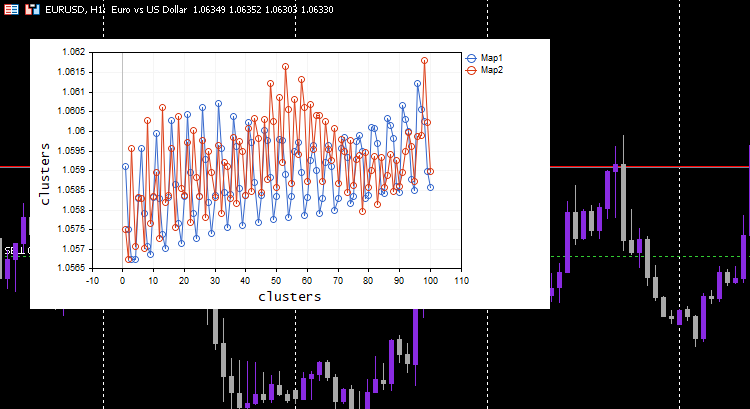
Looks weird, I had to inspect the logs for this odd behavior so I found.
CS      0       06:19:59.911    Self Organizing map (EURUSD,H1) clusters
CS      0       06:19:59.911    Self Organizing map (EURUSD,H1) TENSOR INDEX <<0>>
CS      0       06:19:59.911    Self Organizing map (EURUSD,H1) [[1.059108363197969,1.057514381244092,1.056754472954214,1.056739184229631,1.058300613902105]
CS      0       06:19:59.911    Self Organizing map (EURUSD,H1)  [1.059578181379783,1.057915286006,1.057066064352063,1.056875795994335,1.05831249905062]
....
....
CS      0       06:19:59.912    Self Organizing map (EURUSD,H1)  [1.063954363197777,1.061619428863266,1.061092386932678,1.060653270504107,1.059293304991227]
CS      0       06:19:59.912    Self Organizing map (EURUSD,H1)  [1.065106545015954,1.062409714577555,1.061610946072463,1.06098919991587,1.059488318852614…]
CS      0       06:19:59.912    Self Organizing map (EURUSD,H1) TENSOR INDEX <<1>>
CS      0       06:19:59.912    Self Organizing map (EURUSD,H1) []
CS      0       06:19:59.912    Self Organizing map (EURUSD,H1) CMatrixutils::MatrixToVector Failed to turn the matrix to a vector rows 0 cols 0
The Tensor for the second cluster was empty, meaning the algorithm did not predict it, all the data was predicted to belong to cluster 0.
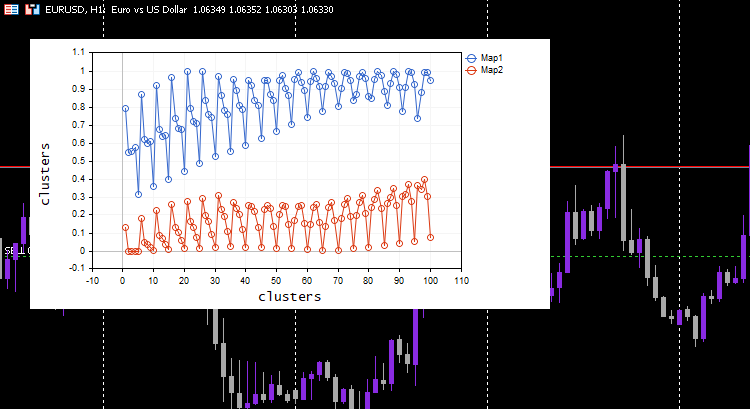
Always Normalize your Variables
I've said it a couple of times and I will continue to say it, normalizing your input data is essential to all the machine learning models you come across, Once again, the importance of normalization proves to be significant. Let's see the outcome after the data was normalized.
I chose the Min-Max scaler normalization technique.
#include <MALE5\Neural Networks\kohonen maps.mqh>
#include <MALE5\preprocessing.mqh>
#include <MALE5\matrix_utils.mqh>

CPreprocessing *pre_processing;
CMatrixutils matrix_utils;
CKohonenMaps *maps;

input int bars = 100;

int handles[5];
int period[5] = {10,20,30,50,100};
matrix Matrix(bars,5);
//+------------------------------------------------------------------+
//| Expert initialization function                                   |
//+------------------------------------------------------------------+
int OnInit()
  {
//---

   vector v;

   for (int i=0; i<5; i++)
      {
         handles[i] = iMA(Symbol(),PERIOD_CURRENT,period[i],0,MODE_LWMA,PRICE_CLOSE);
         matrix_utils.CopyBufferVector(handles[i],0,0,bars, v);

         Matrix.Col(v, i);
      }

   pre_processing = new CPreprocessing(Matrix, NORM_MIN_MAX_SCALER);

   maps = new CKohonenMaps(Matrix,true,2,0.01,1000);


//---
   return(INIT_SUCCEEDED);
  }
This time beautiful Kohonen maps was shown on the chart.
Great, but normalizing the data transforms the data into smaller values but, as someone who just wants to cluster their data for the sake of understanding the patterns and use the extracted data in other programs, this normalization process needs to be integrated into core of the algorithm, The data needs to be Normalized and Reverse normalized so that the obtained clusters are in the original values, Since the clustering techniques do not change the data, it just groups them. The process of normalizing and reverse normalizing can be successfully done using this Preprocessing class.
CKohonenMaps::CKohonenMaps(matrix &matrix_, bool save_clusters=true, uint clusters=2, double alpha=0.01, uint epochs=100, norm_technique NORM_TECHNIQUE=NORM_MIN_MAX_SCALER)
 {
   Matrix = matrix_;

   n = (uint)matrix_.Cols();
   rows = matrix_.Rows();
   m = clusters;

   pre_processing = new CPreprocessing(Matrix, NORM_TECHNIQUE);
   cluster_tensor = new CTensors(m);

   w_matrix =matrix_utils.Random(0.0, 1.0, n, m, RANDOM_STATE);

   #ifdef DEBUG_MODE
      Print("w Matrix\n",w_matrix,"\nMatrix\n",Matrix);
   #endif

   vector D(m); //Euclidean distance btn clusters


   for (uint epoch=0; epoch<epochs; epoch++)
    {

      double epoch_start = GetMicrosecondCount()/(double)1e6, epoch_stop=0;

      for (ulong i=0; i<rows; i++)
       {
         for (ulong j=0; j<m; j++)
           {
             D[j] = Euclidean_distance(Matrix.Row(i),w_matrix.Col(j));
           }

         #ifdef DEBUG_MODE
            Print("Euc distance ",D," Winning cluster ",D.ArgMin());
         #endif

   //--- weights update

         ulong min = D.ArgMin();

         if (epoch == epochs-1) //last iteration
            cluster_tensor.TensorAppend(Matrix.Row(i), min);


         vector w_new =  w_matrix.Col(min) + (alpha * (Matrix.Row(i) - w_matrix.Col(min)));

         w_matrix.Col(w_new, min);
       }

      epoch_stop =GetMicrosecondCount()/(double)1e6;

      printf("Epoch [%d/%d] | %sElapsed ",epoch+1,epochs, CalcTimeElapsed(epoch_stop-epoch_start));

    }  //end of the training

//---

  #ifdef DEBUG_MODE
      Print("\nNew weights\n",w_matrix);
  #endif

//---

   matrix mat= {};

   vector v;
   matrix plotmatrix(rows, m);

     for (uint i=0; i<this.cluster_tensor.TENSOR_DIMENSION; i++)
       {
          mat = this.cluster_tensor.Tensor(i);

          v  = this.matrix_utils.MatrixToVector(mat);

          plotmatrix.Col(v, i);
       }

    this.plt.ScatterCurvePlotsMatrix("kom",plotmatrix,"Map","clusters","clusters");

//---


  if (save_clusters)
     for (uint i=0; i<this.cluster_tensor.TENSOR_DIMENSION; i++)
       {
         mat = this.cluster_tensor.Tensor(i);
         pre_processing.ReverseNormalization(mat);
         cluster_tensor.TensorAdd(mat, i);

         string header[]; ArrayResize(header, (int)mat.Cols());

         for (int k=0; k<ArraySize(header); k++)
           header[k] = "col"+string(k);

         if (this.matrix_utils.WriteCsv("SOM\\Cluster"+string(i+1)+".csv",mat,header))
            Print("Clusters CSV files saved under the directory Files\\SOM");
       }

//---

   Print("\nclusters");
   cluster_tensor.TensorPrint();

 }
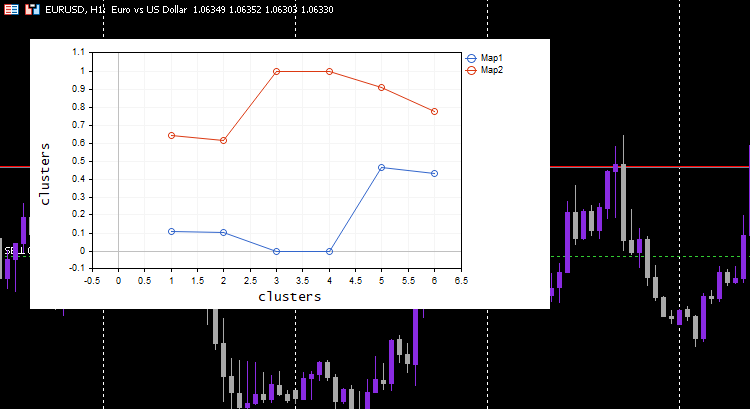
To show you how this works, I had to go back to the simple dataset we had at the beginning.
   matrix Matrix = {
                     {1.2, 2.3},
                     {0.7, 1.8},
                     {3.6, 4.8},
                     {2.8, 3.9},
                     {5.2, 6.7},
                     {4.8, 5.6}
                   };

   maps = new CKohonenMaps(Matrix,true,2,0.01,1000);
Outputs:
CS      0       07:14:44.660    Self Organizing map (EURUSD,H1) w Matrix
CS      0       07:14:44.660    Self Organizing map (EURUSD,H1) [[0.005340739158299509,0.01220740379039888]
CS      0       07:14:44.660    Self Organizing map (EURUSD,H1)  [0.5453352458265939,0.9172643208105716]]
CS      0       07:14:44.660    Self Organizing map (EURUSD,H1) Matrix
CS      0       07:14:44.660    Self Organizing map (EURUSD,H1) [[0.1111111111111111,0.1020408163265306]
CS      0       07:14:44.660    Self Organizing map (EURUSD,H1)  [0,0]
CS      0       07:14:44.660    Self Organizing map (EURUSD,H1)  [0.6444444444444445,0.6122448979591836]
CS      0       07:14:44.660    Self Organizing map (EURUSD,H1)  [0.4666666666666666,0.4285714285714285]
CS      0       07:14:44.660    Self Organizing map (EURUSD,H1)  [1,1]
CS      0       07:14:44.660    Self Organizing map (EURUSD,H1)  [0.911111111111111,0.7755102040816325]]
CS      0       07:14:44.660    Self Organizing map (EURUSD,H1) Epoch [1/1000] | 0.000 Seconds Elapsed
CS      0       07:14:44.660    Self Organizing map (EURUSD,H1) Epoch [2/1000] | 0.000 Seconds Elapsed
CS      0       07:14:44.660    Self Organizing map (EURUSD,H1) Epoch [3/1000] | 0.000 Seconds Elapsed
...
...
...
CS      0       07:14:44.674    Self Organizing map (EURUSD,H1) Epoch [999/1000] | 0.000 Seconds Elapsed
CS      0       07:14:44.674    Self Organizing map (EURUSD,H1) Epoch [1000/1000] | 0.000 Seconds Elapsed
CS      0       07:14:44.674    Self Organizing map (EURUSD,H1)
CS      0       07:14:44.674    Self Organizing map (EURUSD,H1) New weights
CS      0       07:14:44.674    Self Organizing map (EURUSD,H1) [[0.1937869656464888,0.8527427060068337]
CS      0       07:14:44.674    Self Organizing map (EURUSD,H1)  [0.1779676215121214,0.7964618795904062]]
CS      0       07:14:44.725    Self Organizing map (EURUSD,H1) Clusters CSV files saved under the directory Files\SOM
CS      0       07:14:44.726    Self Organizing map (EURUSD,H1) Clusters CSV files saved under the directory Files\SOM
CS      0       07:14:44.726    Self Organizing map (EURUSD,H1)
CS      0       07:14:44.726    Self Organizing map (EURUSD,H1) clusters
CS      0       07:14:44.726    Self Organizing map (EURUSD,H1) TENSOR INDEX <<0>>
CS      0       07:14:44.726    Self Organizing map (EURUSD,H1) [[1.2,2.3]
CS      0       07:14:44.726    Self Organizing map (EURUSD,H1)  [0.7,1.8]
CS      0       07:14:44.726    Self Organizing map (EURUSD,H1)  [2.8,3.899999999999999]]
CS      0       07:14:44.727    Self Organizing map (EURUSD,H1) TENSOR INDEX <<1>>
CS      0       07:14:44.727    Self Organizing map (EURUSD,H1) [[3.600000000000001,4.8]
CS      0       07:14:44.727    Self Organizing map (EURUSD,H1)  [5.2,6.7]
CS      0       07:14:44.727    Self Organizing map (EURUSD,H1)  [4.8,5.6]]
This process works like magic, Despite a machine learning model using the normalized data the model will be able to cluster the data and still be able to give out the non-normalized/original data just nothing has happened. Notice that plotted clusters were normalized data this is important because it is hard to plot data with different scales on them. This time the plot for the clusters on the simple testing dataset was a lot better;
Extending the Kohonen Maps
Even though the Kohonen maps and other data mining techniques were not made primarily to attempt to make predictions Since they have the learned parameters which are the weights we can extend them to let us get the clusters when we give them new data.
uint CKohonenMaps::KOMPredCluster(vector &v)
 {
  vector temp_v = v;
  pre_processing.Normalization(v);

  if (n != v.Size())
   {
     Print("Can't predict the cluster | the input vector size is not the same as the trained matrix cols");
     return(-1);
   }

   vector D(m); //Euclidean distance btn clusters

   for (ulong j=0; j<m; j++)
       D[j] = Euclidean_distance(v, w_matrix.Col(j));

   v.Copy(temp_v);
   return((uint)D.ArgMin());
 }

//+------------------------------------------------------------------+
//|                                                                  |
//+------------------------------------------------------------------+

vector CKohonenMaps::KOMPredCluster(matrix &matrix_)
 {
   vector v(n);

   if (n != matrix_.Cols())
      {
         Print("Can't predict the cluster | the input matrix Cols is not the same size as the trained matrix cols");
         return (v);
      }

   for (ulong i=0; i<matrix_.Rows(); i++)
      v[i] = KOMPredCluster(matrix_.Row(i));

    return(v);
 }
Let's give it the new data it has not seen, You and I know which cluster belongs to [0.5, 1.5] and [5.5, 6]. This data belongs to clusters 0 and 1 respectively.
   maps = new CKohonenMaps(Matrix,true,2,0.01,1000); //Training

   matrix new_data = {
         {0.5,1.5},
         {5.5, 6.0}
      };

   Print("new data\n",new_data,"\nprediction clusters\n",maps.KOMPredCluster(new_data)); //using it for predictions
Outputs:
CS      0       07:46:00.857    Self Organizing map (EURUSD,H1) new data
CS      0       07:46:00.857    Self Organizing map (EURUSD,H1) [[0.5,1.5]
CS      0       07:46:00.857    Self Organizing map (EURUSD,H1)  [5.5,6]]
CS      0       07:46:00.857    Self Organizing map (EURUSD,H1) prediction clusters
CS      0       07:46:00.857    Self Organizing map (EURUSD,H1) [0,1]
Cool, Kohonen maps have predicted them correctly.
Kohonen Maps on Strategy Tester

The algorithm works perfect and I was able to notice that it predicts cluster 0 when the market is up and vice versa, I'm not sure if the implication is correct I haven't analyzed the behavior well, I leave that to you. If that' s the case we can even use the kohonen maps as an Indicator because that's what most indicators do.
Advantages of Kohonen Maps
Kohonen maps have several advantages including:
- The ability to capture non-linear relationships between the input data and the output map means they can handle complex patterns and structures in the data that may not be easily captured by linear methods.
- They can find patterns and structures in the data without requiring you to label the data. This can be useful in situations where labeled data is scarce or expensive to obtain
- They help to reduce the dimensionality of the input data by mapping it to a lower-dimensional space, This can help reduce the computational complexity of a downstream task such as regression and classification.
- Preserve topological relationships between the input data and the output map, This means neighboring neurons in the map correspond to similar regions in the input space, which can help with data exploration and visualization
- Can be robust to noise and outliers in the input data, as long as the noise is too large.
Disadvantages of Kohonen Maps
- The quality of the final Self-Organizing Maps can be sensitive to the initialization of the weight vector, If the initialization is poor, the SOM may converge to a suboptimal solution or get stuck in a local minimum.
- Sensitive to parameter tuning: The performance of the SOM can be sensitive to the choice of hyperparameters, such as the learning rate, neighborhood function, and the number of neurons. Tuning these parameters can be time-consuming and require domain expertise.
- Computationally expensive and memory-intensive for large datasets. The size of the SOM scales with the number of input data points, so large datasets may require a large number of neurons and a long training time.
- Lack of formal convergence criteria: Unlike some machine learning algorithms such as neural networks, there are no formal convergence criteria for SOMs. This can make it difficult to determine when the training has converged and when to stop the training.
The Bottom Line
Kohonen maps or self-organizing maps(SOMs) are an innovative approach to trading that can help traders find their way in the markets. By using unsupervised learning, Kohonen maps can identify patterns and structures in market data, allowing traders to make informed decisions. As we have seen Kohonen maps were able to identify non-linear relationships in the data and cluster the data into their respective groups, However, traders should be aware of the potential drawbacks of Kohonen maps, such as sensitivity to initialization, lack of formal convergence, and other drawbacks discussed above. Overall, Kohonen maps have the potential to be a valuable addition to a trader's toolkit, but like any tool, they should be used with care and attention to their strength and weaknesses.
Take care.
Track the development and changes to this algorithm on my GitHub repo https://github.com/MegaJoctan/MALE5.
| File | Contents & Usage |
|---|---|
| Self Organizing map.mq5 | EA file for testing the algorithm discussed in this article. |
| kohonen maps.mqh | A library containing the kohonen maps algorithm. |
| plots.mqh | A library containing functions to draw plots on the chart in MT5. |
| preprocessing.mqh | Contains functions to normalize and pre process the inputs data. |
| matrix_utils.mqh | Contains additional functions for matrix operations in MQL5. |
| Tensors.mqh | A library containing classes to create tensors. |
Reference Articles:
-
Matrix Utils, Extending the Matrices and Vector Standard Library Functionality
-
Data Science and Machine Learning — Neural Network (Part 02): Feedforward NN Architectures Design
-
Data Science and Machine Learning (Part 06): Gradient Descent
Warning: All rights to these materials are reserved by MetaQuotes Ltd. Copying or reprinting of these materials in whole or in part is prohibited.
This article was written by a user of the site and reflects their personal views. MetaQuotes Ltd is not responsible for the accuracy of the information presented, nor for any consequences resulting from the use of the solutions, strategies or recommendations described.

- Free trading apps
- Over 8,000 signals for copying
- Economic news for exploring financial markets
You agree to website policy and terms of use