
Currency pair strength indicator in pure MQL5

Imagine a trader who faces the chaos of the forex market every day. 28 currency pairs flicker across the screen, each moving at its own pace, creating a symphony of market movement. But how to catch the main melody in this financial orchestra? How can we determine which currency is currently leading the market, and which is faltering and losing ground?
Today we are going to create something special — an indicator that will turn this chaos into a clear picture of market strength. Imagine a tool that instantly shows how EUR is gaining strength on the hourly chart, while JPY is weakening on the daily timeframe. An indicator that doesn't just show data, but tells the story of each currency through the prism of three key timeframes.
In this guide, we will tread the path from an idea to a fully-fledged technical tool. Step by step, we will transform complex mathematical calculations and programming code into an elegant dashboard that will become your reliable trading assistant. We will not just write the code — we will create a tool that will change the way you look at market analysis.
Ready to dive into the exciting world of MQL5 programming and create an indicator that combines mathematical precision with intuitive simplicity? Then fasten your seatbelts, we are about to begin our journey into the world of professional trading tool development!
1. Currency strength dashboard: Introducing the idea and concept of a tool for analyzing the strength of currency pairs in real time
When legendary investor Ray Dalio created his first trading systems at Bridgewater Associates, he was guided by a simple but powerful principle: to understand the movement of one asset, you need to see the movement of the entire group of instruments related to it. He started by trading trends, then moved on to trading baskets, and then developed his ideas into arbitrage and cointegrated portfolios.
This is the principle behind our currency strength dashboard. We will follow the same chain by assessing the strength of trends, creating a basket indicator, an arbitrage indicator of fair prices, and an indicator of cointegrated baskets.
Why is this important? Imagine you are looking at the EURUSD chart. Is the pair rising or falling? The chart movement seems obvious. But what is really going on? Is EUR strengthening or USD weakening? Without understanding the overall strength of each currency, it is impossible to answer. This is where our indicator reveals its potential.
Dashboard key features:
Multi-level time and price analysis involves using different timeframes to get a more accurate picture. The hourly chart (H1) shows short-term fluctuations, while the four-hour chart (H4) reflects longer-term trends. The daily chart (D1) allows you to see the global picture of strength. Each timeframe has its own weighting in the final assessment, which helps avoid distortion by short-term fluctuations and focus on long-term trends. The final currency strength indicator is calculated using all time intervals, allowing for a more comprehensive analysis.
Dynamic ranking helps maintain current positions of currency pairs. This allows us to instantly determine which currencies are currently the strongest and which are the weakest. The dashboard visually highlights extreme values allowing us to quickly track changes. Unlike classic indicators that analyze each currency pair separately, our system, similar to Dalio's methodology, views the market as a single, interconnected system. For example, a strengthening EUR will affect not only EURUSD, but also its relations with other currencies, such as GBP, JPY or CHF.
Our dashboard thus aggregates these relationships, creating a holistic picture of the market and allowing us to see the true strength of each currency. As Dalio said: "To make money in the markets, you have to think independently and be humble". Our currency strength dashboard helps us identify hidden trends that are inaccessible through traditional analysis.
2. Preparing the basic elements: setting up inputs, connecting currency pairs, defining the color scheme and update interval
Before we dive into complex calculations and algorithms, let's lay a solid foundation for our indicator. Correct configuration of basic elements is 50% of the success of the entire project.
Indicator header structure
#property copyright "Copyright 2025"
#property version   "1.00"
#property description "Currency strength analysis dashboard"
#property indicator_separate_window
#property indicator_plots 0
These directives define basic information about the indicator. Please note indicator_separate_window - our panel will be displayed in a separate window, without overloading the main chart.
Trader inputs
// Inputs
input color InpStrongColor = clrLime;       // Color of strong currencies
input color InpWeakColor = clrRed;          // Color of weak currencies
input color InpTextColor = clrWhite;        // Text color
input int InpUpdateInterval = 60;           // Update interval (in seconds)
We give the user the ability to customize the appearance and behavior of the indicator. Green and red are traditionally used to represent strength and weakness, but a trader can choose any color scheme that suits them.
Definition of currency pairs
// Array of currency pairs
const string CURRENCY_PAIRS[] = {
    "EURUSD", "GBPUSD", "USDJPY", "USDCHF", "AUDUSD", "NZDUSD", "USDCAD",
    "EURGBP", "EURJPY", "EURCHF", "EURAUD", "EURNZD", "EURCAD",
    "GBPJPY", "GBPCHF", "GBPAUD", "GBPNZD", "GBPCAD",
    "AUDJPY", "NZDJPY", "CADJPY", "CHFJPY",
    "AUDCHF", "NZDCHF", "CADCHF",
    "AUDNZD", "AUDCAD", "NZDCAD"
};
This array is the heart of our indicator. It contains all the major currency pairs that we will be analyzing. Please note the order: first come pairs with USD, then with EUR, GBP, and so on. This structure will help us further when calculating the strength of individual currencies.
Data structure for storing information
// Structure for storing the strength of a currency pair
struct SPairStrength {
    string pair;           // Currency pair
    double strength;       // Current strength
    double h1_change;      // Change per hour
    double h4_change;      // Change in 4 hours
    double d1_change;      // Daily change
};

// Global variables
SPairStrength g_strength_data[];
int g_pairs_count;
int g_timer_counter;
The SPairStrength structure is our container for storing all the necessary information about each currency pair. We will store not only the final strength value, but also the changes for each timeframe, allowing the trader to see the full picture of the movement.
Indicator initialization
int OnInit() {
    // Initialize the data array
    g_pairs_count = ArraySize(CURRENCY_PAIRS);
    ArrayResize(g_strength_data, g_pairs_count);

    // Fill in the names of pairs
    for(int i = 0; i < g_pairs_count; i++) {
        g_strength_data[i].pair = CURRENCY_PAIRS[i];
    }

    // Create graphical objects
    if(!CreateGraphics()) {
        return(INIT_FAILED);
    }

    // Set the timer
    EventSetTimer(InpUpdateInterval);
    g_timer_counter = 0;

    return(INIT_SUCCEEDED);
}
In the initialization function, we define the size of the data array, fill in the basic information, then create the graphical objects, and set up the update timer.
Cleaning at shutdown
void OnDeinit(const int reason) {
    EventKillTimer();
    ObjectsDeleteAll(0, "SPPanel_");
    ChartRedraw();
}
Never forget to clean up resources properly - it is a sign of good code.
Now the foundation of our indicator is ready! In the next section, we will work on creating a system for calculating currency strength and visualizing the results.
3. Creating a data storage structure: Designing the SPairStrength structure to store information about the strength of each currency pair
Every programmer knows that a data structure is like the foundation of a house. The success of the entire project depends on how thoughtfully we design it. Let's dive into the anatomy of our SPairStrength structure.
// Structure for storing the strength of a currency pair
struct SPairStrength {
    string pair;           // Currency pair
    double strength;       // Current strength
    double h1_change;      // Change per hour
    double h4_change;      // Change in 4 hours
    double d1_change;      // Daily change
};

// Global variables
SPairStrength g_strength_data[];
int g_pairs_count;
int g_timer_counter;
At the heart of our structure lies an elegant solution for storing all the necessary information about a currency pair. Imagine a digital passport of a currency pair, where each field tells its own story of market movements.
The 'pair' field is the name of our financial instrument, its unique ID in the forex world. Just as a person's name identifies them, the string value "EURUSD" or "GBPJPY" instantly gives us an idea of which currency pair we are working with.
The 'strength' variable is the quintessence of a currency pair's strength, its numerical rating in the market. Just as teachers calculate a final grade based on multiple tests, this value takes into account performance across all time intervals to create a single strength index.
Now about the temporary data structure. We use three key markers: h1_change, h4_change and d1_change. It is like three surveillance cameras, each capturing price movements on its own time scale. The hourly chart (h1_change) captures short-term fluctuations, the four-hour chart (h4_change) tracks medium-term trends, and the daily chart (d1_change) paints a global picture of price movements.
To work with our structure, we also create global variables:
// Initialize the data array
void InitializeDataArray() {
    g_pairs_count = ArraySize(CURRENCY_PAIRS);
    ArrayResize(g_strength_data, g_pairs_count);

    // Fill in basic information
    for(int i = 0; i < g_pairs_count; i++) {
        g_strength_data[i].pair = CURRENCY_PAIRS[i];
        g_strength_data[i].strength = 0;
        g_strength_data[i].h1_change = 0;
        g_strength_data[i].h4_change = 0;
        g_strength_data[i].d1_change = 0;
    }
}
All these elements together create a powerful analysis tool. Just as a doctor uses various indicators to assess a patient's health, our structure collects key metrics to determine the health of a currency pair. In the next section, we will look at how this elegant data structure comes to life in a graphical interface, turning dry numbers into a visual picture of market opportunities.
4. Organizing the graphical interface: creating the main panel, placing headings, customizing the display of values
Data visualization is the art of turning numbers into a clear picture. Let's create an intuitive interface that will allow traders to instantly read the market situation.
bool CreateGraphics() {
    // Main panel
    if(!ObjectCreate(0, "SPPanel_Main", OBJ_RECTANGLE_LABEL, 0, 0, 0)) {
        Print("Error creating main panel: ", GetLastError());
        return false;
    }

    // Customize the panel appearance
    ObjectSetInteger(0, "SPPanel_Main", OBJPROP_XDISTANCE, 20);
    ObjectSetInteger(0, "SPPanel_Main", OBJPROP_YDISTANCE, 20);
    ObjectSetInteger(0, "SPPanel_Main", OBJPROP_XSIZE, 800);
    ObjectSetInteger(0, "SPPanel_Main", OBJPROP_YSIZE, 400);
    ObjectSetInteger(0, "SPPanel_Main", OBJPROP_BGCOLOR, C'16,20,24');
    ObjectSetInteger(0, "SPPanel_Main", OBJPROP_BORDER_COLOR, C'29,31,34');
    ObjectSetInteger(0, "SPPanel_Main", OBJPROP_BORDER_TYPE, BORDER_FLAT);
    ObjectSetInteger(0, "SPPanel_Main", OBJPROP_CORNER, CORNER_LEFT_UPPER);
    ObjectSetInteger(0, "SPPanel_Main", OBJPROP_BACK, false);
The dark background was chosen for a reason: it reduces eye strain during prolonged use. The dashboard dimensions have been carefully selected to optimally display all necessary information without overloading the screen.
// Create headings and markup
    CreateLabel("SPPanel_Strong", "STRONG PAIRS - LONG", 30, 30, InpTextColor, 10, true);
    CreateLabel("SPPanel_Weak", "WEAK PAIRS - SHORT", 420, 30, InpTextColor, 10, true);

    string header = "   PAIR      H1     H4     D1    FORCE";
    CreateLabel("SPPanel_Header1", header, 30, 60, clrGray, 9);
    CreateLabel("SPPanel_Header2", header, 420, 60, clrGray, 9);
The interface is divided into two logical zones: strong and weak pairs. It is like two poles of a magnet - they draw attention to the most important trading opportunities. Each column of data has its own purpose, telling the story of price movement through different timeframes.
bool CreateLabel(const string name, const string text, const int x, const int y,
                const color clr, const int size, const bool is_bold=false) {
    if(!ObjectCreate(0, name, OBJ_LABEL, 0, 0, 0)) {
        Print("Error creating label ", name, ": ", GetLastError());
        return false;
    }

    ObjectSetString(0, name, OBJPROP_TEXT, text);
    ObjectSetInteger(0, name, OBJPROP_XDISTANCE, x);
    ObjectSetInteger(0, name, OBJPROP_YDISTANCE, y);
    ObjectSetString(0, name, OBJPROP_FONT, is_bold ? "Arial Bold" : "Arial");
    ObjectSetInteger(0, name, OBJPROP_FONTSIZE, size);
    ObjectSetInteger(0, name, OBJPROP_COLOR, clr);
    ObjectSetInteger(0, name, OBJPROP_CORNER, CORNER_LEFT_UPPER);
    ObjectSetInteger(0, name, OBJPROP_ANCHOR, ANCHOR_LEFT_UPPER);

    return true;
}
The CreateLabel function is our artist who places text on the panel with precision. Every interface element is pixel-perfect to create a harmonious composition of data.
In the next section, we will bring this interface to life by populating it with real-world data on currency pair movements. Our panel will become a living organism, pulsating to the rhythm of the market.
Implementing the force calculation algorithm
At the heart of our indicator beats a powerful algorithm for calculating the strength of currency pairs. This is not just a mathematical equation - it is a symphony of market data, where each timeframe plays its part.
// Calculate the price change for a given timeframe
double CalculateChange(const string symbol, const ENUM_TIMEFRAMES timeframe) {
    MqlRates rates[];
    ArraySetAsSeries(rates, true);

    if(CopyRates(symbol, timeframe, 0, 2, rates) <= 0) {
        return 0.0;
    }

    if(rates[1].open == 0) return 0.0;

    return ((rates[0].close - rates[1].open) / rates[1].open) * 100.0;
}

// Calculate the strength of all currency pairs
void CalculateStrengths() {
    for(int i = 0; i < g_pairs_count; i++) {
        // Calculate changes across different timeframes
        g_strength_data[i].h1_change = CalculateChange(g_strength_data[i].pair, PERIOD_H1);
        g_strength_data[i].h4_change = CalculateChange(g_strength_data[i].pair, PERIOD_H4);
        g_strength_data[i].d1_change = CalculateChange(g_strength_data[i].pair, PERIOD_D1);

        // Calculate the total force (weighted value)
        g_strength_data[i].strength =
            g_strength_data[i].h1_change * 0.2 +  // 20% weight of the hourly chart
            g_strength_data[i].h4_change * 0.3 +  // 30% weight of the 4-hour chart
            g_strength_data[i].d1_change * 0.5;   // 50% weight of the daily chart
    }
}
Why such weighting factors? The daily timeframe receives the greatest weight (50%) as it reflects the global trend. The four-hour chart (30%) captures medium-term movements, while the hourly chart (20%) reacts to short-term fluctuations. It is like a filter system where each level cleans the signal from market noise.
5. Bubble sorting system: Creating a mechanism for sorting currency pairs by strength to identify strong and weak instruments
In modern algorithmic trading, speed and accuracy of data sorting play a critical role. The sorting mechanism we developed is not simply an implementation of a classic algorithm, but a carefully optimized solution for the specific tasks of the foreign exchange market.
void SortStrengthData() {
    for(int i = 0; i < g_pairs_count - 1; i++) {
        for(int j = i + 1; j < g_pairs_count; j++) {
            if(g_strength_data[j].strength > g_strength_data[i].strength) {
                SPairStrength temp = g_strength_data[i];
                g_strength_data[i] = g_strength_data[j];
                g_strength_data[j] = temp;
            }
        }
    }
}
Behind the apparent simplicity of this code lies a powerful financial analytics tool. Each iteration of the algorithm is a microsecond comparison of the strength of currency pairs, where the strongest instruments naturally rise to the top of the array, forming an elite group of trading opportunities. Weak pairs, on the other hand, tend to decline, creating an ideal scenario for short-selling traders.
void GetTopPairs(SPairStrength &strong[], SPairStrength &weak[], int count = 10) {
    ArrayResize(strong, count);
    for(int i = 0; i < count; i++) {
        strong[i] = g_strength_data[i];
    }

    ArrayResize(weak, count);
    for(int i = 0; i < count; i++) {
        weak[i] = g_strength_data[g_pairs_count - 1 - i];
    }
}
The GetTopPairs function demonstrates the elegance of our approach. Instead of constantly re-sorting the entire data array, we store it in an organized state, which allows us to instantly extract information about the strongest and weakest instruments. This is especially important in high-frequency trading, where every millisecond counts.
void UpdateDisplay() {
    for(int i = 0; i < 10 && i < g_pairs_count; i++) {
        string text = StringFormat("%s  %+.1f  %+.1f  %+.1f  %+.1f",
            g_strength_data[i].pair,
            g_strength_data[i].h1_change,
            g_strength_data[i].h4_change,
            g_strength_data[i].d1_change,
            g_strength_data[i].strength);

        UpdatePairDisplay("Strong_" + IntegerToString(i), text, InpStrongColor, i);
    }
}
In the next section, we'll look at how our data update system keeps this well-oiled machine constantly operational, providing traders with up-to-date information on the strength of currency pairs in real time.
6. Implementing a data update system: Setting up a timer and functions to regularly update currency strength values
The basis of any successful trading tool is the accuracy and timeliness of incoming information. Our currency strength indicator is no exception – at its heart is a carefully designed real-time data update system.
void OnTimer() {
    g_timer_counter++;
    if(g_timer_counter >= InpUpdateInterval) {
        CalculateStrengths();
        SortStrengthData();
        UpdateDisplay();
        g_timer_counter = 0;
    }
}
This elegant timer mechanism is like a metronome, counting the rhythm of market changes. Every 60 seconds (the default value), the indicator performs a full update of all data, providing the trader with up-to-date information for decision making.
void UpdateDisplay() {
    // Remove old values
    ObjectsDeleteAll(0, "SPPanel_Value_");

    // Update strong pairs
    for(int i = 0; i < 10 && i < g_pairs_count; i++) {
        string text = StringFormat("%s  %+.1f  %+.1f  %+.1f  %+.1f",
            g_strength_data[i].pair,
            g_strength_data[i].h1_change,
            g_strength_data[i].h4_change,
            g_strength_data[i].d1_change,
            g_strength_data[i].strength);

        CreateLabel("SPPanel_Value_Strong_" + IntegerToString(i),
            text, 30, 90 + i * 25, InpStrongColor);
    }
}
The process of updating data resembles a stage set change in a theater — old values smoothly give way to new ones, creating a vibrant, dynamic picture of the market. Each value is formatted with mathematical precision: two decimal places for percentage changes, column alignment for easy reading, and color coding for instant information comprehension.
void RefreshData() {
    static datetime last_update = 0;
    datetime current_time = TimeCurrent();

    // Check if an update is needed
    if(current_time - last_update >= InpUpdateInterval) {
        CalculateStrengths();
        SortStrengthData();
        UpdateDisplay();
        last_update = current_time;
    }
}
The system also includes protection against excessive updates and a mechanism for synchronizing with server time, which is especially important when working with high-load trading accounts. In the next section, we will look at how all of these elements come together to optimize the display of results.
7. Optimizing the display of results: Formatting data output, setting up color highlighting of values
In the world of financial data, visual representation plays a key role. Our indicator transforms the flow of market data into an intuitive picture, where each element has its own purpose.
void UpdatePairDisplay(const string label_suffix, const string value,
                      const color clr, const int position) {
    string text = StringFormat("%s %+6.1f %+6.1f %+6.1f %+6.1f",
        value.pair,
        value.h1_change,
        value.h4_change,
        value.d1_change,
        value.strength);

    color display_color = value.strength > 0 ? InpStrongColor : InpWeakColor;

    CreateLabel("SPPanel_" + label_suffix,
        text,
        position < 10 ? 30 : 420,  // X coordinate
        90 + (position % 10) * 25, // Y coordinate
        display_color,
        9);
}
The number formatting here is more than just a cosmetic enhancement. Each value is output with a fixed width and sign, creating perfectly aligned columns of data. Positive values are automatically colored green and negative values red, allowing you to instantly assess the situation.
void ApplyColorCoding() {
    // Dynamically detecting boundaries for color coding
    double max_strength = 0;
    for(int i = 0; i < g_pairs_count; i++) {
        if(MathAbs(g_strength_data[i].strength) > max_strength)
            max_strength = MathAbs(g_strength_data[i].strength);
    }

    // Apply gradient coloring
    for(int i = 0; i < g_pairs_count; i++) {
        double strength_ratio = g_strength_data[i].strength / max_strength;
        color intensity = GetColorIntensity(strength_ratio);
        UpdatePairColor(i, intensity);
    }
}
The indicator uses a dynamic color coding system, where the color intensity reflects the relative strength of the currency pair. The brighter the color, the greater the movement — this allows traders to instantly identify the most active instruments.
In the next section, we will dive into the indicator testing process, where we will test its performance under various market conditions.
8. Testing the indicator: Checking the accuracy of calculations and stability of operation on different timeframes
We see a fully working currency strength dashboard in front of us, which already shows real market data. Let's look at how the indicator performs in various market situations and how we can ensure that it is working correctly.
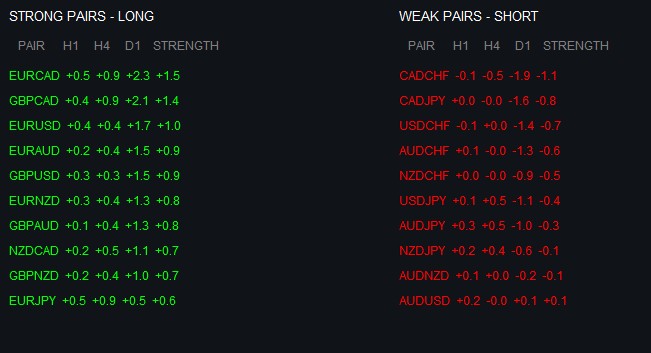
In the screenshot, we see a clear separation of currency pairs. In the left column of strong pairs, EURCAD leads with mostly positive dynamics.
In the right column of weak pairs, we see CADCHF showing significant weakness, especially on the higher timeframes (H4: -0.5, D1: -1.8), giving an overall weakness of -1.1. This is a great example of how the indicator identifies sustainable trends.
Conclusion
We have completed a professional currency strength indicator that transforms the chaos of market data into a clear, structured picture of trading opportunities.
The dashboard combines several key innovations:
- Multi-level timeframe analysis (H1, H4, D1) allowing you to see the full picture of market movements
- Smart weighting system where each timeframe contributes to the overall strength score
- Elegant visual interface with intuitive data presentation
- Efficient real-time update system
- Robust mechanism for sorting and ranking currency pairs
The strength of our indicator lies not only in its technical implementation, but also in the philosophy behind it. Following Ray Dalio's principles, we have created a tool that views the market as a single, interconnected system, where the movement of each currency affects the overall picture.
Translated from Russian by MetaQuotes Ltd.
Original article: https://www.mql5.com/ru/articles/17303
Warning: All rights to these materials are reserved by MetaQuotes Ltd. Copying or reprinting of these materials in whole or in part is prohibited.
This article was written by a user of the site and reflects their personal views. MetaQuotes Ltd is not responsible for the accuracy of the information presented, nor for any consequences resulting from the use of the solutions, strategies or recommendations described.

- Free trading apps
- Over 8,000 signals for copying
- Economic news for exploring financial markets
You agree to website policy and terms of use
It is ill-considered and extremely inefficient to use currency pairs in the form of a large list of crosscourses. It is correct to take only currencies relative to one base (usually USD) and get any combinations from them.
Everything is rightly done, and many times more obvious than starting from a single currency.
Excellent work!
It is ill-considered and extremely inefficient to use currency pairs in the form of a large list of crosscourses. It is correct to take only currencies relative to one base (as a rule, USD) and get any combinations from them.
bad variant, as the code will turn out to be small :-)) and dangerous - the meaning of the introduced term "currency strength" may be lost.
Done right, and many times more obvious than pushing back on a single currency.
Well done!
If it is not obvious for a trader that, for example, EURJPY is EURUSD*USDJPY, he is probably engaged in a wrong business. If we take only forex "majors", it is easier (in all senses) to process 7 pairs than 28. And what will you do if the broker (as it often happens) does not have some crosses? And if you want to add "minors", local currencies, metals to the basket? Are you suggesting to drag the whole Market Watch into the MQL-programme, although it is not required to evaluate the same basket? It is because of such advisors that questions regularly appear on the forum: oh, my indicator is slowing down, my tester agents have eaten up all the memory, etc.
I didn't start talking about some ripped out pieces of code, including those that don't compile in principle, such as UpdatePairDisplay.
Unsatisfactory.