
Price Action Analysis Toolkit Development (Part 5): Volatility Navigator EA
Introduction
Navigating the complexities of trading involves more than simply identifying potential market directions; it also demands precise execution. Many traders encounter setbacks not because of poor trade execution but due to inaccuracies in their entry points, stop loss placements, or take profit targets.
To address this challenge, I have developed a new tool called Volatility Navigator using the MQL5 programming language, specifically designed to optimize these critical aspects of trading. Unlike my previous tools that primarily focused on predicting market trends, Volatility Navigator independently identifies optimal entry points, stop loss levels, and take profit targets.
By incorporating advanced technical indicators into our price action analytics, we aim to enhance the trading experience and improve strategy formulation.
Please refer to the following sections below.
- Introduction
- Technical Indicators
- Overview of the EA's Structure
- The Main Logic of the EA
- Implementing Alerts and Notifications
- Testing
- Conclusion
Technical indicators
Technical indicators can be categorized into several types, including trend indicators, momentum indicators, volatility indicators, and volume indicators, each serving distinct purposes in financial market analysis. Some widely used examples include the Moving Average, Relative Strength Index (RSI), Bollinger Bands, and the Moving Average Convergence Divergence (MACD).
Let’s take a closer look at the three indicators we will be using alongside price action to achieve our goals: Bollinger Bands, the Relative Strength Index (RSI), and the Average True Range (ATR).
- Bollinger Bands
Bollinger Bands were developed by John Bollinger in the early 1980s as a technical analysis tool to help traders identify market trends and potential price reversals. The concept emerged from Bollinger's desire to provide a more dynamic way of measuring price volatility compared to traditional technical indicators. John Bollinger sought to create a trading tool that could adapt to changing market conditions.
He wanted an indicator that would adjust based on market volatility, which led him to the idea of using moving averages along with a measure of price variation. Bollinger Bands consist of three lines:
- The middle band is typically a simple moving average (SMA) of the closing prices over a specified period (commonly 20 days).
- The upper band is the middle band plus a specified number of standard deviations (usually two).
- The lower band is the middle band minus the same number of standard deviations.
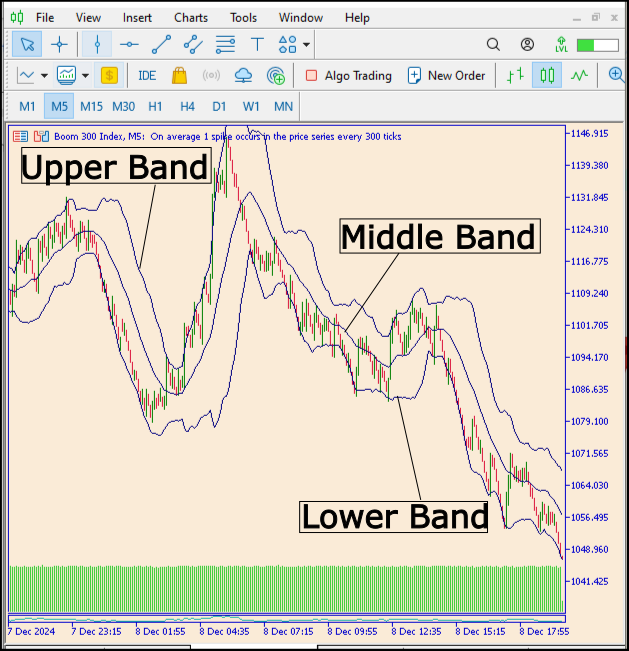
Fig 1. Bollinger Bands
The use of standard deviations is key to Bollinger Bands, as it provides a statistical measure of volatility. By incorporating this measure, Bollinger Bands can effectively encapsulate price movements within a range, helping traders recognize potential breakouts or reversals.
Traders often use Bollinger Bands to identify overbought or oversold conditions, potential trend reversals, and to gauge the strength of price movements. For example, prices touching the upper band may indicate an overbought condition, while prices touching the lower band may suggest an oversold condition.
- Relative Strength Index (RSI)
The Relative Strength Index (RSI) was developed by J. Welles Wilder Jr. and introduced in his 1978 book "New Concepts in Technical Trading Systems." Wilder aimed to create a momentum oscillator that could help traders identify overbought and oversold conditions in financial markets. Below is the formula for calculating the RSI.
Fig 2. RSI Formula
The RSI measures the speed and change of price movements, helping to identify overbought or oversold conditions in a market over a specified period, typically 14 days. Ranging from 0 to 100, an RSI above 70 typically indicates that an asset may be overbought, while an RSI below 30 suggests that it may be oversold.
Traders use the RSI to signal potential reversals or confirm trends. Moreover, divergence between the RSI and price action can indicate weakening momentum, presenting further trading opportunities.
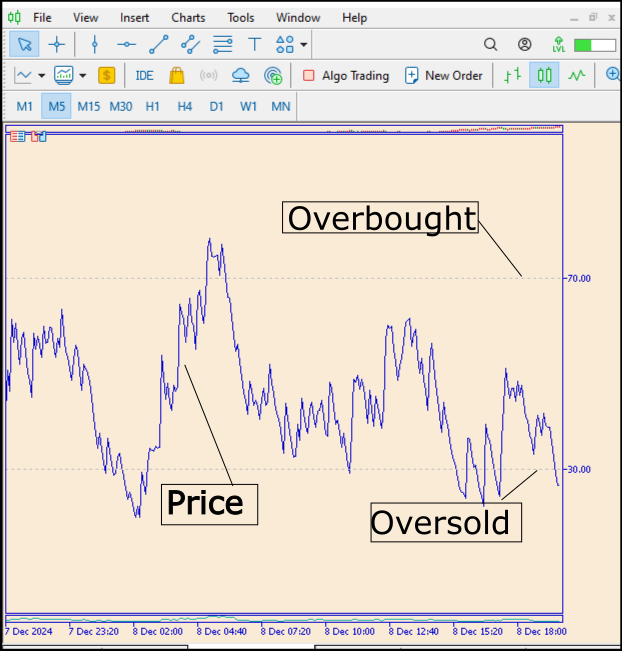
Fig 3. RSI Chart
- Average True Range (ATR)
The Average True Range (ATR) indicator was developed by J. Welles Wilder Jr. and introduced in his 1978 book, "New Concepts in Technical Trading Systems." Wilder created the ATR to measure market volatility by calculating the True Range (TR), which considers the greatest range of price movement over a set period.
The ATR has since become a widely utilized tool in technical analysis, helping traders assess volatility and manage risk across various financial markets. The Average True Range (ATR) is a volatility indicator that measures the degree of price movement over a specified period, providing insights into market volatility without indicating the direction of price movement.
A higher ATR value indicates greater volatility, while a lower ATR signals less volatility. Traders use ATR to inform risk management strategies, such as setting stop-loss levels and position sizing based on market conditions. This helps in adapting trading strategies to varying market volatility, allowing for more effective trading in different scenarios. Let's take a look at the formula for calculating ATR below.
Fig 4. ATR Calculation
The purpose of using the Average True Range (ATR) in the trading strategy is to dynamically adjust stop loss and take profit levels based on current market volatility. ATR serves as a measure of price movement, allowing the Expert Advisor to set wider levels during periods of high volatility and tighter levels when the market is calmer. This approach enhances risk management by ensuring that trades are not prematurely stopped out in volatile conditions, while also capitalizing on potential profits when the market movement is more subdued. By incorporating ATR, the EA can adapt to changing market conditions, leading to more effective trade execution and increased chances of success.
Overview of the EA's Structure
The Volatility Navigator Expert Advisor (EA) is designed with a structured layout that adheres to MQL5 programming standards. Understanding this layout is crucial for setting up the EA effectively and making adjustments as market conditions change. In MQL5, indicator handles are pivotal tools that streamline the process of using technical indicators within the EA. Rather than recalculating indicators during every price change, the EA can quickly reference these handles to obtain the latest values.
For example, whenever the OnTick() function runs, the EA can efficiently access the relevant indicator values, which is especially beneficial in rapidly changing market conditions. This immediate access enables better actions based on current market dynamics.
Core Functions of the EA
The main components of an MQL5 Expert Advisor consist of three key functions: OnInit(), OnTick(), and OnDeinit().
- OnInit() Function:
int OnInit() {
    // Initialize RSI
    rsiHandle = iRSI(NULL, 0, rsiPeriod, PRICE_CLOSE);
    // Initialize Bollinger Bands
    bbHandle = iBands(NULL, 0, bbPeriod, 2, 0, PRICE_CLOSE);
    // Initialize ATR
    atrHandle = iATR(NULL, 0, atrPeriod);
    return INIT_SUCCEEDED;
}
In the code snippet above, we are creating handles for the RSI, Bollinger Bands, and Average True Range (ATR) indicators, all of which will assist the EA in forming trading decisions.
- OnTick() Function:
The OnTick() function is critical as it is called every time there is a price fluctuation in the market. This is where the EA evaluates the current indicator values and determines appropriate trading actions.
void OnTick() {
    double rsiValue = iRSI(NULL, 0, rsiPeriod, PRICE_CLOSE);
    double upperBand, middleBand, lowerBand;
    iBands(NULL, 0, bbPeriod, 2, 0, PRICE_CLOSE, upperBand, middleBand, lowerBand);
    double atrValue = iATR(NULL, 0, atrPeriod);

    // Trading logic
    if (rsiValue > 70 && Close[0] > upperBand) {
        // Logic to place a sell order
    }
    else if (rsiValue < 30 && Close[0] < lowerBand) {
        // Logic to place a buy order
    }
}
Here, the EA checks the RSI value, Bollinger Bands, and ATR to make informed trading decisions. For example, it sells when the RSI indicates overbought conditions and the price exceeds the upper Bollinger Band.
- OnDeinit() Function:
The OnDeinit() function is called when the EA is removed from the chart. This function plays a vital role in cleaning up resources by releasing indicator handles.
void OnDeinit(const int reason) {
    // Release resources for indicators
    IndicatorRelease(rsiHandle);
    IndicatorRelease(bbHandle);
    IndicatorRelease(atrHandle);
}
Input Parameters
One of the standout features of the Volatility Navigator EA is its flexibility through customizable input parameters. These parameters allow traders to tailor the EA's behavior to align with their unique strategies. Some essential input parameters include:
- RSI Period:
input int rsiPeriod = 14; // Standard period for RSI calculation
- Bollinger Bands Period:
input int bbPeriod = 20; // Standard period for Bollinger Bands
- ATR Period:
input int atrPeriod = 14; // Period for ATR
The Main Logic of the EA
Let's begin by examining the diagram below, which illustrates how the signal is generated for a buy order, with the process for a sell order being the inverse.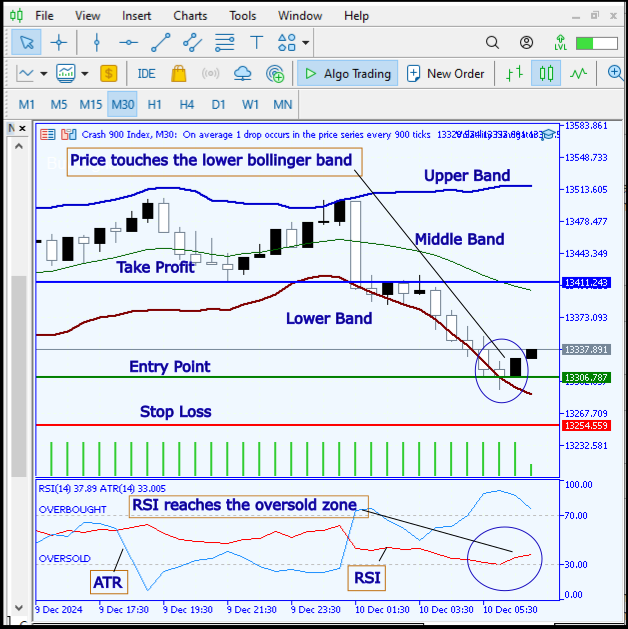
Fig 5. Signal Generation Conditions
- Signal Calculation Process
The primary function of the Volatility Navigator EA is to analyze market conditions to generate trading signals. As part of this process, the EA retrieves the current values of the relevant indicators in the OnTick function. Below is a snippet illustrating how to calculate the RSI, Bollinger Bands, and ATR within the EA.
// Declare indicator handles
int rsiHandle;
int bbHandle;
int atrHandle;

// OnInit function
int OnInit() {
    // Create indicator handles
    rsiHandle = iRSI(NULL, 0, rsiPeriod, PRICE_CLOSE);
    bbHandle = iBands(NULL, 0, bbPeriod, bbDevUp, bbDevDown, PRICE_CLOSE);
    atrHandle = iATR(NULL, 0, atrPeriod);

    return(INIT_SUCCEEDED);
}
In this setup, the OnInit function initializes handles for the RSI, Bollinger Bands, and ATR, allowing the EA to access their values for ongoing calculations.
- Evaluating RSI Conditions
The RSI indicator helps identify potential points for entry and exit by indicating overbought and oversold conditions. Analyzing the RSI value allows the EA to make strategic trading choices. The following snippet shows how to check RSI values.
double rsiValue = iCustom(NULL, 0, "RSI", rsiPeriod, 0);
if (rsiValue > 70) {
    // Market is overbought - potentially signal to sell
} else if (rsiValue < 30) {
    // Market is oversold - potentially signal to buy
}
In this code, the EA retrieves the current RSI value and compares it to the predefined thresholds of 70 and 30 to determine potential trade signals.
- Analyzing Bollinger Bands
double upperBand = iBands(NULL, 0, bbPeriod, bbDevUp, 0, PRICE_CLOSE);
double lowerBand = iBands(NULL, 0, bbPeriod, -bbDevDown, 0, PRICE_CLOSE);
double price = Close[0];

if (price < lowerBand) {
    // Price is touching the lower band - potential buy signal
} else if (price > upperBand) {
    // Price is touching the upper band - potential sell signal
}
This snippet shows the logic the EA employs to check whether the current price is in proximity to the upper or lower Bollinger Bands, which may trigger buy or sell signals.
- Incorporating Average True Range (ATR)
ATR provides insight into market volatility and assists in managing risk via stop-loss and take-profit settings. The following code retrieves the ATR value:
double atrValue = iATR(NULL, 0, atrPeriod);

if (atrValue > atrThreshold) {
    // High volatility - consider entering trades
} else {
    // Low volatility - potentially stay out of the market
}
In this example, the EA checks the ATR to determine whether the volatility is sufficient to justify entering a trade. Traders often prefer high ATR values, as they indicate that meaningful price movements are anticipated.
- Generating Trade Signals
By combining the insights from the RSI, Bollinger Bands, and ATR, the EA generates more reliable trading signals. The following snippet illustrates how the EA would formulate these signals:
if (rsiValue < 30 && price < lowerBand && atrValue > atrThreshold) {
    // Generate buy signal
} else if (rsiValue > 70 && price > upperBand && atrValue > atrThreshold) {
    // Generate sell signal
}
In this composite analysis, a buy signal occurs when the market is oversold as indicated by the RSI, the price is touching the lower Bollinger Band, and ATR suggests adequate volatility. Conversely, a sell signal is generated under the opposite conditions.
- Visual Feedback on the Chart
To enhance user experience, the EA provides visual feedback when it generates signals. The following code demonstrates how this is implemented with clear chart markings:
void DrawTradeSignals() {
    if (buySignal) {
        // Draw buy signal on the chart
        ObjectCreate(0, "BuySignal" + IntegerToString(TimeCurrent()), OBJ_ARROW, 0, Time[0], price);
    } else if (sellSignal) {
        // Draw sell signal on the chart
        ObjectCreate(0, "SellSignal" + IntegerToString(TimeCurrent()), OBJ_ARROW, 0, Time[0], price);
    }
}
In summary, the Volatility Navigator EA's main logic revolves around systematically evaluating current market data via multiple indicators. By combining insights from the RSI, Bollinger Bands, and ATR, the EA can generate robust trading signals while also providing valuable visual feedback on the chart. This multifaceted approach enhances traders’ evaluations and ultimately aids in navigating volatile markets effectively.
Implementing Alerts and Notifications in the Volatility Navigator EA
The Volatility Navigator Expert Advisor (EA) is equipped with an integrated alert and notification system that enhances the trader's ability to respond to market conditions effectively. This system is essential for providing timely insights and alerts based on specific trading signals generated by the EA's core indicators: the Relative Strength Index (RSI), Bollinger Bands, and Average True Range (ATR).
- Types of Alerts in the EA
Audio Alerts: The EA is programmed to emit audio notifications whenever a significant trading signal is triggered. For example, when the RSI crosses above 70, indicating an overbought condition, or falls below 30, indicating an oversold condition, an audio alert will sound. These alerts allow traders to react immediately, enabling swift decision-making based on identified market opportunities.
Visual Alerts: In addition to audio cues, the EA incorporates visual alerts directly on the trading chart. For instance, when a trading signal is generated, the EA can change the color of the price line or display an on-screen message highlighting the nature of the signal (buy or sell). This feature allows traders to quickly glance at their charts and assess current market conditions without relying solely on audio notifications.
- Integration of Alerts in the EA Logic
The alerts and notifications within the Volatility Navigator EA are seamlessly integrated into its main trading logic:
During each OnTick execution, the EA continuously monitors the indicators for potential trading signals. When the EA detects that specific thresholds have been met, for example, the RSI crossing predefined, level an alert sequence is triggered. Once a trading signal is confirmed, the EA activates the corresponding alerts.
This activation process may include playing a sound or generating a visual marker on the chart. The alerts provide immediate feedback about market conditions, helping traders make quick and informed decisions. This engagement promotes active participation in the trading process, increasing the likelihood of capturing profitable market moves.
// Example of defining thresholds
double rsiValue = iRSI(NULL, 0, 14, PRICE_CLOSE);

// Check for overbought and oversold conditions
if (rsiValue > 70) {
    // Audio Alert
    PlaySound("alert.wav");
    // Visual Alert on Chart
    ObjectCreate("OverboughtAlert", OBJ_TEXT, 0, Time[0], High[0]);
    ObjectSetText("OverboughtAlert", "Overbought Signal!", 12, "Arial", clrRed);
    // Additional actions like placing an order can be added here
} else if (rsiValue < 30) {
    // Audio Alert
    PlaySound("alert.wav");
    // Visual Alert on Chart
    ObjectCreate("OversoldAlert", OBJ_TEXT, 0, Time[0], Low[0]);
    ObjectSetText("OversoldAlert", "Oversold Signal!", 12, "Arial", clrGreen);
    // Additional actions like placing an order can be added here
}
The code snippet provided is designed to implement audio and visual alerts within the Volatility Navigator Expert Advisor (EA) based on the behavior of the Relative Strength Index (RSI). First, the code calculates the current RSI value using the iRSI function, which takes the current chart symbol, timeframe, period (14), and closing price as inputs. It then checks if the RSI value exceeds the threshold of 70, signifying overbought conditions. If this condition is met, the PlaySound function is invoked to play an audio alert, prompting the trader's immediate attention.
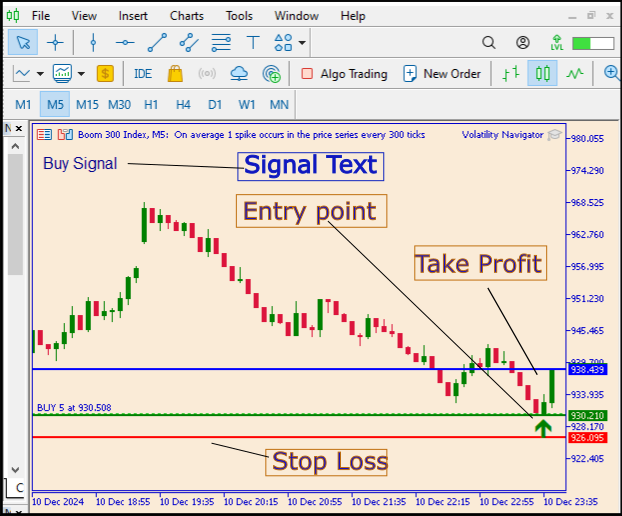
Fig 6. Visual Alerts
Moreover, a visual alert is created on the trading chart by placing a text object at the current high price level, denoting this overbought signal in red text to ensure it stands out. Conversely, if the RSI value drops below the threshold of 30, indicating oversold conditions, the same procedure is followed: an audio alert plays, and a text object is generated at the current low price level, this time displaying the signal in green.
This dual alert system, comprising both audio and visual elements, enhances the trader's ability to stay informed and react promptly to significant market movements, thereby improving overall trading efficiency.
The audio and visual alert system in the Volatility Navigator EA is designed to facilitate timely responses to changing market conditions. By implementing these alerts, the EA empowers traders to stay informed and ready to act, ultimately enhancing their overall trading efficiency and success.
Below is the complete code for the Expert Advisor (EA). This code contains all the necessary instructions and logic that govern its trading operations.
//+------------------------------------------------------------------+
//|                                         Volatility Navigator.mq5 |
//|                               Copyright 2024, Christian Benjamin |
//|                                             https://www.mql5.com |
//+------------------------------------------------------------------+
#property copyright   "2024, MetaQuotes Software Corp."
#property link        "https://www.mql5.com/en/users/lynnchris"
#property description "The EA analyzes market conditions using the Bollinger Bands, RSI and ATR indicators"
#property version     "1.1"
#property strict

// Input parameters for trading strategy
input int rsiPeriod = 14;                  // Period for RSI calculation
input double overboughtLevel = 70.0;       // RSI level for overbought condition
input double oversoldLevel = 30.0;         // RSI level for oversold condition
input int bbPeriod = 20;                    // Period for Bollinger Bands
input double bbDeviation = 2.0;             // Deviation for Bollinger Bands
input int atrPeriod = 14;                   // ATR period for stop loss and take profit calculations
input double atrMultiplier = 1.5;           // Multiplier for ATR in calculating stop loss and take profit
input string signalSound = "alert.wav";     // Sound file for alert notifications

// Indicator handles for Bollinger Bands and ATR
int bbHandle = 0;
int atrHandle = 0;

// Function to clear previous drawings from the chart
void ClearPreviousDrawings()
{
    // Delete any previously created trade lines and signal text
    if (ObjectFind(0, "EntryPoint") != -1)
        ObjectDelete(0, "EntryPoint");
    if (ObjectFind(0, "StopLoss") != -1)
        ObjectDelete(0, "StopLoss");
    if (ObjectFind(0, "TakeProfit") != -1)
        ObjectDelete(0, "TakeProfit");
    if (ObjectFind(0, "SignalText") != -1)
        ObjectDelete(0, "SignalText");
    if (ObjectFind(0, "BuyArrow") != -1)
        ObjectDelete(0, "BuyArrow");
    if (ObjectFind(0, "SellArrow") != -1)
        ObjectDelete(0, "SellArrow");
}

// Function to draw entry points, stop loss, and take profit on the chart
void DrawTradeLines(double entryPoint, double stopLoss, double takeProfit, string signalText)
{
    // Clear previous drawings before drawing new ones
    ClearPreviousDrawings();

    // Draw the entry point line
    if (!ObjectCreate(0, "EntryPoint", OBJ_HLINE, 0, TimeCurrent(), entryPoint))
        Print("Failed to create EntryPoint line. Error: ", GetLastError());
    ObjectSetInteger(0, "EntryPoint", OBJPROP_COLOR, clrGreen);
    ObjectSetInteger(0, "EntryPoint", OBJPROP_WIDTH, 2);

    // Draw the stop loss line
    if (!ObjectCreate(0, "StopLoss", OBJ_HLINE, 0, TimeCurrent(), stopLoss))
        Print("Failed to create StopLoss line. Error: ", GetLastError());
    ObjectSetInteger(0, "StopLoss", OBJPROP_COLOR, clrRed);
    ObjectSetInteger(0, "StopLoss", OBJPROP_WIDTH, 2);

    // Draw the take profit line
    if (!ObjectCreate(0, "TakeProfit", OBJ_HLINE, 0, TimeCurrent(), takeProfit))
        Print("Failed to create TakeProfit line. Error: ", GetLastError());
    ObjectSetInteger(0, "TakeProfit", OBJPROP_COLOR, clrBlue);
    ObjectSetInteger(0, "TakeProfit", OBJPROP_WIDTH, 2);

    // Draw a label with the signal text to provide information at a glance
    if (!ObjectCreate(0, "SignalText", OBJ_LABEL, 0, TimeCurrent(), entryPoint + 10))
        Print("Failed to create SignalText label. Error: ", GetLastError());
    ObjectSetInteger(0, "SignalText", OBJPROP_XDISTANCE, 10);
    ObjectSetInteger(0, "SignalText", OBJPROP_YDISTANCE, 30);
    ObjectSetInteger(0, "SignalText", OBJPROP_COLOR, clrWhite);
    ObjectSetInteger(0, "SignalText", OBJPROP_FONTSIZE, 12);
    ObjectSetString(0, "SignalText", OBJPROP_TEXT, signalText);
}

// Function to draw arrows on the chart at entry points
void DrawEntryArrow(double price, string label, color arrowColor)
{
    if (!ObjectCreate(0, label, OBJ_ARROW, 0, TimeCurrent(), price))
    {
        Print("Failed to create arrow object. Error: ", GetLastError());
        return;
    }
    ObjectSetInteger(0, label, OBJPROP_ARROWCODE, 233); // Arrow code for upward direction
    ObjectSetInteger(0, label, OBJPROP_COLOR, arrowColor);
    ObjectSetInteger(0, label, OBJPROP_WIDTH, 2);       // Set the width of the arrow
}

// Function to manage open positions for efficient trade execution
void ManageOpenPositions(string symbol)
{
    // Loop through all open positions
    for (int i = PositionsTotal() - 1; i >= 0; i--)
    {
        ulong ticket = PositionGetTicket(i);
        if (PositionSelectByTicket(ticket))
        {
            // Check if the position is for the current symbol
            if (PositionGetString(POSITION_SYMBOL) == symbol)
            {
                double currentProfit = PositionGetDouble(POSITION_PROFIT);
                Print("Current Profit for position: ", currentProfit);
                // Additional management logic can be added here (e.g., close position, update SL/TP)
            }
        }
    }
}

// Function to calculate trade parameters such as entry point, stop loss, and take profit
void CalculateTradeParameters()
{
    // Get the current RSI value
    double rsiValue = iRSI(Symbol(), PERIOD_CURRENT, rsiPeriod, PRICE_CLOSE);
    Print("RSI Value: ", rsiValue);

    double bbUpper = 0.0;
    double bbLower = 0.0;
    double atrValue = 0.0;

    // Get the latest closing prices
    double closePrices[];
    if (CopyClose(NULL, 0, 0, 1, closePrices) <= 0)
    {
        Print("Error copying close prices: ", GetLastError());
        return; // Exit if there's an error
    }

    // Initialize and get values for Bollinger Bands
    if (bbHandle == 0)
    {
        bbHandle = iBands(NULL, 0, bbPeriod, 0, bbDeviation, PRICE_CLOSE);
    }

    if (bbHandle != INVALID_HANDLE)
    {
        double bbBuffer[];
        // Get the upper and lower Bollinger Bands
        if (CopyBuffer(bbHandle, 1, 0, 1, bbBuffer) > 0)
        {
            bbUpper = bbBuffer[0]; // Upper band value
            Print("Bollinger Band Upper: ", bbUpper);
        }

        if (CopyBuffer(bbHandle, 2, 0, 1, bbBuffer) > 0)
        {
            bbLower = bbBuffer[0]; // Lower band value
            Print("Bollinger Band Lower: ", bbLower);
        }

        // Initialize and get the ATR value
        if (atrHandle == 0)
        {
            atrHandle = iATR(NULL, 0, atrPeriod);
        }

        if (atrHandle != INVALID_HANDLE)
        {
            double atrBuffer[];
            if (CopyBuffer(atrHandle, 0, 0, 1, atrBuffer) > 0)
            {
                atrValue = atrBuffer[0]; // Current ATR value
                Print("ATR Value: ", atrValue);
            }
        }

        double entryPoint, stopLoss, takeProfit;

        // Generate buy or sell signals based on Bollinger Bands and RSI values
        if (closePrices[0] < bbLower && rsiValue < oversoldLevel)  // Buy Condition
        {
            entryPoint = closePrices[0];
            stopLoss = entryPoint - (atrValue * atrMultiplier);
            takeProfit = entryPoint + (atrValue * atrMultiplier * 2);
            DrawTradeLines(entryPoint, stopLoss, takeProfit, "Buy Signal");
            DrawEntryArrow(entryPoint, "BuyArrow", clrGreen); // Draw Buy Arrow
            PlaySound(signalSound); // Notify with sound for new entry
        }
        else if (closePrices[0] > bbUpper && rsiValue > overboughtLevel)  // Sell Condition
        {
            entryPoint = closePrices[0];
            stopLoss = entryPoint + (atrValue * atrMultiplier); // Above entry for short position
            takeProfit = entryPoint - (atrValue * atrMultiplier * 2); // Below entry for short position
            DrawTradeLines(entryPoint, stopLoss, takeProfit, "Sell Signal");
            DrawEntryArrow(entryPoint, "SellArrow", clrRed); // Draw Sell Arrow
            PlaySound(signalSound); // Notify with sound for new entry
        }
    }
}

// Expert initialization function
int OnInit()
{
    // Initialization tasks can be done here
    return INIT_SUCCEEDED;
}

// Expert deinitialization function
void OnDeinit(const int reason)
{
    // Release the indicator handles when the EA is removed
    if (bbHandle != 0)
        IndicatorRelease(bbHandle);
    if (atrHandle != 0)
        IndicatorRelease(atrHandle);
    ClearPreviousDrawings(); // Clear drawings on removal
}

// Expert tick function
void OnTick()
{
    ManageOpenPositions(Symbol()); // Manage open positions before calculating new parameters
    CalculateTradeParameters(); // Calculate trade parameters based on market data
}

//+------------------------------------------------------------------+
Testing
To add the Volatility Navigator Expert Advisor (EA) onto a chart in MetaTrader 5 for testing, first, ensure your EA file is properly installed in the MetaTrader 5 platform. Navigate to the "Navigator" panel on the left side, and under the "Expert Advisors" section, find your EA. If it’s not visible, you may need to refresh the list by right-clicking and selecting "Refresh" or ensure that the EA files are placed in the correct directory (specifically, in the MQL5 > Experts folder within your MetaTrader installation).
Once located, simply drag the EA onto the desired chart or double-click it to open a settings window. There, you can configure parameters such as lot size and indicators based on your strategy. After configuring the settings, make sure to enable automated trading by clicking the "AutoTrading" button in the toolbar. Finally, click "OK" to apply the EA, and it will start executing trades based on the predefined strategy. Always check the "Trade" tab to monitor its activity during testing. In this project I developed, I have tested the Expert Advisor (EA) on a demo account. However, you can also backtest it using historical data before risking real money.
After dragging the EA onto the chart, it's essential to wait patiently for the signals to be generated once certain conditions are met by the indicators, as explained above. When these conditions are satisfied, the EA will display three lines on the chart: the stop loss, take profit, and entry point. Also, an audible alert will sound, signaling the trader, and this alert will persist until the most precise entry point is reached.
Below, we have illustrated the results of our tests for your review
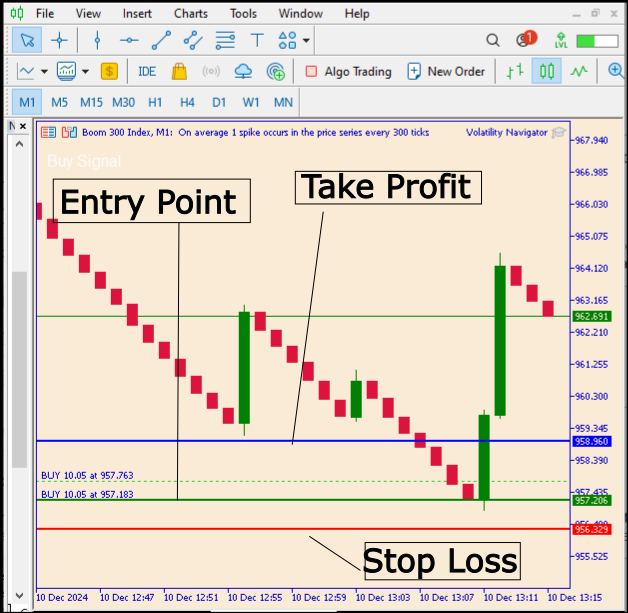
Fig 7. Test Results
In the diagram above, we can observe the orders I executed after receiving the signals, all of which are currently in profit. The diagram also displays the levels indicated by the signals as horizontal lines: the take profit level is shown in blue, the entry point in green, and the stop loss in red. Let’s also take a look at the GIF below for a broader insight.
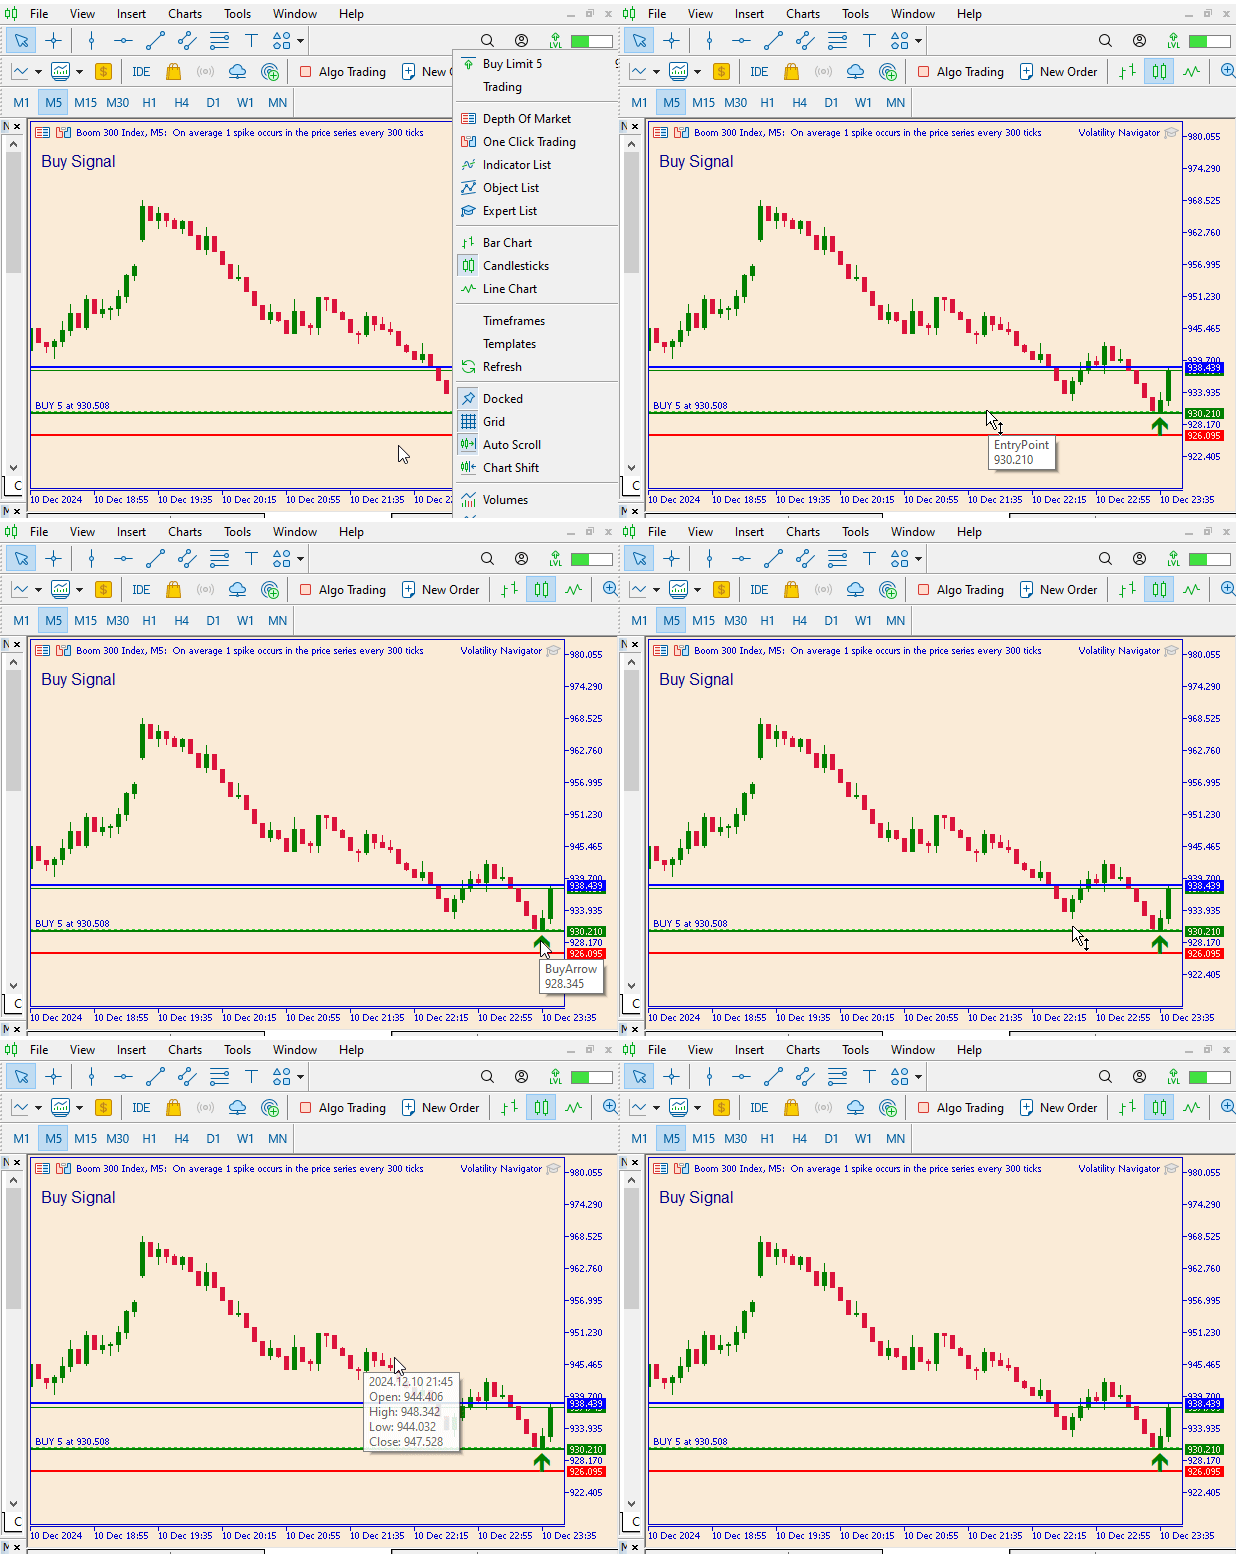
Fig 8. Test result
Conclusion
This tool primarily focuses on providing promising and profitable entry points, take profit levels, and stop loss placements. It can be applied to different charts and supports all time frames. For scalping entries, it is advisable to use shorter time frames, while longer trades can benefit from higher time frames. Additionally, it is beneficial to use this tool alongside your own strategies to enhance results.
Ensure you test and experiment with the tool before using real money. Please note that this tool does not open trades; my aim in this series is solely to develop tools for market analysis.
| Date | Tool Name | Description | Version | Updates | Notes |
|---|---|---|---|---|---|
| 01/10/24 | Chart Projector | Script to overlay the previous day's price action with ghost effect. | 1.0 | Initial Release | First tool in Lynnchris Tool Chest |
| 18/11/24 | Analytical Comment | It provides previous day's information in a tabular format, as well as anticipates the future direction of the market. | 1.0 | Initial Release | Second tool in the Lynnchris Tool Chest |
| 27/11/24 | Analytics Master | Regular Update of market metrics after every two hours | 1.01 | Second Release | Third tool in the Lynnchris Tool Chest |
| 02/12/2024 | Analytics Forecaster | Regular Update of market metrics after every two hours with telegram integration | 1.1 | Third Edition | Tool number 5 |
| 09/12/24 | Volatility Navigator | The EA analyzes market conditions using the Bollinger Bands, RSI and ATR indicators | 1.0 | Initial Release | Tool Number 6 |
Warning: All rights to these materials are reserved by MetaQuotes Ltd. Copying or reprinting of these materials in whole or in part is prohibited.
This article was written by a user of the site and reflects their personal views. MetaQuotes Ltd is not responsible for the accuracy of the information presented, nor for any consequences resulting from the use of the solutions, strategies or recommendations described.
 Building a Candlestick Trend Constraint Model (Part 9): Multiple Strategies Expert Advisor (III)
 Ensemble methods to enhance numerical predictions in MQL5
 Across Neighbourhood Search (ANS)
 Developing a Replay System (Part 54): The Birth of the First Module
- Free trading apps
- Over 8,000 signals for copying
- Economic news for exploring financial markets
You agree to website policy and terms of use
Simply go to the author's profile and then click on "Publications" ... Christian Benjamin (Publications)
could Mr Benjamin or anyone reading this tell me where I could find Parts 1-3 of this article?
Hello Sir, please follow the links provided below.
https://www.mql5.com/en/articles/16434
https://www.mql5.com/en/articles/15927
https://www.mql5.com/en/articles/16014
Simply go to the author's profile and then click on "Publications" ... Christian Benjamin (Publications)
Thank you sir!
May I ask what this EA is trading? I don't see it.
(C.Benjamin) Author says in header "TESTING" :
"After dragging the EA onto the chart, it's essential to wait patiently for the signals to be generated once certain conditions are met by the indicators, as explained above. When these conditions are satisfied, the EA will display three lines on the chart: the stop loss, take profit, and entry point. Also, an audible alert will sound, signaling the trader, and this alert will persist until the most precise entry point is reached."
EA code graphically shows ONLY THE SUGGESTED trade & also Alert