Articles on data analysis and statistics in MQL5
Articles on mathematical models and laws of probability are interesting for many traders. Mathematics is the basis of technical indicators, and statistics is required to analyze trading results and develop strategies.
Read about the fuzzy logic, digital filters, market profile, Kohonen maps, neural gas and many other tools that can be used for trading.
Add a new article

You are missing trading opportunities:
- Free trading apps
- Over 8,000 signals for copying
- Economic news for exploring financial markets
Registration
Log in
You agree to website policy and terms of use
If you do not have an account, please register


Marvel Your MQL5 Customers with a Usable Cocktail of Technologies!
MQL5 provides programmers with a very complete set of functions and object-oriented API thanks to which they can do everything they want within the MetaTrader environment. However, Web Technology is an extremely versatile tool nowadays that may come to the rescue in some situations when you need to do something very specific, want to marvel your customers with something different or simply you do not have enough time to master a specific part of MT5 Standard Library. Today's exercise walks you through a practical example about how you can manage your development time at the same time as you also create an amazing tech cocktail.

News Trading Made Easy (Part 2): Risk Management
In this article, inheritance will be introduced into our previous and new code. A new database design will be implemented to provide efficiency. Additionally, a risk management class will be created to tackle volume calculations.

Developing a Replay System — Market simulation (Part 02): First experiments (II)
This time, let's try a different approach to achieve the 1 minute goal. However, this task is not as simple as one might think.

Neural networks made easy (Part 16): Practical use of clustering
In the previous article, we have created a class for data clustering. In this article, I want to share variants of the possible application of obtained results in solving practical trading tasks.

Neural networks made easy (Part 15): Data clustering using MQL5
We continue to consider the clustering method. In this article, we will create a new CKmeans class to implement one of the most common k-means clustering methods. During tests, the model managed to identify about 500 patterns.

Neural networks made easy (Part 21): Variational autoencoders (VAE)
In the last article, we got acquainted with the Autoencoder algorithm. Like any other algorithm, it has its advantages and disadvantages. In its original implementation, the autoenctoder is used to separate the objects from the training sample as much as possible. This time we will talk about how to deal with some of its disadvantages.

Developing an Expert Advisor from scratch (Part 30): CHART TRADE as an indicator?
Today we are going to use Chart Trade again, but this time it will be an on-chart indicator which may or may not be present on the chart.

Econometric tools for forecasting volatility: GARCH model
The article describes the properties of the non-linear model of conditional heteroscedasticity (GARCH). The iGARCH indicator has been built on its basis for predicting volatility one step ahead. The ALGLIB numerical analysis library is used to estimate the model parameters.

Data label for time series mining(Part 1):Make a dataset with trend markers through the EA operation chart
This series of articles introduces several time series labeling methods, which can create data that meets most artificial intelligence models, and targeted data labeling according to needs can make the trained artificial intelligence model more in line with the expected design, improve the accuracy of our model, and even help the model make a qualitative leap!

Price Action Analysis Toolkit Development (Part 41): Building a Statistical Price-Level EA in MQL5
Statistics has always been at the heart of financial analysis. By definition, statistics is the discipline that collects, analyzes, interprets, and presents data in meaningful ways. Now imagine applying that same framework to candlesticks—compressing raw price action into measurable insights. How helpful would it be to know, for a specific period of time, the central tendency, spread, and distribution of market behavior? In this article, we introduce exactly that approach, showing how statistical methods can transform candlestick data into clear, actionable signals.

News Trading Made Easy (Part 1): Creating a Database
News trading can be complicated and overwhelming, in this article we will go through steps to obtain news data. Additionally we will learn about the MQL5 Economic Calendar and what it has to offer.

Hidden Markov Models for Trend-Following Volatility Prediction
Hidden Markov Models (HMMs) are powerful statistical tools that identify underlying market states by analyzing observable price movements. In trading, HMMs enhance volatility prediction and inform trend-following strategies by modeling and anticipating shifts in market regimes. In this article, we will present the complete procedure for developing a trend-following strategy that utilizes HMMs to predict volatility as a filter.

Advanced resampling and selection of CatBoost models by brute-force method
This article describes one of the possible approaches to data transformation aimed at improving the generalizability of the model, and also discusses sampling and selection of CatBoost models.

Tips from a professional programmer (Part III): Logging. Connecting to the Seq log collection and analysis system
Implementation of the Logger class for unifying and structuring messages which are printed to the Experts log. Connection to the Seq log collection and analysis system. Monitoring log messages online.

Trend Prediction with LSTM for Trend-Following Strategies
Long Short-Term Memory (LSTM) is a type of recurrent neural network (RNN) designed to model sequential data by effectively capturing long-term dependencies and addressing the vanishing gradient problem. In this article, we will explore how to utilize LSTM to predict future trends, enhancing the performance of trend-following strategies. The article will cover the introduction of key concepts and the motivation behind development, fetching data from MetaTrader 5, using that data to train the model in Python, integrating the machine learning model into MQL5, and reflecting on the results and future aspirations based on statistical backtesting.

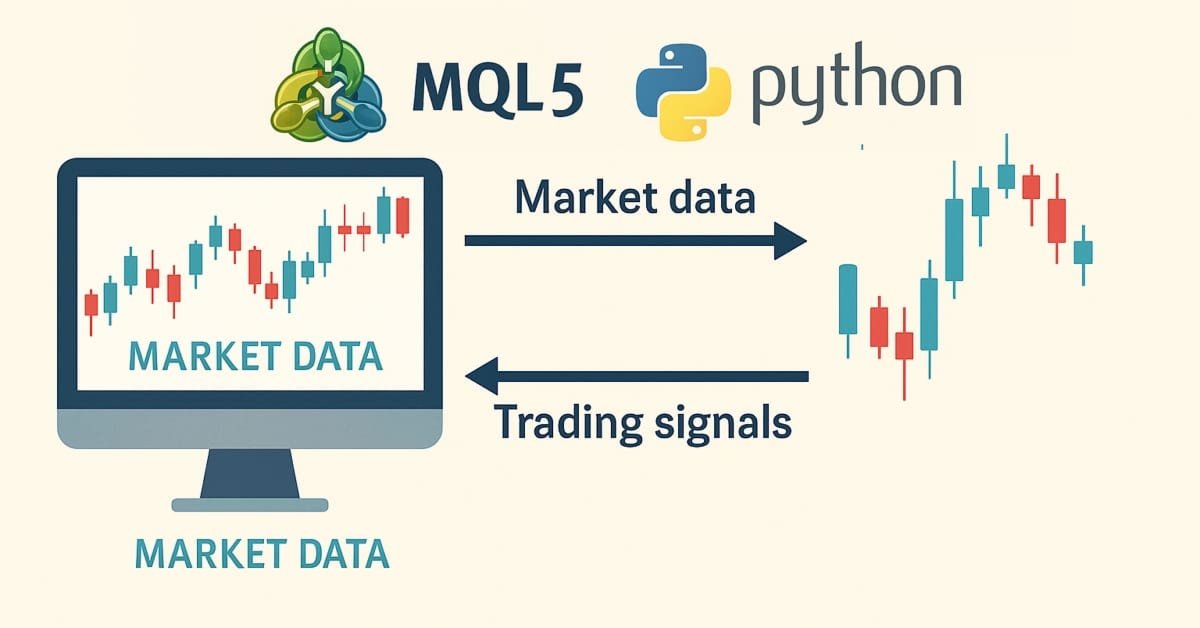
Python, ONNX and MetaTrader 5: Creating a RandomForest model with RobustScaler and PolynomialFeatures data preprocessing
In this article, we will create a random forest model in Python, train the model, and save it as an ONNX pipeline with data preprocessing. After that we will use the model in the MetaTrader 5 terminal.

Neural networks made easy (Part 25): Practicing Transfer Learning
In the last two articles, we developed a tool for creating and editing neural network models. Now it is time to evaluate the potential use of Transfer Learning technology using practical examples.

Price Action Analysis Toolkit Development (Part 11): Heikin Ashi Signal EA
MQL5 offers endless opportunities to develop automated trading systems tailored to your preferences. Did you know it can even perform complex mathematical calculations? In this article, we introduce the Japanese Heikin-Ashi technique as an automated trading strategy.

Building a Trading System (Part 3): Determining Minimum Risk Levels for Realistic Profit Targets
Every trader's ultimate goal is profitability, which is why many set specific profit targets to achieve within a defined trading period. In this article, we will use Monte Carlo simulations to determine the optimal risk percentage per trade needed to meet trading objectives. The results will help traders assess whether their profit targets are realistic or overly ambitious. Finally, we will discuss which parameters can be adjusted to establish a practical risk percentage per trade that aligns with trading goals.

Population optimization algorithms: Harmony Search (HS)
In the current article, I will study and test the most powerful optimization algorithm - harmonic search (HS) inspired by the process of finding the perfect sound harmony. So what algorithm is now the leader in our rating?

Price Action Analysis Toolkit Development (Part 21): Market Structure Flip Detector Tool
The Market Structure Flip Detector Expert Advisor (EA) acts as your vigilant partner, constantly observing shifts in market sentiment. By utilizing Average True Range (ATR)-based thresholds, it effectively detects structure flips and labels each Higher Low and Lower High with clear indicators. Thanks to MQL5’s swift execution and flexible API, this tool offers real-time analysis that adjusts the display for optimal readability and provides a live dashboard to monitor flip counts and timings. Furthermore, customizable sound and push notifications guarantee that you stay informed of critical signals, allowing you to see how straightforward inputs and helper routines can transform price movements into actionable strategies.

Reimagining Classic Strategies (Part 21): Bollinger Bands And RSI Ensemble Strategy Discovery
This article explores the development of an ensemble algorithmic trading strategy for the EURUSD market that combines the Bollinger Bands and the Relative Strength Indicator (RSI). Initial rule-based strategies produced high-quality signals but suffered from low trade frequency and limited profitability. Multiple iterations of the strategy were evaluated, revealing flaws in our understanding of the market, increased noise, and degraded performance. By appropriately employing statistical learning algorithms, shifting the modeling target to technical indicators, applying proper scaling, and combining machine learning forecasts with classical trading rules, the final strategy achieved significantly improved profitability and trade frequency while maintaining acceptable signal quality.

Timeseries in DoEasy library (part 54): Descendant classes of abstract base indicator
The article considers creation of classes of descendant objects of base abstract indicator. Such objects will provide access to features of creating indicator EAs, collecting and getting data value statistics of various indicators and prices. Also, create indicator object collection from which getting access to properties and data of each indicator created in the program will be possible.

Data Science and ML (Part 40): Using Fibonacci Retracements in Machine Learning data
Fibonacci retracements are a popular tool in technical analysis, helping traders identify potential reversal zones. In this article, we’ll explore how these retracement levels can be transformed into target variables for machine learning models to help them understand the market better using this powerful tool.
Population optimization algorithms
This is an introductory article on optimization algorithm (OA) classification. The article attempts to create a test stand (a set of functions), which is to be used for comparing OAs and, perhaps, identifying the most universal algorithm out of all widely known ones.

Price Action Analysis Toolkit Development (Part 31): Python Candlestick Recognition Engine (I) — Manual Detection
Candlestick patterns are fundamental to price-action trading, offering valuable insights into potential market reversals or continuations. Envision a reliable tool that continuously monitors each new price bar, identifies key formations such as engulfing patterns, hammers, dojis, and stars, and promptly notifies you when a significant trading setup is detected. This is precisely the functionality we have developed. Whether you are new to trading or an experienced professional, this system provides real-time alerts for candlestick patterns, enabling you to focus on executing trades with greater confidence and efficiency. Continue reading to learn how it operates and how it can enhance your trading strategy.

From Novice to Expert: Enhancing Liquidity Strategies with Multi-Timeframe Structural Confirmation in MQL5
The alignment of higher-timeframe liquidity structures with lower-timeframe reversal patterns can greatly influence both the likelihood and direction of the next price movement. By integrating structural liquidity zones from higher timeframes with precise reversal confirmations on lower timeframes, traders can improve entry timing and overall trade quality. This article demonstrates how to reinforce liquidity-based trading strategies through higher-timeframe structural confirmation—and how to implement this approach effectively using MQL5.

Cycles and Forex
Cycles are of great importance in our lives. Day and night, seasons, days of the week and many other cycles of different nature are present in the life of any person. In this article, we will consider cycles in financial markets.
Timeseries in DoEasy library (part 48): Multi-period multi-symbol indicators on one buffer in a subwindow
The article considers an example of creating multi-symbol multi-period standard indicators using a single indicator buffer for construction and working in the indicator subwindow. I am going to prepare the library classes for working with standard indicators working in the program main window and having more than one buffer for displaying their data.

Automating Trading Strategies in MQL5 (Part 27): Creating a Price Action Crab Harmonic Pattern with Visual Feedback
In this article, we develop a Crab Harmonic Pattern system in MQL5 that identifies bullish and bearish Crab harmonic patterns using pivot points and Fibonacci ratios, triggering trades with precise entry, stop loss, and take-profit levels. We incorporate visual feedback through chart objects like triangles and trendlines to display the XABCD pattern structure and trade levels.

Currency pair strength indicator in pure MQL5
We are going to develop a professional indicator for currency strength analysis in MQL5. This step-by-step guide will show you how to develop a powerful trading tool with a visual dashboard for MetaTrader 5. You will learn how to calculate the strength of currency pairs across multiple timeframes (H1, H4, D1), implement dynamic data updates, and create a user-friendly interface.

Price Action Analysis Toolkit Development (Part 23): Currency Strength Meter
Do you know what really drives a currency pair’s direction? It’s the strength of each individual currency. In this article, we’ll measure a currency’s strength by looping through every pair it appears in. That insight lets us predict how those pairs may move based on their relative strengths. Read on to learn more.

Algorithmic Trading Without the Routine: Quick Trade Analysis in MetaTrader 5 with SQLite
The article presents a minimal working set for maintaining a trading journal in MQL5 using SQLite: a table structure for trades, signals, and events, indices, prepared statements and trades, as well as standard analytical SQL queries. Integration with the statistics dashboard in MetaTrader 5 and working with the database via MetaEditor are demonstrated. The approach allows automating the journal, accelerating calculations, and performing analysis without complicating the EA code.
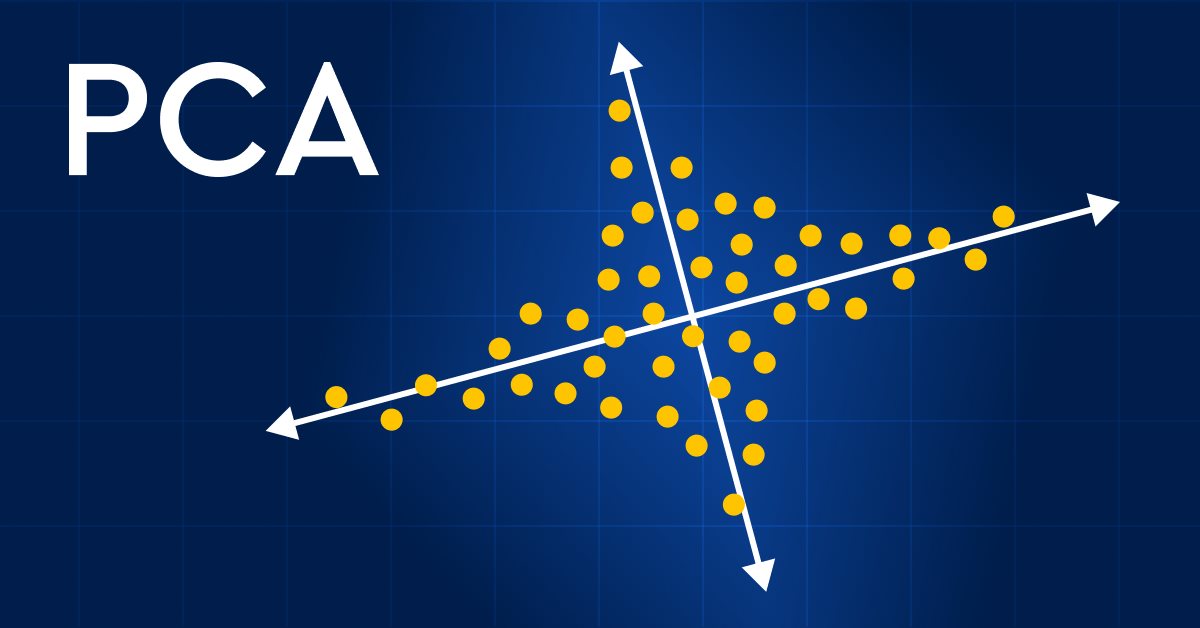
Data Science and Machine Learning (Part 13): Improve your financial market analysis with Principal Component Analysis (PCA)
Revolutionize your financial market analysis with Principal Component Analysis (PCA)! Discover how this powerful technique can unlock hidden patterns in your data, uncover latent market trends, and optimize your investment strategies. In this article, we explore how PCA can provide a new lens for analyzing complex financial data, revealing insights that would be missed by traditional approaches. Find out how applying PCA to financial market data can give you a competitive edge and help you stay ahead of the curve

Category Theory (Part 9): Monoid-Actions
This article continues the series on category theory implementation in MQL5. Here we continue monoid-actions as a means of transforming monoids, covered in the previous article, leading to increased applications.
Price Action Analysis Toolkit Development (Part 35): Training and Deploying Predictive Models
Historical data is far from “trash”—it’s the foundation of any robust market analysis. In this article, we’ll take you step‑by‑step from collecting that history to using it to train a predictive model, and finally deploying that model for live price forecasts. Read on to learn how!

Population optimization algorithms: Gravitational Search Algorithm (GSA)
GSA is a population optimization algorithm inspired by inanimate nature. Thanks to Newton's law of gravity implemented in the algorithm, the high reliability of modeling the interaction of physical bodies allows us to observe the enchanting dance of planetary systems and galactic clusters. In this article, I will consider one of the most interesting and original optimization algorithms. The simulator of the space objects movement is provided as well.

MQL5 Wizard Techniques you should know (Part 09): Pairing K-Means Clustering with Fractal Waves
K-Means clustering takes the approach to grouping data points as a process that’s initially focused on the macro view of a data set that uses random generated cluster centroids before zooming in and adjusting these centroids to accurately represent the data set. We will look at this and exploit a few of its use cases.

Data Science and Machine Learning (Part 21): Unlocking Neural Networks, Optimization algorithms demystified
Dive into the heart of neural networks as we demystify the optimization algorithms used inside the neural network. In this article, discover the key techniques that unlock the full potential of neural networks, propelling your models to new heights of accuracy and efficiency.

Building a Trading System (Part 4): How Random Exits Influence Trading Expectancy
Many traders have experienced this situation, often stick to their entry criteria but struggle with trade management. Even with the right setups, emotional decision-making—such as panic exits before trades reach their take-profit or stop-loss levels—can lead to a declining equity curve. How can traders overcome this issue and improve their results? This article will address these questions by examining random win-rates and demonstrating, through Monte Carlo simulation, how traders can refine their strategies by taking profits at reasonable levels before the original target is reached.