Articles with examples of indicators developed in MQL5
The articles contain detailed explanation of the attached codes. Download and open them in MetaEditor and program together with the author while reading the article.
Add a new article

You are missing trading opportunities:
- Free trading apps
- Over 8,000 signals for copying
- Economic news for exploring financial markets
Registration
Log in
You agree to website policy and terms of use
If you do not have an account, please register

Building a Liquidity Spectrum Volume Profile Indicator in MQL5
Build a Liquidity Spectrum Volume Profile in MQL5 that allocates volume to equal price bins over a chosen lookback using candle close prices. The guide covers data retrieval with copy functions, binning and normalization, and drawing rectangles and POC lines with chart objects and time offsets to reveal high-activity liquidity zones on the chart.

Mastering Kagi Charts in MQL5 (Part I): Creating the Indicator
Learn how to build a complete Kagi Chart engine in MQL5—constructing price reversals, generating dynamic line segments, and updating Kagi structures in real time. This first part teaches you how to render Kagi charts directly on MetaTrader 5, giving traders a clear view of trend shifts and market strength while preparing for automated Kagi-based trading logic in Part 2.

Introduction to MQL5 (Part 42): Beginner Guide to File Handling in MQL5 (IV)
This article shows how to build an MQL5 indicator that reads a CSV trading history, extracts Profit($) values and total trades, and computes a cumulative balance progression. We plot the curve in a separate indicator window, auto-scale the Y-axis, and draw horizontal and vertical axes for alignment. The indicator updates on a timer and redraws only when new trades appear. Optional labels display per-trade profit and loss to help assess performance and drawdowns directly on the chart.

Simple solutions for handling indicators conveniently
In this article, I will describe how to make a simple panel to change the indicator settings directly from the chart, and what changes need to be made to the indicator to connect the panel. This article is intended for novice MQL5 users.

SQLite capabilities in MQL5: Example of a dashboard with trading statistics by symbols and magic numbers
In this article, we will consider creating an indicator that displays trading statistics on a dashboard by account and by symbols and trading strategies. We will implement the code based on examples from the Documentation and the article on working with databases.

Market Profile indicator (Part 2): Optimization and rendering on canvas
The article considers an optimized version of the Market Profile indicator, where rendering with multiple graphical objects is replaced with rendering on a canvas - an object of the CCanvas class.

Angle-based operations for traders
This article will cover angle-based operations. We will look at methods for constructing angles and using them in trading.

How to Detect Round-Number Liquidity in MQL5
The article presents an MQL5 method for detecting psychological round numbers by converting prices to strings and counting trailing zeros (ZeroSize). It outlines the theory of institutional liquidity at integers, explains the GetZeroCount logic with tick-size normalization to avoid floating‑point errors, and details hierarchical visualization. Case studies across forex, metals, and crypto, plus timeframe filters and inputs, show how to use confluence and basic risk controls in practice.

Automating Market Memory Zones Indicator: Where Price is Likely to Return
This article turns Market Memory Zones from a chart-only concept into a complete MQL5 Expert Advisor. It automates Displacement, Structure Transition (CHoCH), and Liquidity Sweep zones using ATR- and candle-structure filters, applies lower-timeframe confirmation, and enforces risk-based position sizing with dynamic SL and structure-based TP. You will get the code architecture for detection, entries, trade management, and visualization, plus a brief backtest review.

Creating Custom Indicators in MQL5 (Part 11): Enhancing the Footprint Chart with Market Structure and Order Flow Layers
This article extends the MQL5 footprint chart with market-structure and order-flow layers: volume-profile bars, point of control, value-area highlighting, stacked imbalance detection, absorption zones, and single-print/unfinished markers. We expand bar data structures, add functions for POC/value area, imbalance, and absorption, and build a fixed-order rendering pipeline. You will get ready-to-use inputs, metadata, and drawing utilities to integrate and customize these layers in your indicator.
Price Action Analysis Toolkit Development (Part 22): Correlation Dashboard
This tool is a Correlation Dashboard that calculates and displays real-time correlation coefficients across multiple currency pairs. By visualizing how pairs move in relation to one another, it adds valuable context to your price-action analysis and helps you anticipate inter-market dynamics. Read on to explore its features and applications.

Indicator of historical positions on the chart as their profit/loss diagram
In this article, I will consider the option of obtaining information about closed positions based on their trading history. Besides, I will create a simple indicator that displays the approximate profit/loss of positions on each bar as a diagram.

Chaos theory in trading (Part 2): Diving deeper
We continue our dive into chaos theory in financial markets. This time I will consider its applicability to the analysis of currencies and other assets.

Custom Indicator: Plotting Partial Entry, Exit and Reversal Deals for Netting Accounts
In this article, we will look at a non-standard way of creating an indicator in MQL5. Instead of focusing on a trend or chart pattern, our goal will be to manage our own positions, including partial entries and exits. We will make extensive use of dynamic matrices and some trading functions related to trade history and open positions to indicate on the chart where these trades were made.

Building A Candlestick Trend Constraint Model (Part 4): Customizing Display Style For Each Trend Wave
In this article, we will explore the capabilities of the powerful MQL5 language in drawing various indicator styles on Meta Trader 5. We will also look at scripts and how they can be used in our model.

Elastic net regression using coordinate descent in MQL5
In this article we explore the practical implementation of elastic net regression to minimize overfitting and at the same time automatically separate useful predictors from those that have little prognostic power.

Polynomial models in trading
This article is about orthogonal polynomials. Their use can become the basis for a more accurate and effective analysis of market information allowing traders to make more informed decisions.

Category Theory in MQL5 (Part 5): Equalizers
Category Theory is a diverse and expanding branch of Mathematics which is only recently getting some coverage in the MQL5 community. These series of articles look to explore and examine some of its concepts & axioms with the overall goal of establishing an open library that provides insight while also hopefully furthering the use of this remarkable field in Traders' strategy development.

From Novice to Expert: Automating Intraday Strategies
We translate the EMA‑50 retest idea into a behavior‑driven Expert Advisor for intraday trading. The study formalizes trend bias, EMA interaction (pierce and close), reaction confirmation, and optional filters, then implements them in MQL5 with modular functions and resource‑safe handles. Visual testing in the Strategy Tester verifies signal correctness. The result is a clear template for coding discretionary bounces.

Building a Volume Bubble Indicator in MQL5 Using Standard Deviation
The article demonstrates how to build a Volume Bubble Indicator in MQL5 that visualizes market activity using statistical normalization. It covers how to work with tick and real volume, compute the mean and standard deviation over a rolling window, and normalize volume values to identify relative strength. You will implement chart objects to display bubbles with dynamic size and color, providing a clear representation of volume intensity directly on the chart.

Price Action Analysis Toolkit Development (Part 69): Flag Pattern Detection in MQL5
This article shows how to convert subjective flag recognition into reproducible MQL5 logic for live charts. It combines ATR-normalized pole strength, retracement limits, consolidation structure checks, breakout confirmation, and overlap control. Readers gain a workable approach that renders adaptive channels and zones, updates active setups efficiently, and provides optional alerts for newly confirmed patterns.

Sigma Score Indicator for MetaTrader 5: A Simple Statistical Anomaly Detector
Build a practical MetaTrader 5 “Sigma Score” indicator from scratch and learn what it really measures: The z-score of log returns (how many standard deviations the latest move is from the recent average). The article walks through every code block in OnInit(), OnCalculate(), and OnDeinit(), then shows how to interpret thresholds (e.g., ±2) and apply the Sigma Score as a simple “market stress meter” for mean-reversion and momentum trading.

From Novice to Expert: Backend Operations Monitor using MQL5
Using a ready-made solution in trading without concerning yourself with the internal workings of the system may sound comforting, but this is not always the case for developers. Eventually, an upgrade, misperformance, or unexpected error will arise, and it becomes essential to trace exactly where the issue originates to diagnose and resolve it quickly. Today’s discussion focuses on uncovering what normally happens behind the scenes of a trading Expert Advisor, and on developing a custom dedicated class for displaying and logging backend processes using MQL5. This gives both developers and traders the ability to quickly locate errors, monitor behavior, and access diagnostic information specific to each EA.

Adaptive Malaysian Engulfing Indicator (Part 2): Optimized Retest Bar Range
The article adds a self-adaptive layer to the Malaysian Engulfing indicator by optimizing the retest bar range with a constrained brute-force search scored by MFE and MAE. It details the data model, helper routines, and an MQL5 implementation that gathers historical setups, computes excursions, and selects the best parameter. Readers learn how to remove manual tuning and run the indicator with context-appropriate settings across symbols and timeframes.

How can century-old functions update your trading strategies?
This article considers the Rademacher and Walsh functions. We will explore ways to apply these functions to financial time series analysis and also consider various applications for them in trading.

Triangular and Sawtooth Waves: Analytical Tools for Traders
Wave analysis is one of the methods used in technical analysis. This article focuses on two less conventional wave patterns: triangular and sawtooth waves. These formations underpin a number of technical indicators designed for market price analysis.

Creating Custom Indicators in MQL5 (Part 8): Adding Volume Integration for Deeper Market Profile Analysis
In this article, we enhance the hybrid Time Price Opportunity (TPO) market profile indicator in MQL5 by integrating volume data to calculate volume-based point of control, value areas, and volume-weighted average price with customizable highlighting options. The system introduces advanced features like initial balance detection, key level extension lines, split profiles, and alternative TPO characters such as squares or circles for improved visual analysis across multiple timeframes.

Creating Custom Indicators in MQL5 (Part 3): Multi-Gauge Enhancements with Sector and Round Styles
In this article, we enhance the gauge-based indicator in MQL5 to support multiple oscillators, allowing user selection through an enumeration for single or combined displays. We introduce sector and round gauge styles via derived classes from a base gauge framework, improving case rendering with arcs, lines, and polygons for a more refined visual appearance.

The MQL5 Standard Library Explorer (Part 7): Interactive Position Labeling with CCanvas
In this article, we explore how to build a position information visualization tool using the MQL5 Standard Library’s CCanvas. This project strengthens your skills in working with library modules while providing traders with a practical tool to visualize and interact with open positions directly on a live chart. Join the discussion to learn more.

Applying L1 Trend Filtering in MetaTrader 5
This article explores the practical application of L1 trend filtering in MetaTrader 5, covering both its mathematical foundations and usage in MQL5 programs. The L1 filter enables extraction of piecewise-linear trends that preserve essential market structure while reducing price noise. The study analyzes parameter scaling, trend estimation behavior, and integration of the method into algorithmic trading strategies. Experimental results demonstrate how L1 trend filtering can enhance signal stability, trade timing, and overall robustness of trading systems.

Building an EquiVolume Indicator in MQL5
We implement an EquiVolume indicator in MQL5 that converts standard candlesticks into volume-weighted boxes. The workflow includes selecting volume type, detecting the maximum volume within a lookback range, normalizing all values against it, and mapping them into proportional box widths. The result is a chart-based structure that visualizes trading activity intensity alongside price movement in MetaTrader 5.

Analyzing Overbought and Oversold Trends Via Chaos Theory Approaches
We determine the overbought and oversold condition of the market according to chaos theory: integrating the principles of chaos theory, fractal geometry and neural networks to forecast financial markets. The study demonstrates the use of the Lyapunov exponent as a measure of market randomness and the dynamic adaptation of trading signals. The methodology includes an algorithm for generating fractal noise, hyperbolic tangent activation, and moment optimization.

Package-based approach with KnitPkg for MQL5 development
For maximum reliability and productivity in MetaTrader products built with MQL, this article advocates a development approach based on reusable “packages” managed by KnitPkg, a project manager for MQL5/MQL4. A package can be used as a building block for other packages or as the foundation for final artifacts that run directly on the MetaTrader platform, such as EAs, indicators, and more.

How to Detect and Normalize Chart Objects in MQL5 (Part 1): Building a Chart Object Detection Engine
This article addresses the interpretative gap between visual chart objects and algorithmic execution. You will build a systematic detector that iterates over all chart objects, identifies analytical types, and normalises their geometric data (time and price coordinates) into a structured SChartObjectInfo array. The implementation uses raw MQL5 functions, a filter‑extract‑store pipeline, and a timer‑driven test EA, resulting in a reusable framework for rule‑based trading inputs.

Creating Custom Indicators in MQL5 (Part 5): WaveTrend Crossover Evolution Using Canvas for Fog Gradients, Signal Bubbles, and Risk Management
In this article, we enhance the Smart WaveTrend Crossover indicator in MQL5 by integrating canvas-based drawing for fog gradient overlays, signal boxes that detect breakouts, and customizable buy/sell bubbles or triangles for visual alerts. We incorporate risk management features with dynamic take-profit and stop-loss levels calculated via candle multipliers or percentages, displayed through lines and a table, alongside options for trend filtering and box extensions.

Tracking Account Dynamics: Balance, Equity, and Floating P/L Visualization in MQL5
Create a custom MT5 indicator that processes the entire deal history and plots starting balance, balance, equity, and floating P/L as continuous curves. It updates per bar, aggregates positions across symbols, and avoids external dependencies through local caching. Use it to inspect equity–balance divergence, realized vs. unrealized results, and the timing of risk deployment.

Building A Candlestick Trend Constraint Model (Part 6): All in one integration
One major challenge is managing multiple chart windows of the same pair running the same program with different features. Let's discuss how to consolidate several integrations into one main program. Additionally, we will share insights on configuring the program to print to a journal and commenting on the successful signal broadcast on the chart interface. Find more information in this article as we progress the article series.

Price Action Analysis Toolkit Development (Part 18): Introducing Quarters Theory (III) — Quarters Board
In this article, we enhance the original Quarters Script by introducing the Quarters Board, a tool that lets you toggle quarter levels directly on the chart without needing to revisit the code. You can easily activate or deactivate specific levels, and the EA also provides trend direction commentary to help you better understand market movements.

From Novice to Expert: Adaptive Risk Management for Liquidity Strategies
In this article, we explore practical and robust risk management techniques specifically tailored for liquidity-based trading. You will learn how to protect positions during retests, handle false breakouts with confidence, and identify signs of potential level manipulation. By the end, you will have built an adaptive Expert Advisor capable of managing zone flips and executing strategic pending orders with integrated risk control.
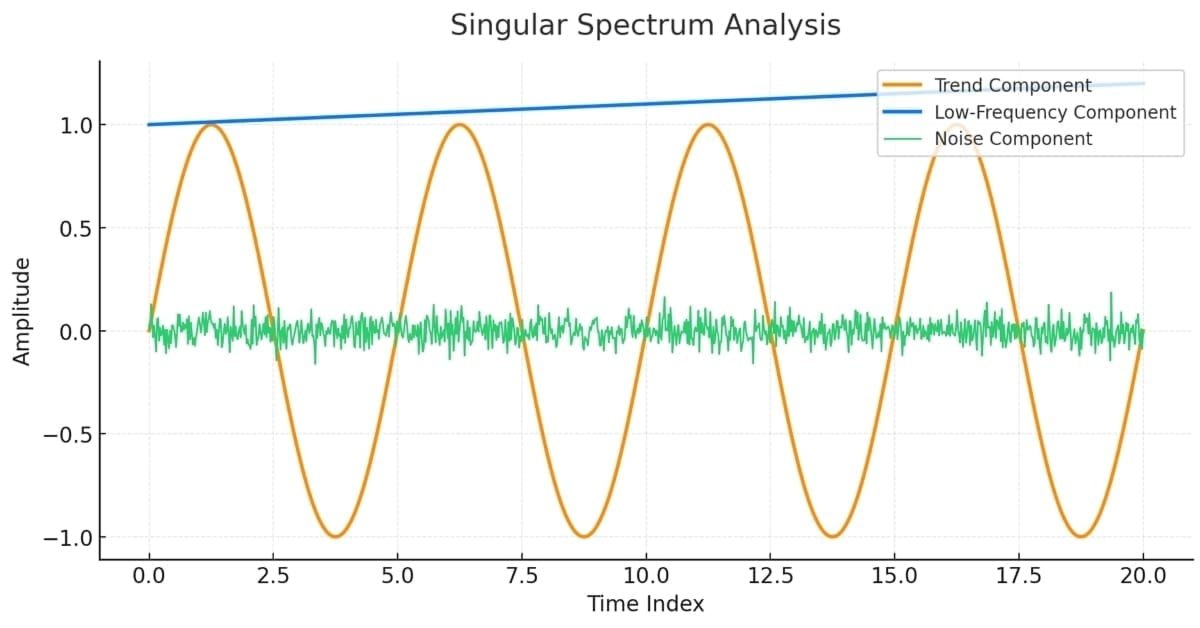
Singular Spectrum Analysis in MQL5
This article is meant as a guide for those unfamiliar with the concept of Singular Spectrum Analysis and who wish to gain enough understanding to be able to apply the built-in tools available in MQL5.