Articles with examples of indicators developed in MQL5
The articles contain detailed explanation of the attached codes. Download and open them in MetaEditor and program together with the author while reading the article.
Add a new article

You are missing trading opportunities:
- Free trading apps
- Over 8,000 signals for copying
- Economic news for exploring financial markets
Registration
Log in
You agree to website policy and terms of use
If you do not have an account, please register

Price Action Analysis Toolkit Development (Part 31): Python Candlestick Recognition Engine (I) — Manual Detection
Candlestick patterns are fundamental to price-action trading, offering valuable insights into potential market reversals or continuations. Envision a reliable tool that continuously monitors each new price bar, identifies key formations such as engulfing patterns, hammers, dojis, and stars, and promptly notifies you when a significant trading setup is detected. This is precisely the functionality we have developed. Whether you are new to trading or an experienced professional, this system provides real-time alerts for candlestick patterns, enabling you to focus on executing trades with greater confidence and efficiency. Continue reading to learn how it operates and how it can enhance your trading strategy.

Swing Extremes and Pullbacks in MQL5 (Part 2): Automating the Strategy with an Expert Advisor
Built on lower-timeframe market structure, and then orchestrated on the higher-timeframe, this indicator detects swing extremes where price becomes statistically vulnerable to reversal. It visualizes overextension and pullback zones, offering early insight into mean-reversion behavior.

Price Action Analysis Toolkit Development (Part 23): Currency Strength Meter
Do you know what really drives a currency pair’s direction? It’s the strength of each individual currency. In this article, we’ll measure a currency’s strength by looping through every pair it appears in. That insight lets us predict how those pairs may move based on their relative strengths. Read on to learn more.

Developing a trading Expert Advisor from scratch (Part 14): Adding Volume At Price (II)
Today we will add some more resources to our EA. This interesting article can provide some new ideas and methods of presenting information. At the same time, it can assist in fixing minor flaws in your projects.

Example of new Indicator and Conditional LSTM
This article explores the development of an Expert Advisor (EA) for automated trading that combines technical analysis with deep learning predictions.
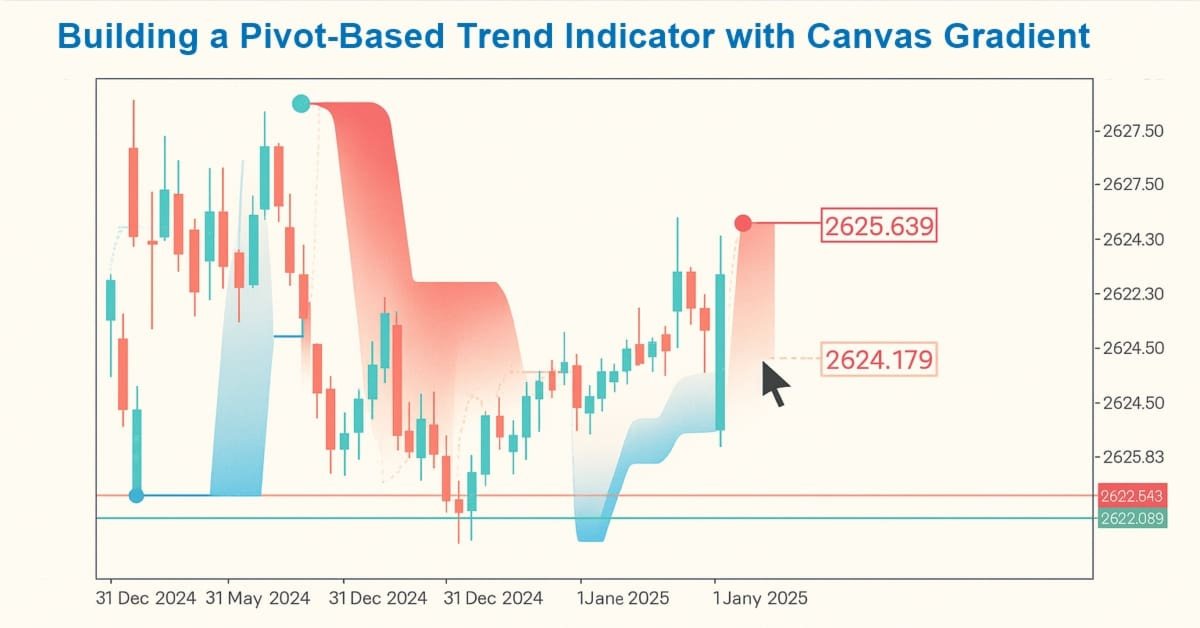
Creating Custom Indicators in MQL5 (Part 1): Building a Pivot-Based Trend Indicator with Canvas Gradient
In this article, we create a Pivot-Based Trend Indicator in MQL5 that calculates fast and slow pivot lines over user-defined periods, detects trend directions based on price relative to these lines, and signals trend starts with arrows while optionally extending lines beyond the current bar. The indicator supports dynamic visualization with separate up/down lines in customizable colors, dotted fast lines that change color on trend shifts, and optional gradient filling between lines, using a canvas object for enhanced trend-area highlighting.

Creating a ticker tape panel: Improved version
How do you like the idea of reviving the basic version of our ticker tape panel? The first thing we will do is change the panel to be able to add an image, such as an asset logo or some other image, so that the user could quickly and easily identify the displayed symbol.

Price Action Analysis Toolkit Development (Part 30): Commodity Channel Index (CCI), Zero Line EA
Automating price action analysis is the way forward. In this article, we utilize the Dual CCI indicator, the Zero Line Crossover strategy, EMA, and price action to develop a tool that generates trade signals and sets stop-loss (SL) and take-profit (TP) levels using ATR. Please read this article to learn how we approach the development of the CCI Zero Line EA.
Timeseries in DoEasy library (part 53): Abstract base indicator class
The article considers creation of an abstract indicator which further will be used as the base class to create objects of library’s standard and custom indicators.

Developing a Trading System Based on the Order Book (Part I): Indicator
Depth of Market is undoubtedly a very important element for executing fast trades, especially in High Frequency Trading (HFT) algorithms. In this series of articles, we will look at this type of trading events that can be obtained through a broker on many tradable symbols. We will start with an indicator, where you can customize the color palette, position and size of the histogram displayed directly on the chart. We will also look at how to generate BookEvent events to test the indicator under certain conditions. Other possible topics for future articles include how to store price distribution data and how to use it in a strategy tester.

The Parafrac V2 Oscillator: Integrating Parabolic SAR with Average True Range
The Parafrac V2 Oscillator is an advanced technical analysis tool that integrates the Parabolic SAR with the Average True Range (ATR) to overcome limitations of its predecessor, which relied on fractals and was prone to signal spikes overshadowing previous and current signals. By leveraging ATR’s volatility measure, the version 2 offers a smoother, more reliable method for detecting trends, reversals, and divergences, helping traders reduce chart congestion and analysis paralysis.

Timeseries in DoEasy library (part 52): Cross-platform nature of multi-period multi-symbol single-buffer standard indicators
In the article, consider creation of multi-symbol multi-period standard indicator Accumulation/Distribution. Slightly improve library classes with respect to indicators so that, the programs developed for outdated platform MetaTrader 4 based on this library could work normally when switching over to MetaTrader 5.

Chart Synchronization for Easier Technical Analysis
Chart Synchronization for Easier Technical Analysis is a tool that ensures all chart timeframes display consistent graphical objects like trendlines, rectangles, or indicators across different timeframes for a single symbol. Actions such as panning, zooming, or symbol changes are mirrored across all synced charts, allowing traders to seamlessly view and compare the same price action context in multiple timeframes.

Introduction to MQL5 (Part 13): A Beginner's Guide to Building Custom Indicators (II)
This article guides you through building a custom Heikin Ashi indicator from scratch and demonstrates how to integrate custom indicators into an EA. It covers indicator calculations, trade execution logic, and risk management techniques to enhance automated trading strategies.

Price Action Analysis Toolkit Development (Part 24): Price Action Quantification Analysis Tool
Candlestick patterns offer valuable insights into potential market moves. Some single candles signal continuation of the current trend, while others foreshadow reversals, depending on their position within the price action. This article introduces an EA that automatically identifies four key candlestick formations. Explore the following sections to learn how this tool can enhance your price-action analysis.

Adaptive Malaysian Engulfing Indicator (Part 1): Pattern Detection and Retest Validation
Implement the Malaysian Engulfing concept in MQL5 with two coordinated indicators. One applies strict, body‑based engulfing rules for precise pattern detection; the other uses a state-driven model to monitor what follows—pullbacks and timed retests—directly on the chart. The result is a repeatable, rule-based workflow that replaces visual guesswork with programmable logic.

The MQL5 Standard Library Explorer (Part 9): Using ALGLIB to Filter Excessive MA Crossover Signals
During sideways price movements, traders face excessive signals from multiple moving average crossovers. Today, we discuss how ALGLIB preprocesses raw price data to produce filtered crossover layers, which can also generate alerts when they occur. Join this discussion to learn how a mathematical library can be leveraged in MQL5 programs.
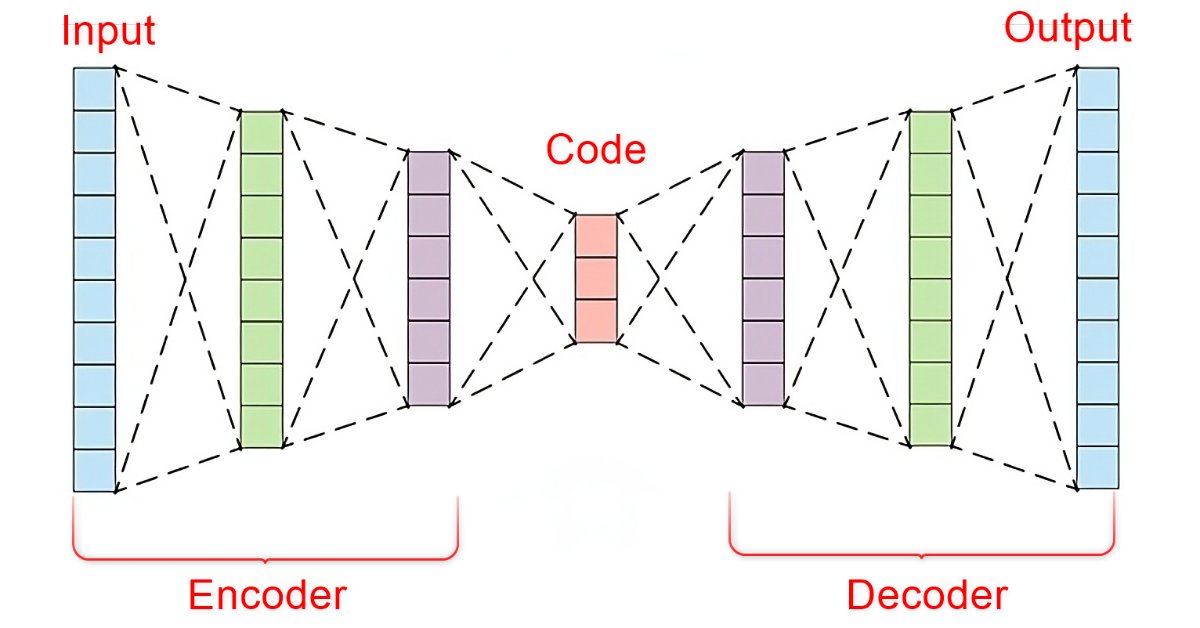
Data Science and Machine Learning (Part 22): Leveraging Autoencoders Neural Networks for Smarter Trades by Moving from Noise to Signal
In the fast-paced world of financial markets, separating meaningful signals from the noise is crucial for successful trading. By employing sophisticated neural network architectures, autoencoders excel at uncovering hidden patterns within market data, transforming noisy input into actionable insights. In this article, we explore how autoencoders are revolutionizing trading practices, offering traders a powerful tool to enhance decision-making and gain a competitive edge in today's dynamic markets.

Creating Custom Indicators in MQL5 (Part 2): Building a Gauge-Style RSI Display with Canvas and Needle Mechanics
In this article, we develop a gauge-style RSI indicator in MQL5 that visualizes Relative Strength Index values on a circular scale with a dynamic needle, color-coded ranges for overbought and oversold levels, and customizable legends. We utilize the Canvas class to draw elements like arcs, ticks, and pies, ensuring smooth updates on new RSI data.

Developing Market Memory Zones Indicator: Where Price Is Likely To Return
In this discussion, we will develop an indicator to identify price zones created by strong market activity, such as impulsive moves, structure shifts, and liquidity events. These zones represent areas where the market has left “memory” due to unfilled orders or rapid price displacement. By marking these regions on the chart, the indicator highlights where price is statistically more likely to revisit and react in the future.

Introduction to MQL5 (Part 11): A Beginner's Guide to Working with Built-in Indicators in MQL5 (II)
Discover how to develop an Expert Advisor (EA) in MQL5 using multiple indicators like RSI, MA, and Stochastic Oscillator to detect hidden bullish and bearish divergences. Learn to implement effective risk management and automate trades with detailed examples and fully commented source code for educational purposes!

Discrete Hartley transform
In this article, we will consider one of the methods of spectral analysis and signal processing - the discrete Hartley transform. It allows filtering signals, analyzing their spectrum and much more. The capabilities of DHT are no less than those of the discrete Fourier transform. However, unlike DFT, DHT uses only real numbers, which makes it more convenient for implementation in practice, and the results of its application are more visual.

Price Action Analysis Toolkit Development (Part 68): Price-Attached RSI Panel in MQL5
We present a chart-embedded RSI panel that removes the need for a separate window by attaching momentum directly to live price. The article explains the design and MQL5 code: real-time RSI retrieval, slope-based signal classification, and adaptive positioning. Traders get RSI value, state, and signal strength where decisions are made, improving clarity across timeframes.
DRAW_ARROW drawing type in multi-symbol multi-period indicators
In this article, we will look at drawing arrow multi-symbol multi-period indicators. We will also improve the class methods for correct display of arrows showing data from arrow indicators calculated on a symbol/period that does not correspond to the symbol/period of the current chart.

Price Action Analysis Toolkit Development (Part 50): Developing the RVGI, CCI and SMA Confluence Engine in MQL5
Many traders struggle to identify genuine reversals. This article presents an EA that combines RVGI, CCI (±100), and an SMA trend filter to produce a single clear reversal signal. The EA includes an on-chart panel, configurable alerts, and the full source file for immediate download and testing.

Experiments with neural networks (Part 7): Passing indicators
Examples of passing indicators to a perceptron. The article describes general concepts and showcases the simplest ready-made Expert Advisor followed by the results of its optimization and forward test.
Timeseries in DoEasy library (part 51): Composite multi-period multi-symbol standard indicators
In the article, complete development of objects of multi-period multi-symbol standard indicators. Using Ichimoku Kinko Hyo standard indicator example, analyze creation of compound custom indicators which have auxiliary drawn buffers for displaying data on the chart.

Engineering Trading Discipline into Code (Part 3): Enforcing Symbol-Level Trading Boundaries with a Whitelist System in MQL5
This article details an MQL5 framework that restricts trading to an approved set of symbols. The solution combines a shared library, a configuration dashboard, and an enforcement Expert Advisor that validates each trade against a whitelist and logs blocked attempts. It includes fully functional code examples, a clear explanation of the structural design decisions, and validation tests that confirm reliable symbol filtering, controlled market exposure, and transparent monitoring of rule enforcement.

Automating Black-Scholes Greeks: Advanced Scalping and Microstructure Trading
Gamma and Delta were originally developed as risk-management tools for hedging options exposure, but over time they evolved into powerful instruments for advanced scalping, order-flow modeling, and microstructure trading. Today, they serve as real-time indicators of price sensitivity and liquidity behavior, enabling traders to anticipate short-term volatility with remarkable precision.
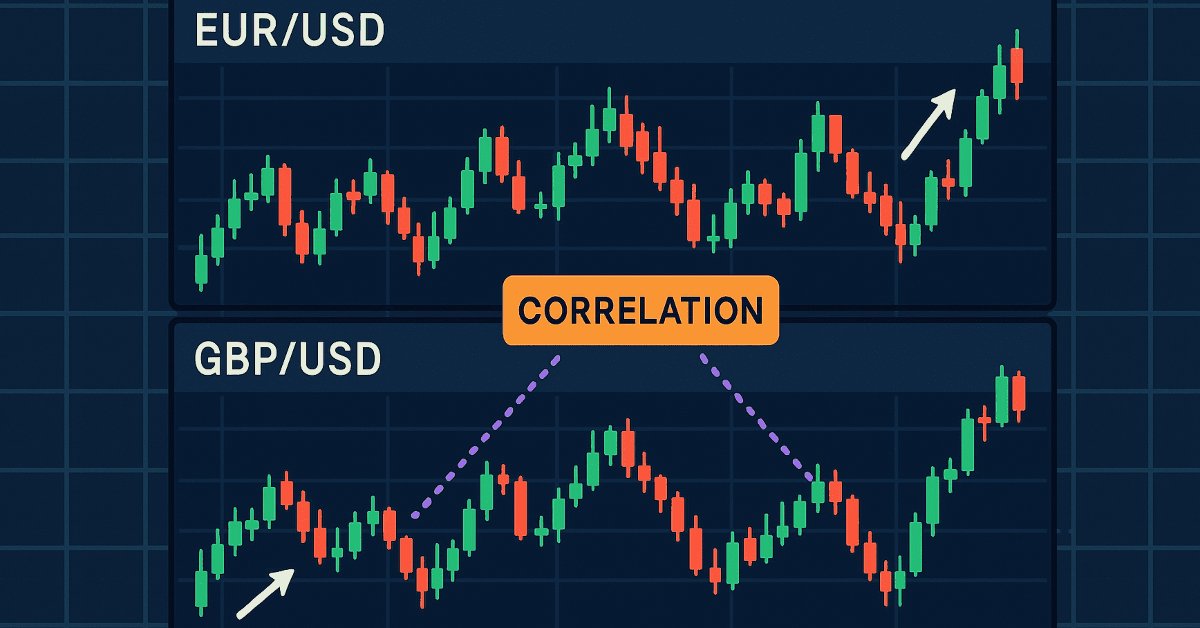
Price Action Analysis Toolkit Development (Part 20): External Flow (IV) — Correlation Pathfinder
Correlation Pathfinder offers a fresh approach to understanding currency pair dynamics as part of the Price Action Analysis Toolkit Development Series. This tool automates data collection and analysis, providing insight into how pairs like EUR/USD and GBP/USD interact. Enhance your trading strategy with practical, real-time information that helps you manage risk and spot opportunities more effectively.

Mastering File Operations in MQL5: From Basic I/O to Building a Custom CSV Reader
This article focuses on essential MQL5 file-handling techniques, spanning trade logs, CSV processing, and external data integration. It offers both conceptual understanding and hands-on coding guidance. Readers will learn to build a custom CSV importer class step-by-step, gaining practical skills for real-world applications.

Mastering Quick Trades: Overcoming Execution Paralysis
The UT BOT ATR Trailing Indicator is a personal and customizable indicator that is very effective for traders who like to make quick decisions and make money from differences in price referred to as short-term trading (scalpers) and also proves to be vital and very effective for long-term traders (positional traders).

From Novice to Expert: Collaborative Debugging in MQL5
Problem-solving can establish a concise routine for mastering complex skills, such as programming in MQL5. This approach allows you to concentrate on solving problems while simultaneously developing your skills. The more problems you tackle, the more advanced expertise is transferred to your brain. Personally, I believe that debugging is the most effective way to master programming. Today, we will walk through the code-cleaning process and discuss the best techniques for transforming a messy program into a clean, functional one. Read through this article and uncover valuable insights.

Creating 3D bars based on time, price and volume
The article dwells on multivariate 3D price charts and their creation. We will also consider how 3D bars predict price reversals, and how Python and MetaTrader 5 allow us to plot these volume bars in real time.

Benefiting from Forex market seasonality
We are all familiar with the concept of seasonality, for example, we are all accustomed to rising prices for fresh vegetables in winter or rising fuel prices during severe frosts, but few people know that similar patterns exist in the Forex market.

Creating Custom Indicators in MQL5 (Part 4): Smart WaveTrend Crossover with Dual Oscillators
In this article, we develop a custom indicator in MQL5 called Smart WaveTrend Crossover, utilizing dual WaveTrend oscillators—one for generating crossover signals and another for trend filtering—with customizable parameters for channel, average, and moving average lengths. The indicator plots colored candles based on the trend direction, displays buy and sell arrow signals on crossovers, and includes options to enable trend confirmation and adjust visual elements like colors and offsets.

Graphical Interfaces X: Updates for the Rendered table and code optimization (build 10)
We continue to complement the Rendered table (CCanvasTable) with new features. The table will now have: highlighting of the rows when hovered; ability to add an array of icons for each cell and a method for switching them; ability to set or modify the cell text during the runtime, and more.

Price Action Analysis Toolkit Development (Part 73): Building a Weekend Gap Trading Signal System in MQL5
We extend the weekend gap toolkit with an indicator that turns gap structure into tradeable signals. When price confirms back into the gap, the indicator issues buy/sell arrows, sets TP at the opposite edge, and places SL using current-week extremes. It maintains non-repainting behavior, reconstructs historical signals, updates live, and provides EA-ready buffers for entry markers and TP/SL to support automation.

Timeseries in DoEasy library (part 50): Multi-period multi-symbol standard indicators with a shift
In the article, let’s improve library methods for correct display of multi-symbol multi-period standard indicators, which lines are displayed on the current symbol chart with a shift set in the settings. As well, let’s put things in order in methods of work with standard indicators and remove the redundant code to the library area in the final indicator program.

Building a Keltner Channel Indicator with Custom Canvas Graphics in MQL5
In this article, we build a Keltner Channel indicator with custom canvas graphics in MQL5. We detail the integration of moving averages, ATR calculations, and enhanced chart visualization. We also cover backtesting to evaluate the indicator’s performance for practical trading insights.