
Simple solutions for handling indicators conveniently

Indicators have long become an integral part of any trading platform. Almost all traders use them. A trading system usually features an entire system of indicators rather than a single one, so the convenience of setting up an indicator is an important aspect in trading.
In this article, I will describe how to make a simple panel to change the indicator settings directly from the chart, and what changes need to be made to the indicator to connect the panel. This article is intended for novice MQL5 users, so I will explain every line of code. Professionals will not find anything new here.
Panel implementation
This web site features plenty of various panels in the articles and CodeBase, so why not take a ready-made code? There is a lot of good code out there, including some great libraries that allow us to create a panel of any complexity.
However, I am not happy with the fact that universality comes at a cost of the ease of use. Therefore, I will develop a panel specifically for indicators, essentially a regular table in which the width and height of the cells will automatically adjust to the width and height of the text depending on the font size.
At the top of the panel there will be a row for dragging the entire panel. This row will contain the name of the indicator, as well as icons for pinning and collapsing the panel. Each table cell will be described by a single line of code. This way we can make columns on different rows of different widths if necessary.
| Panel (indicator) name "Pin" "Collapse" |
|---|
| Setting name 1 | Input box |
| Setting name 2 | Input box |
The code describing the cell will contain: object name, object type, row number, cell text and cell width in % of the panel width. The panel width and the cell width will be interdependent. The sum of the percentages of all cells in one row should equal 100%.
Suppose that you need to specify three objects in a row, then the row number for all three objects will be the same, and the width, for example, 30% + 30% + 40% = 100%. In most cases, it is sufficient to split the row into two parts: 50% for the name of the settings parameter and 50% for the input field.
As I already said, the panel code was designed to be as simple as possible. So I planned to do without object-oriented programming (OOP). However, it was not possible to completely abandon it. Copying a lot of code from one indicator to another would be inconvenient. So I formatted the panel code as a class in an include file.
I used a class instead of regular individual functions mainly because it is convenient to delete panel objects in the destructor, otherwise I would have to delete them in the indicator's OnDeinit(), which would be more difficult to do there.
There will also be the Object.mqh include file with methods for drawing objects, and I also implemented getters and setters in it for greater convenience in accessing functions. I will not describe what getters and setters are. You can google them if you need.
The idea of the panel was partially borrowed from these articles: article 1 and article 2.
All code files described here are attached at the bottom of the article. I recommend downloading them, putting them into folders, and only then starting to study the code. I have created a separate Object folder in the 'include' folder for the Object.mqh file. For the Panel.mqh file, a separate Panel folder has been created in the 'include' folder. Accordingly, the path to these files in my code is specified with consideration to nested folders.
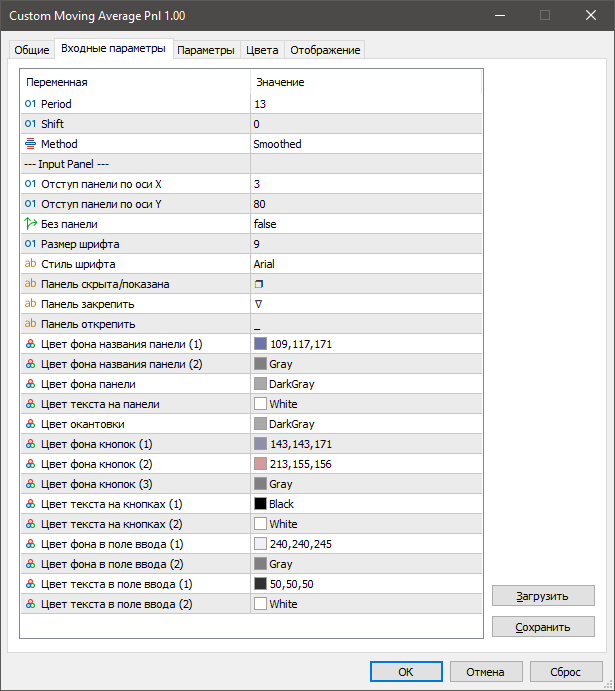
Let's start from including the Object.mqh file and declaring the 'input' of the variables. We need to declare variables, in which we will specify: the colors of the panel, text, buttons, frames, as well as additional colors, in which the panel will be painted when the indicator is hidden, font size, font style, as well as panel indents from the edges of the chart.
Input settings:
//+------------------------------------------------------------------+
#include <Object\\Object.mqh>
//+------------------------------------------------------------------+
input group "--- Input Panel ---"
input int    shiftX           = 3;               // Panel offset along the X axis
input int    shiftY           = 80;              // Panel offset along the Y axis
input bool   NoPanel          = false;           // No panel
input int    fontSize         = 9;               // Font size
input string fontType          = "Arial";        /* Font style*/ //"Arial", "Consolas"
input string PanelHiddenShown = "❐";             // Panel hidden/displayed
input string PanelPin         = "∇";             /* Pin the panel*/ // ⮂ ↕  ↔  ➽ 🖈 ∇
input string PanelUnpin       = "_";             // Unpin the panel
input color  clrTitleBar      = C'109,117,171';  // Panel title background color (1)
input color  clrTitleBar2     = clrGray;         // Panel title background color (2)
input color  clrDashboard     = clrDarkGray;     // Panel background color
input color  clrTextDashboard = clrWhite;        // Text color on the panel
input color  clrBorder        = clrDarkGray;     // Border color
input color  clrButton1       = C'143,143,171';  // Button background color (1)
input color  clrButton2       = C'213,155,156';  // Button background color (2)
input color  clrButton3       = clrGray;         // Button background color (3)
input color  clrTextButton1   = clrBlack;        // Button text color (1)
input color  clrTextButton2   = clrWhite;        // Button text color (2)
input color  clrEdit1         = C'240,240,245';  // Input field background color (1)
input color  clrEdit2         = clrGray;         // Input field background color (2)
input color  clrTextEdit1     = C'50,50,50';     // Input field text color (1)
input color  clrTextEdit2     = clrWhite;        // Input field text color (2)
//+------------------------------------------------------------------+
Next comes the CPanel class itself:
//+------------------------------------------------------------------+
class CPanel
  {
private:

   enum ENUM_FLAG   //flags
     {
      FLAG_PANEL_HIDDEN = 1,  // panel hidden
      FLAG_PANEL_SHOWN  = 2,  // panel displayed
      FLAG_IND_HIDDEN   = 4,  // indicator hidden
      FLAG_IND_SHOWN    = 8,  // indicator displayed
      FLAG_PANEL_FIX    = 16, // panel pinned
      FLAG_PANEL_UNPIN  = 32  // panel unpinned
     };

   int               sizeObject;
   int               widthPanel, heightPanel;
   int               widthLetter, row_height;
   int               _shiftX, _shiftY;
   long              mouseX, mouseY;
   long              chartWidth, chartHeight;
   string            previousMouseState;
   long              mlbDownX, mlbDownY, XDistance, YDistance;
   string            _PanelHiddenShown, _PanelPin, _PanelUnpin;

   struct Object
     {
      string         name;
      string         text;
      ENUM_OBJECT    object;
      int            line;
      int            percent;
      int            column;
      int            border;
      color          txtColr;
      color          backClr;
      color          borderClr;
     };
   Object            mObject[];

   int               prefixInd;
   string            Chart_ID;
   string            addedNames[];
   long              addedXDisDiffrence[], addedYDisDiffrence[];
   int               WidthHidthCalc(int line, string text = "", int percent = 50,  ENUM_OBJECT object = OBJ_RECTANGLE_LABEL);
   void              Add(string name); // save the object name and anchor point
   void              HideShow(bool hide = false);       // hide//show
   void              DestroyPanel();   // delete all objects

public:
                     CPanel(void);
                    ~CPanel(void);

   string            namePanel;    // panel name
   string            indName;      // indicator name should match indicator short name
   string            prefix;       // prefix for panel object names
   bool              hideObject;   // To be used as a flag in indicators where graphical objects need to be hidden
   int               sizeArr;
   double            saveBuffer[]; // array for storing the coordinates of the panel anchor point, panel properties (flag states), and the latest indicator settings

   enum ENUM_BUTON  // flags for allowing button creation
     {
      BUTON_1 = 1,
      BUTON_2 = 2
     };

   void              Init(string name, string indName);
   void              Resize(int size) {sizeArr = ArrayResize(saveBuffer, size + 3); ZeroMemory(saveBuffer);};
   void              Record(string name, ENUM_OBJECT object = OBJ_RECTANGLE_LABEL, int line = -1, string text = "", int percent = 50, color txtColr = 0, color backClr = 0, color borderClr = 0);
   bool              OnEvent(int id, long lparam, double dparam, string sparam);
   int               Save() {ResetLastError(); FileSave("pnl\\" + Chart_ID + indName, saveBuffer); return GetLastError();}
   bool              Load(string name) {return (FileLoad("pnl\\" + (string)ChartID() + name, saveBuffer) > 0);}

   void              Create(uint Button = BUTON_1 | BUTON_2, int shiftx = -1, int shifty = -1);
   void              ApplySaved();
   void              HideShowInd(bool hide);
  };
//+------------------------------------------------------------------+
CPanel::CPanel(void) {}
//+------------------------------------------------------------------+
CPanel::~CPanel(void) {DestroyPanel(); ChartRedraw();}
//+------------------------------------------------------------------+
We will discuss class methods below using examples.
Let's write an empty indicator as an example:
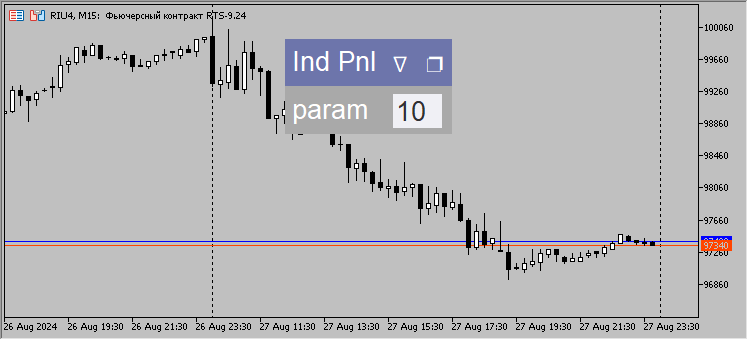
#property indicator_chart_window
#property indicator_plots 0
input int _param = 10;
#include <Panel\\Panel.mqh>
CPanel mPanel;
int param = _param;
//+------------------------------------------------------------------+
int OnInit()
  {
   string short_name = "Ind Pnl(" + (string)param + ")";
   mPanel.Init("Ind Pnl", short_name);
   mPanel.Record("paramText", OBJ_LABEL, 1, "param", 60);
   mPanel.Record("param", OBJ_EDIT, 1, IntegerToString(param), 40);
   mPanel.Create(0);
   return(INIT_SUCCEEDED);
  }
//+------------------------------------------------------------------+
int OnCalculate(const int rates_total,
                const int prev_calculated,
                const int begin,
                const double &price[])
  {
   return(rates_total);
  }
//+------------------------------------------------------------------+
void OnChartEvent(const int id,
                  const long &lparam,
                  const double &dparam,
                  const string &sparam)
  {
   mPanel.OnEvent(id, lparam, dparam, sparam);
  }
//+------------------------------------------------------------------+
When launching the indicator, you will see the panel like this on the chart:
Now, let's examine the panel code in detail using this indicator as an example.
Right after the indicator input parameters, include the file with the panel class and declare the panel class.
#property indicator_chart_window
#property indicator_plots 0
input int _param = 10;
#include <Panel\\Panel.mqh>
CPanel mPanel;
int param = _param;
Typically, a class is declared at the very beginning of the code. But since the panel class is in an included file that also has inputs, if we write it at the very beginning of the input code, the indicator parameters will be below the panel's inputs. This will create some inconvenience when launching and configuring the indicator.
Since input variables are constant, they cannot be changed. But it is possible to create a copy of input variables and edit them from the panel input field.
Next, add the panel code in the indicator OnInit() function.
But first, I would like to draw your attention to the fact that for the panel to work correctly, the indicator should have a short indicator name specified in the code, which should include the main input parameters.
string short_name = "Ind Pnl(" + (string)_param + ")";
This is necessary in order to run the indicator with different settings.
Let me remind you that some symbols cannot be used in indicator names. If you want to separate parameters with a colon, it is better to replace it with a semicolon.
The panel name can be the same as the indicator name, but it is more convenient to make the panel name without taking into account the indicator parameters.
The first method of the CPanel class that we will add to the indicator is the Init() method, into which we pass two names: the panel name and the indicator name.
mPanel.Init("Ind Pnl", short_name); The first thing the Init() method does is make sure the panel is not disabled in the settings.
void CPanel::Init(string name, string short_name)
  {
   if(NoPanel)
      return;
Next, initialize the variables:
   namePanel = name;
   indName = short_name;
   MovePanel = true;
   sizeObject = 0;
   Chart_ID = (string)ChartID();
   int lastX = 0, lastY = 0;
Let's set permission to send messages about mouse movement and button pressing events (CHARTEVENT_MOUSE_MOVE) to all MQL5 programs on the chart, and also allow sending messages about the event of creating a graphical object (CHARTEVENT_OBJECT_CREATE):
   ChartSetInteger(0, CHART_EVENT_MOUSE_MOVE, true);
   ChartSetInteger(0, CHART_EVENT_OBJECT_CREATE, true);
To calculate the panel width, we first need to set the font type and size, as well as get the size of a single symbol, so that in the future this size can be used to calculate the text indents from the panel borders.
This way we will get scalable indents that will be tied to the font size. The cell height will be equal to the height of one and a half characters.
// set the font type and size
   TextSetFont(fontType, fontSize * -10);
// get the width and height of one character
   TextGetSize("0", widthLetter, row_height);
// calculate the cell height
   row_height += (int)(row_height / 2);
The panel settings feature the icons used to show/hide the panel ❐, as well as to pin/unpin it ∇ and _.
I found the icons on the Internet and they can be changed in the settings.
Let's add spaces to symbols for correct positioning from the edge of the panel. If we do not add spaces, the icons are displayed too close to each other and it becomes difficult to hit them with the mouse.
   string space = " ";
   _PanelHiddenShown = space + PanelHiddenShown + space;
   _PanelPin         = space + PanelPin + space;
   _PanelUnpin       = space + PanelUnpin + space;
The panel consists of graphical objects. Let's create a prefix for them, so that the names of these objects are unique:
   MathSrand((int)GetMicrosecondCount());
   prefixInd = MathRand();
   prefix = (string)prefixInd;
Note that if the chart contains several indicators with a panel, then we cannot use the GetTickCount() function when creating a prefix, because switching timeframes takes so little time that if you use milliseconds instead of microseconds, the prefixes of some panels may coincide.
When dragging the panel, the OnChartEvent() function determines the position of the mouse on the chart and on the object. The panel may run into another panel leading to a conflict. In order to avoid it, we will create a global variable and, when the mouse is pressed on the panel, the first panel that writes its prefix to this global variable will move the mouse. First come, first serve.
During initialization, we write zero into this variable. While zero is written into the variable, it is considered free.
   GlobalVariableTemp("CPanel");
   GlobalVariableSet("CPanel", 0);
When we move, collapse, pin a panel or change the indicator parameters, we need to save these changes somewhere. This will allow us to load the panel and indicator with the latest settings when switching the timeframe or restarting the terminal. I have not included the code for saving the last settings of the panel and the indicator to the indicator, but even without this code the indicator will record changes to the panel settings. To do this, we need to allocate memory for an array with panel settings.
   sizeArr = ArraySize(saveBuffer);
   if(sizeArr == 0)
      Resize(0);
Although we pass the number of indicator settings = 0, Resize(0); to the function. In the function itself, three cells are added to save the panel settings. In other words, we use three cells of the saveBuffer array in order to remember the position of the panel on the chart, its state (pinned/unpinned, collapsed/expanded) and also the state of the indicator (displayed/hidden).
Next is the code that defines the initial coordinates of the panel anchor point. The point is that the panel anchor point can be taken from the input settings or from the saved ones, if the panel has already been drawn on this chart. Another option is using a template, in which the indicator with the panel was set.
Handling the template turned out to be more difficult. If we save a template that has an indicator with the panel, then we cannot save the coordinates of the panel at the time the template was created.
But if we add an indicator to the chart, save the template, and then apply it, we will see that the OBJ_LABEL text label object is written to the template.
Saving the template:
Applying the template:
It is these text labels that we use to determine the position of the panel at the time the template is created.
   string delPrefix = "";
   int j = 0, total = ObjectsTotal(0, 0, OBJ_LABEL);
   for(int i = 0; i < total; i++)
     {
      string nameObject = ObjectName(0, i, 0, OBJ_LABEL);
      if(StringFind(nameObject, "TitleText " + indName) >= 0) // if the template contains objects with the name of this indicator
        {
         lastX = (int)GetXDistance(nameObject);// define the X coordinates of the panel in the template
         lastY = (int)GetYDistance(nameObject);// define the Y coordinates of the panel in the template
         StringReplace(nameObject, "TitleText " + indName, ""); // remember the object prefix for its subsequent deletion
         delPrefix = nameObject;
        }
     }
The lastX and lastY variables set the coordinates of the object anchor point — a text label with a name featuring the indicator name (panel name text coordinates) after the prefix.
Let me remind you that the panel name may differ from the indicator name. After the necessary text has been found, retrieve the prefix and save it.
The following code uses the previously saved prefix to remove the obsolete text labels, that were saved in the template, from the chart.
   if(delPrefix != "")// delete obsolete objects saved in the template
      ObjectsDeleteAll(0, delPrefix);
Next comes the checking and selection of the required option for the panel anchor point.
   if(lastX != 0 || lastY != 0)// if we use a template
     {
      lastX = lastX - widthLetter / 2;
      lastY = lastY - (int)(row_height / 8);
      saveBuffer[sizeArr - 1] = _shiftX = lastX;
      saveBuffer[sizeArr - 2] = _shiftY = lastY;
     }
   else// if data from the file is used
      if(saveBuffer[sizeArr - 1] != 0 || saveBuffer[sizeArr - 2] != 0)
        {
         _shiftX = (int)saveBuffer[sizeArr - 1];
         _shiftY = (int)saveBuffer[sizeArr - 2];
        }
      else// if this is the first launch of the indicator
        {
         saveBuffer[sizeArr - 1] = _shiftX = shiftX;
         saveBuffer[sizeArr - 2] = _shiftY = shiftY;
        }
At the very end of the Init() method, we will send the panel objects that do not need to be edited to the array of structures. They will remain the same for all panels.
Two rectangles, text with the panel name and icons for displaying/hiding and pinning/unpinning the panel.
   Record("TitleBar");
   Record("MainDashboardBody");
   Record("TitleText " + indName, OBJ_LABEL, 0, namePanel, 100);
   Record("PinUnpin", OBJ_LABEL, 0, _PanelPin, 0);
   Record("CollapseExpand", OBJ_LABEL, 0, _PanelHiddenShown, 0);
Now let's move on to the next method Record().
The structure of the future object is filled in the Record() method. Usually, most of the structure is filled with default values. However, the set of parameters passed to this function allows us to slightly change the default values and, for example, set a different color for the object.
//+------------------------------------------------------------------+
void CPanel::Record(string name, ENUM_OBJECT object = OBJ_RECTANGLE_LABEL, int line = -1, string text = "", int percent = 50, color txtColr = 0, color backClr = 0, color borderClr = 0)
  {
   if(NoPanel)
      return;
   int column = WidthHidthCalc(line + 1, text, percent, object);

   ArrayResize(mObject, sizeObject + 1);
   mObject[sizeObject].column = column;       // column
   mObject[sizeObject].name = prefix + name;  // object name
   mObject[sizeObject].object = object;       // object type
   mObject[sizeObject].line = line + 1;       // line index
   mObject[sizeObject].text = text;           // text (if any)
   mObject[sizeObject].percent = percent;     // percentage of panel width
   mObject[sizeObject].txtColr = txtColr;     // text color
   mObject[sizeObject].backClr = backClr;     // base color
   mObject[sizeObject].borderClr = borderClr; // border color
   mObject[sizeObject].border = 0;            // offset from the panel edge
   sizeObject++;
  }
//+------------------------------------------------------------------+
At the beginning of the Record() method, we call the WidthHidthCalc(), method, in which the panel width and height are calculated.
Let's take a closer look at the WidthHidthCalc() method.
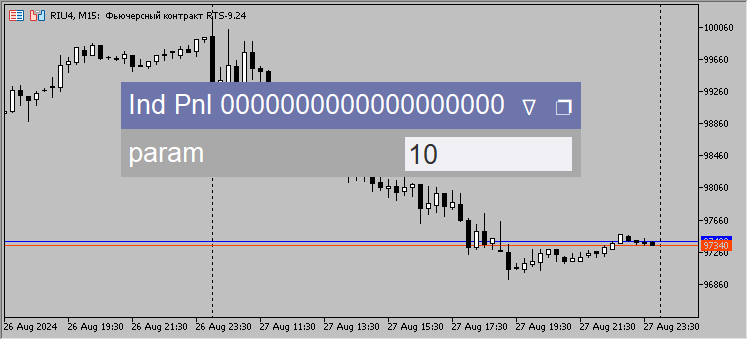
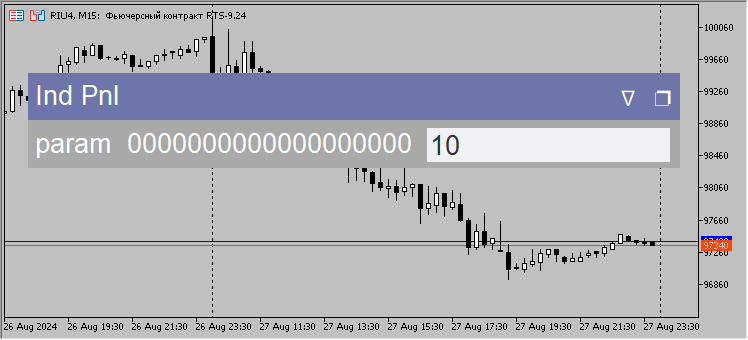
This method calculates the width of the panel taking into account the widest element, for example, if we assign a longer name to the Ind Pnl indicator described above.
Previous:
mPanel.Init("Ind Pnl", short_name); Current:
mPanel.Init("Ind Pnl 0000000000000000000", short_name); Result:
Or if, for example, we change the name of the indicator setting, we get the following.
Previous:
mPanel.Record("paramText", OBJ_LABEL, 1, "param", 60);
Current:
mPanel.Record("paramText 0000000000000000000", OBJ_LABEL, 1, "param", 60);
Result:
The panel automatically adjusts to the text size. All calculations of the width and height of the panel are performed in the WidthHidthCalc() function.
First, we get the cell text width.
Here we apply a slightly different method of finding the text width with the panel name and display/hide icons compared to other cells.
int CPanel::WidthHidthCalc(int line, string text = "", int percent = 50,  ENUM_OBJECT object = OBJ_RECTANGLE_LABEL)
  {
   static int lastLine = -1, column = 0;
   int width, height;
   if(line == 1)
      TextGetSize(text + _PanelPin + _PanelHiddenShown, width, height); // get the width and height of the text for the line with the panel name
   else
      TextGetSize(text, width, height); // get the text width and height
The text should be indented from the cell border, and we will make this indent equal to half a character. We have already found the width of one character in the Init() function and set it to the widthLetter variable.
To provide text indentation on both sides, we need to add the width of yet another symbol to the resulting text width, while in case of the Button object text - OBJ_BUTTON, we need to add yet another character to ensure an indent from the edges of the button.
Now that we know the size of the entire row in the cell including the indents, we can calculate the panel size considering the percentages indicated under the cell.
Save the largest value of the panel. In the future, all cells will be calculated based on this largest panel width value.
   double indent = 0;
   if(object == OBJ_BUTTON)
      indent += widthLetter;

   if(text != "" && percent != 0)
     {
      // calculate the width of the panel based on the text size and the percentage allocated for this text
      int tempWidth = (int)MathCeil((width + widthLetter + indent) * 100 / percent);
      if(widthPanel < tempWidth)
         widthPanel = tempWidth;
     }
The calculation of the panel width in the test indicator will look like this.
First, the width of the title is calculated taking into account the icons. In case of "Ind Pnl" + " ∇ " + " ❐ ", we have the width of 71 рх plus the width of one symbol of 7 рх, a total of 78 рх — this is 100% of the panel width.
The cell text is "param", the width of 36 px taking into account the added indents of 7 px turns out to be 43 px, 60% of the panel width is allocated to this cell, which means the panel width will be equal to 43 * 100 / 60 = 72 px. This is less than needed for the panel title, which means the panel width will be equal to the cell with the title.
Next, we define the column index and/or add the panel height, if this is a new row.
   if(lastLine != line)// if this is a new row in the panel, then increase the height of the entire panel
     {
      heightPanel = row_height * line;
      lastLine = line;
      column = 0; // reset the number of columns in the new row
     }
   else
      column++; // add a new column

   return column;
  }
So, we have examined in detail the work of two of the ten methods of the CPanel class.
After the program has determined the future dimensions of the panel and set the parameters of the objects into the array of structures mObject[], we move on to the next method - Create(). This method builds a panel based on the dimensions obtained earlier.
As usual, at the beginning of the method, we check if the panel is needed. This is followed by the code to write two predefined buttons. One button hides the indicator, while another removes it. Depending on the flags selected, you can choose the following: 0 - no buttons, 1 - one button to hide/show the indicator, 2 - one button to remove the indicator, 3 - both buttons are created.
Why are these buttons here and not in the indicator code? This allows us to insert less code into the indicator code.
Next comes the initialization of variables. This code is needed if we want to use the panel not exactly as intended, but for example, as a pop-up panel for changing the object parameters. So we need the panel to appear at the place where you click the mouse on the chart.
void CPanel::Create(uint Button = BUTON_1 | BUTON_2, int shiftx = -1, int shifty = -1)
  {
   if(NoPanel)
      return;

   if((Button & BUTON_1) == BUTON_1)// if we need to create buttons
      Record("hideButton", OBJ_BUTTON, mObject[sizeObject - 1].line, "Ind Hide", 50);
   if((Button & BUTON_2) == BUTON_2)// if we need to create buttons
      Record("delButton", OBJ_BUTTON, mObject[sizeObject - 2].line, "Ind Del", 50, clrTextButton1, clrButton2);

   ENUM_ANCHOR_POINT ap = ANCHOR_LEFT_UPPER;
   int X = 0, Y = 0, xSize = 0, ySize = 0;

   if(shiftx != -1 && shifty != -1)
     {
      _shiftX = shiftx;
      _shiftY = shifty;
     }
The panel can be adapted for both an information panel and a trading panel, as well as for a panel like this one for setting up chart objects. Everything is simple, the focus is made on pure functionality:
But I digress. Let's continue to analyze the Create() method. Next is the code that creates two rectangles - a header rectangle and a panel body rectangle:
// header rectangle
   RectLabelCreate(0, mObject[0].name, 0, _shiftX, _shiftY, widthPanel, row_height, (mObject[0].backClr == 0 ? clrTitleBar : mObject[0].backClr),
                   BORDER_FLAT, CORNER_LEFT_UPPER, (mObject[0].borderClr == 0 ? clrBorder2 : mObject[0].borderClr), STYLE_SOLID, 1, false, false, true, 1, indName);
   Add(mObject[0].name);// remember the object's anchor point

// panel rectangle
   RectLabelCreate(0, mObject[1].name, 0, _shiftX, row_height - 1 + _shiftY, widthPanel, heightPanel - row_height, (mObject[1].backClr == 0 ? clrDashboard : mObject[1].backClr),
                   BORDER_FLAT, CORNER_LEFT_UPPER, (mObject[1].borderClr == 0 ? clrBorder1 : mObject[1].borderClr), STYLE_SOLID, 1, false, false, true, 0, indName);
   Add(mObject[1].name);
After each object is created, the Add() function is called, which writes the name and coordinates of the object, relative to the upper left corner of the chart, into arrays.
//+------------------------------------------------------------------+
void CPanel::Add(string name)// save the object name and anchor point
  {
   int size = ArraySize(addedNames);
   ArrayResize(addedNames, size  + 1);
   ArrayResize(addedXDisDiffrence, size + 1);
   ArrayResize(addedYDisDiffrence, size + 1);

   addedNames[size] =  name;
   addedXDisDiffrence[size] = GetXDistance(addedNames[0]) - GetXDistance(name);
   addedYDisDiffrence[size] = GetYDistance(addedNames[0]) - GetYDistance(name);
  }
//+------------------------------------------------------------------+
These arrays with coordinates will be used later when moving the panel.
Let's return to the code of the Create() method. Then all objects are created in a loop in the same order in which they were written to the mObject[] array of structures. Calculation of coordinates and sizes is followed by creating an object.
Since the panel is highly specialized, it uses only three types of objects, and this is quite sufficient for its functionality.
When filling the header rectangle with a text, I had to turn to exceptions and implement an anchor point for the panel pinning and collapsing icons, so that they are different from the anchor point of all other panel objects. This made it easier to position these icons on the panel as they have an anchor point in the top right corner.
 for(int i = 2; i < sizeObject; i++)
     {
      // calculate the coordinates of the object anchor point
      if(mObject[i].column != 0)
        {
         X = mObject[i - 1].border + widthLetter / 2;
         mObject[i].border = mObject[i - 1].border + (int)MathCeil(widthPanel * mObject[i].percent / 100);
        }
      else
        {
         X = _shiftX + widthLetter / 2;
         mObject[i].border = _shiftX + (int)MathCeil(widthPanel * mObject[i].percent / 100);
        }

      Y = row_height * (mObject[i].line - 1) + _shiftY + (int)(row_height / 8);
      //---
      switch(mObject[i].object)
        {
         case  OBJ_LABEL:
            ap = ANCHOR_LEFT_UPPER;
            // unlike all other objects, the "pin" and "collapse" objects' anchor points are implemented in the upper right corner.
            if(i == 3)
              {
               int w, h;
               TextGetSize(_PanelHiddenShown, w, h);
               X = _shiftX + widthPanel - w;
               ap = ANCHOR_RIGHT_UPPER;
              }
            if(i == 4)
              {
               X = _shiftX + widthPanel;
               ap = ANCHOR_RIGHT_UPPER;
              }

            LabelCreate(0, mObject[i].name, 0, X, Y, CORNER_LEFT_UPPER, mObject[i].text, fontType, fontSize,
                        (mObject[i].txtColr == 0 ? clrTextDashboard : mObject[i].txtColr), 0, ap, false, false, true, 1);
            break;

         case  OBJ_EDIT:
            xSize = (int)(widthPanel * mObject[i].percent / 100) - widthLetter;
            ySize = row_height - (int)(row_height / 4);

            EditCreate(0, mObject[i].name, 0, X, Y, xSize, ySize, mObject[i].text, fontType, fontSize, ALIGN_LEFT, false, CORNER_LEFT_UPPER,
                       (mObject[i].txtColr == 0 ? clrTextEdit1 : mObject[i].txtColr),
                       (mObject[i].backClr == 0 ? clrEdit1 : mObject[i].backClr),
                       (mObject[i].borderClr == 0 ? clrBorder1 : mObject[i].borderClr), false, false, true, 1);
            break;

         case  OBJ_BUTTON:
            xSize = (int)(widthPanel * mObject[i].percent / 100) - widthLetter;
            ySize = row_height - (int)(row_height / 4);

            ButtonCreate(0, mObject[i].name, 0, X, Y, xSize, ySize, CORNER_LEFT_UPPER, mObject[i].text, fontType, fontSize,
                         (mObject[i].txtColr == 0 ? clrTextButton1 : mObject[i].txtColr),
                         (mObject[i].backClr == 0 ? clrButton1 : mObject[i].backClr),
                         (mObject[i].borderClr == 0 ? clrBorder1 : mObject[i].borderClr), false, false, false, true, 1);
            break;
        }
      Add(mObject[i].name);
     }
After all the panel objects are built, we remove the mObject[] structure array since it is no longer needed.
   ArrayFree(mObject);

   ApplySaved();

   ChartRedraw();
I usually create a separate function if the code is used multiple times. However, if the essence of the operation is grouped by meaning, I single it out as a separate method. This is what I did to the ApplySaved() function. It checks if there is already saved panel data and applies it if there is, or saves new data if there is not.
ApplySaved()
If this is the first run of the indicator on this chart, the saveBuffer[] array is filled with the initial settings.
If the saveBuffer[] array already features saved data, we apply it instead of the initial settings.
//+------------------------------------------------------------------+
void CPanel::ApplySaved()
  {
// collapse the panel immediately after the indicator is launched, if this is saved in the file
   if(((uint)saveBuffer[sizeArr - 3] & FLAG_PANEL_HIDDEN) == FLAG_PANEL_HIDDEN)
      CPanel::OnEvent(CHARTEVENT_OBJECT_CLICK, 0, 0, addedNames[4]);
   else
      saveBuffer[sizeArr - 3] = (uint)saveBuffer[sizeArr - 3] | FLAG_PANEL_SHOWN;

// hide the indicator immediately after the indicator is launched, if this is saved in the file
   if(((uint)saveBuffer[sizeArr - 3] & FLAG_IND_HIDDEN) == FLAG_IND_HIDDEN)
     {
      HideShowInd(true);
      SetButtonState(prefix + "hideButton", true);
      hideObject = true;
     }
   else
     {
      saveBuffer[sizeArr - 3] = (uint)saveBuffer[sizeArr - 3] | FLAG_IND_SHOWN;
      hideObject = false;
     }

// pin the panel immediately after the indicator is launched, if this is saved in the file
   if(((uint)saveBuffer[sizeArr - 3] & FLAG_PANEL_FIX) == FLAG_PANEL_FIX)
      SetText(addedNames[3], _PanelUnpin);
   else
      saveBuffer[sizeArr - 3] = (uint)saveBuffer[sizeArr - 3] | FLAG_PANEL_UNPIN;

   int Err = Save();
   if(Err != 0)
      Print("!!! Save Error = ", Err, "; Chart_ID + indName =", Chart_ID + indName);
  }
//+------------------------------------------------------------------+
As you may have noticed, the ApplySaved() function also uses Save(), HideShowInd() and OnEvent() functions. If you are reading this, please write "noticed" in the comments. It is very interesting to know whether someone reads these descriptions or not.
Let's move on to describing these functions. Save the obtained settings in Save(). Allocate a separate pnl folder for saved panel settings in order not to clutter the Files folder
This is what the Save() function looks like:
int Save()
  {
   ResetLastError();
   FileSave("pnl\\" + Chart_ID + indName, saveBuffer);
   return GetLastError();
  }
HideShowInd()
The purpose of this function is simply to change the panel header color and the button color and text. Remove the previous flag from the saveBuffer array and set a new one.
The hideObject variable will be needed only in the indicators where objects (arrows, icons, text, etc.) are used for drawing. When creating a new object in the indicator, we will check the state of this variable and, depending on the state, either immediately hide the newly created objects or do nothing, and the objects will be displayed.
//+------------------------------------------------------------------+
void CPanel::HideShowInd(bool hide)
  {
// change the color and text of the buttons depending on the state of the panel, hidden/displayed, as well as the header color
   if(hide)
     {
      SetColorBack(prefix + "TitleBar", clrTitleBar2);
      SetColorBack(prefix + "hideButton", clrButton3);
      SetText(prefix + "hideButton", "Ind Show");
      saveBuffer[sizeArr - 3] = ((uint)saveBuffer[sizeArr - 3] & ~FLAG_IND_SHOWN) | FLAG_IND_HIDDEN;
      hideObject = true;
     }
   else
     {
      SetColorBack(prefix + "TitleBar", clrTitleBar);
      SetColorBack(prefix + "hideButton", clrButton1);
      SetText(prefix + "hideButton", "Ind Hide");
      saveBuffer[sizeArr - 3] = ((uint)saveBuffer[sizeArr - 3] & ~FLAG_IND_HIDDEN) | FLAG_IND_SHOWN;
      hideObject = false;
     }
   Save();
   ChartRedraw();
  }
//+------------------------------------------------------------------+
The function is applied only when clicking on the Ind Show/Ind Hide button if used.
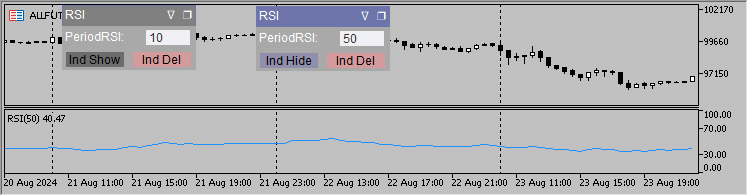
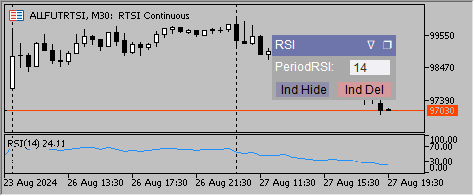
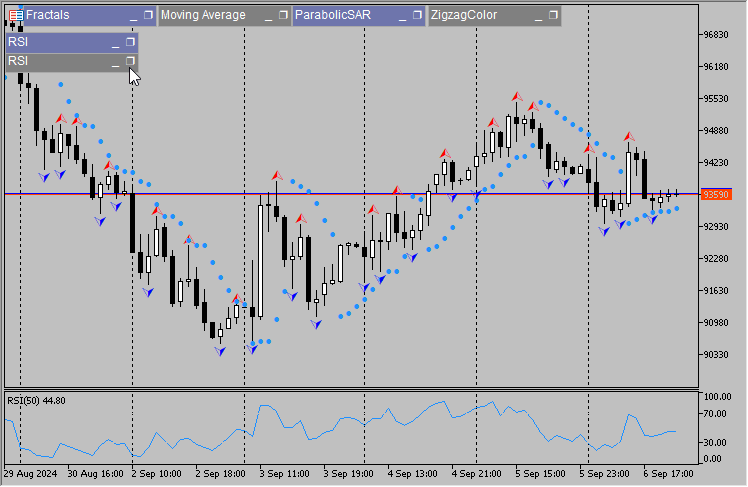
Example of hiding one of the two RSI indicators
The code also contains the HideShow() function responsible for hiding and showing objects. The function is used to collapse the panel and bring the panel objects to the foreground.
The function takes an argument that indicates whether the panel is collapsed or not (true/false). If the panel is collapsed, then we only need to bring to the foreground four of its objects: a rectangle with the title, the title itself, and two icons - pin and collapse.
If the flag is 'true' (the panel is collapsed), we sequentially hide and then display five objects. Why five and not four? Among the necessary objects, there is one extra one - the rectangle of the panel itself. We create it before the name and icons, so this rectangle needs to be hidden separately.
If the flag is 'false', then all panel objects are successively hidden and then displayed. Thus, they are brought to the foreground.
//+------------------------------------------------------------------+
void CPanel::HideShow(bool hide = false) // hide and immediately display objects to bring to the foreground
  {
   int size = hide ? 5 : ArraySize(addedNames);
   for(int i = 0; i < size; i++)
     {
      SetHide(addedNames[i]);
      SetShow(addedNames[i]);
     }
   if(hide)
      SetHide(addedNames[1]);
  }
//+------------------------------------------------------------------+
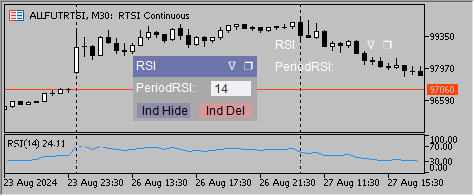
This is what the collapsed panel looks like next to the regular one:
The next function we will look at is OnEvent().
At the beginning of the function, we check whether the panel is allowed in the settings:
bool CPanel::OnEvent(int id, long lparam, double dparam, string sparam)
  {
   if(NoPanel)
      return false;
Next, let's look at the code responsible for moving the panel. I will try to explain how the code works in as much detail as possible.
When the "mouse movement" event occurs and the flag allowing the panel movement is set in memory, we save the mouse coordinates.
If it is a left click, then sparam is 1, and if the mouse button was not clicked before, read the global variable value.
This global variable is common to all panels running in the terminal. When moving a panel, we check if the prefix value of another panel is set to this variable, and if it is not set, then the prefix of the panel is set to this global variable. This means that other panels (if they are below/above the panel we are moving) can no longer be moved.
If the global variable contains zero or the prefix of this panel, then we read the current anchor point coordinates of the panel.
Then check if this was a mouse click on the rectangle with the panel header. If yes, we get the chart size in pixels, disable chart scrolling, while the global variable sets the panel prefix. The prefix entry is both a flag that allows the panel to be moved and a guarantee that only this panel will move.
Finally, hide/display the panel to bring it to the foreground while passing the (true/false) argument to the function determining whether the panel is currently hidden or is fully displayed.
   if(id == CHARTEVENT_MOUSE_MOVE && ((uint)saveBuffer[sizeArr - 3] & FLAG_PANEL_UNPIN) == FLAG_PANEL_UNPIN)
     {
      mouseX = (long)lparam;
      mouseY = (long)dparam;

      if(previousMouseState != "1" && sparam == "1")
        {
         int gvg = (int)GlobalVariableGet("Panel");
         if(gvg == prefixInd || gvg == 0)
           {
            XDistance = GetXDistance(addedNames[0]);
            YDistance = GetYDistance(addedNames[0]);

            mlbDownX = mouseX;
            mlbDownY = mouseY;

            if(mouseX >= XDistance && mouseX <= XDistance + widthPanel && mouseY >= YDistance && mouseY <= YDistance + row_height)
              {
               chartWidth = ChartGetInteger(0, CHART_WIDTH_IN_PIXELS);
               chartHeight = ChartGetInteger(0, CHART_HEIGHT_IN_PIXELS);
               ChartSetInteger(0, CHART_MOUSE_SCROLL, false);
               GlobalVariableSet("Panel", prefixInd);
               HideShow(((uint)saveBuffer[sizeArr - 3] & FLAG_PANEL_HIDDEN) == FLAG_PANEL_HIDDEN); // hide/display the panel so that it is in the foreground
              }
           }
        }
After the user clicks on the rectangle with the panel name and starts moving the mouse, the following code runs.
First, we check whether the panel is allowed to be moved. If the global variable has a prefix of the panel, then it can be moved. Then we find the coordinates of the panel anchor points. If we move the panel according to the mouse coordinates, we check the new position of the panel. If it can go beyond the chart, then we slightly change the values of the anchor point coordinates, so that the panel does not go beyond the chart.
In the loop, move all panel objects.
Set the new coordinates of the panel's anchor point to the array for subsequent writing to the file. After this, we redraw the chart.
      if((int)GlobalVariableGet("Panel") == prefixInd)
        {
         // disable the ability to go beyond the chart for the panel
         long posX = XDistance + mouseX - mlbDownX;
         if(posX < 0)
            posX = 0;
         else
            if(posX + widthPanel > chartWidth)
               posX = chartWidth - widthPanel;

         long posY = YDistance + mouseY - mlbDownY;
         if(posY < 0)
            posY = 0;
         else
            if(posY + row_height > chartHeight)
               posY = chartHeight - row_height;

         // move the panel
         int size = ArraySize(addedNames);
         for(int i = 0; i < size; i++)
           {
            SetXDistance(addedNames[i], posX - addedXDisDiffrence[i]);
            SetYDistance(addedNames[i], posY - addedYDisDiffrence[i]);
           }
         saveBuffer[sizeArr - 1] = (double)(posX);
         saveBuffer[sizeArr - 2] = (double)(posY);
         ChartRedraw(0);
        }
The last action when moving the panel occurs when the mouse button is released, sparam then ceases to be equal to one.
We bring back the ability to scroll the chart, reset the global variable and write new coordinates of the panel anchor point to the file.
      if(sparam != "1" && (int)GlobalVariableGet("Panel") == prefixInd)
        {
         ChartSetInteger(0, CHART_MOUSE_SCROLL, true);
         GlobalVariableSet("Panel", 0);
         Save();
        }

      previousMouseState = sparam;
     }
We have examined in detail the mechanism for dragging a panel, now we will examine the actions when clicking on the icons for pinning/unpinning a panel or collapsing/expanding a panel.
All this is done in the same OnEvent() function.
When the mouse button is clicked on a graphical object, the sparam variable contains the name of the clicked object. If it matches the ❐ object name, check the next object, and if it is visible, we hide the panel objects. If it is invisible, display all panel objects. Change the panel visibility flag and write it into the array for subsequent saving to a file.
When clicking on the object, the previous code responsible for moving the panel is sometimes triggered, and since the ❐ icon is in the area behind which the panel is dragged, the chart scroll is often disabled. So, let's enable scrolling. For the same reason, we also need to reset a global variable.
Save the changes to a file to display the changes on the chart and redraw it.
   else
      if(id == CHARTEVENT_OBJECT_CLICK)
        {
         if(sparam == addedNames[4]) // prefix+"CollapseExpand"
           {
            if(GetShow(addedNames[5]) == OBJ_ALL_PERIODS)// if the panel is visible, hide it
              {
               SetHide(addedNames[1]);
               for(int i = 5; i < sizeObject; i++)
                  SetHide(addedNames[i]);

               saveBuffer[sizeArr - 3] = ((uint)saveBuffer[sizeArr - 3] & ~FLAG_PANEL_SHOWN) | FLAG_PANEL_HIDDEN;
              }
            else// if the panel is hidden, display it
              {
               for(int i = 0; i < sizeObject; i++)
                  SetShow(addedNames[i]);

               saveBuffer[sizeArr - 3] = ((uint)saveBuffer[sizeArr - 3] & ~FLAG_PANEL_HIDDEN) | FLAG_PANEL_SHOWN;
              }

            ChartSetInteger(0, CHART_MOUSE_SCROLL, true);
            GlobalVariableSet("Panel", 0);
            Save();
            ChartRedraw(0);
           }
The following code is similar to the one described above, with the only difference being the ∇ object name
         else
            if(sparam == addedNames[3]) // prefix+"PinUnpin"
              {
               if(((uint)saveBuffer[sizeArr - 3] & FLAG_PANEL_UNPIN) == FLAG_PANEL_UNPIN)
                 {
                  saveBuffer[sizeArr - 3] = ((uint)saveBuffer[sizeArr - 3] & ~FLAG_PANEL_UNPIN) | FLAG_PANEL_FIX;
                  SetText(addedNames[3], _PanelUnpin);
                 }
               else
                 {
                  saveBuffer[sizeArr - 3] = ((uint)saveBuffer[sizeArr - 3] & ~FLAG_PANEL_FIX) | FLAG_PANEL_UNPIN;
                  SetText(addedNames[3], _PanelPin);
                 }

               ChartSetInteger(0, CHART_MOUSE_SCROLL, true);
               GlobalVariableSet("Panel", 0);
               Save();
               ChartRedraw(0);
              }
The code ends with the indicator deletion button:
            else
               if(sparam == prefix + "delButton") // handle the indicator deletion button
                  ChartIndicatorDelete(0, ChartWindowFind(), indName);
        }
The last event we need to handle is creating a graphical object.
Newly created objects are usually placed in the foreground and may overlap the panel, so we first remember the state of the object's selection, then we hide/display the panel to bring it to the foreground, and finally restore the state of the object selection. Why all this fuss? Programmatic hiding the display of panel objects causes the removal of selection from newly created objects.
This phenomenon is described in more detail here.
      else
         if(id == CHARTEVENT_OBJECT_CREATE)//https://www.mql5.com/ru/articles/13179   "Making a dashboard to display data in indicators and EAs"
           {
            bool select = GetSelect(sparam);
            HideShow(((uint)saveBuffer[sizeArr - 3] & FLAG_PANEL_HIDDEN) == FLAG_PANEL_HIDDEN);// hide/display the panel so that it is in the foreground
            SetSelect(sparam, select);// restore the state of the extreme object
           }

   return true;
  }
This completes the description of the panel code.
What edits need to be made to the indicator code
Different indicators require different changes. It was not possible to create a universal code that could be inserted into the indicator and get a ready-made control panel. Each indicator needs to be handled separately.
Here I will give some examples that will help you change other indicators in a similar way.
For consistency, I have added the word "Pnl" to the names of modified indicators.
Custom Moving Average indicator
To control the indicator from the panel, we should be able to change the input variables. However, the input variables are constant and cannot be changed.
To solve this problem, we can copy the input variables into regular variables that can be modified. To keep changes to the indicator code to a minimum, we declare the new variables with the same names as the current input variables, while adding an underscore to them.
Previous:

After:
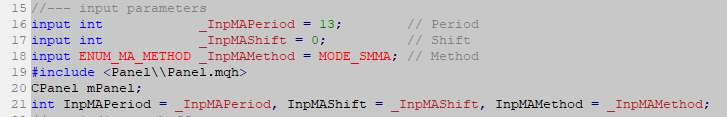
Right after the input parameters, include the Panel.mqh file and declare the instance of the CPanel mPanel class;
If the #include directive is set before the input parameters, then all the input parameters set in the include file will be located higher than the input parameters of the indicator, and this will cause inconvenience when launching the indicator.
If we do everything right, we should see a picture like this:
If we do not need the panel settings, we can simply delete all the words "input" in the Panel.mqh include file and use the default settings.
Add the following code in the OnInit() function.
Next, check if the panel is enabled in the indicator, download previously saved panel settings if this is not the first time the indicator is launched on this chart. If this is the first launch, change the size of the array by the number of input parameters (there are three of them) and set the values of these input parameters into the array.
   if(!NoPanel)
     {
      if(mPanel.Load(short_name))
        {
         InpMAPeriod = (int)mPanel.saveBuffer[0];
         InpMAShift  = (int)mPanel.saveBuffer[1];
         InpMAMethod = (int)mPanel.saveBuffer[2];
        }
      else
        {
         mPanel.Resize(3);
         mPanel.saveBuffer[0] = InpMAPeriod;
         mPanel.saveBuffer[1] = InpMAShift;
         mPanel.saveBuffer[2] = InpMAMethod;
        }
Panel name, indicator name
Then everything is filled in the same way: object name, object type, panel row index, the object itself, percent of panel width.
      mPanel.Init("Moving Average", short_name);
      mPanel.Record("MAPeriodText", OBJ_LABEL, 1, "MAPeriod:", 50);
      mPanel.Record("MAPeriod", OBJ_EDIT, 1, IntegerToString(InpMAPeriod), 50);
      mPanel.Record("MAShiftText", OBJ_LABEL, 2, "MAShift:", 50);
      mPanel.Record("MAShift", OBJ_EDIT, 2, IntegerToString(InpMAShift), 50);
      mPanel.Record("MAMethodText", OBJ_LABEL, 3, "MAMethod:", 50);
      mPanel.Record("MAMethod", OBJ_EDIT, 3, IntegerToString(InpMAMethod), 50);
      mPanel.Create();
     }
If we run the indicator at this stage, we will get a panel like this:
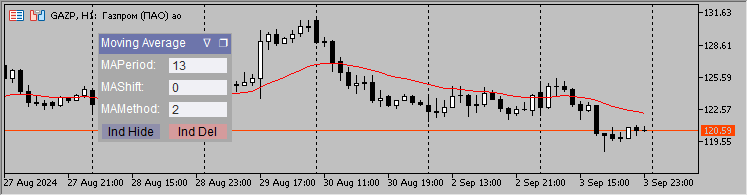
So, we have a panel, all that remains is to write the code for communication with the user.
Add one more function to the indicator — OnChartEvent().
The method responsible for moving the panel is described above. When the event of "completing editing the text in the Edit graphical object" occurs, check the Edit object prefix, in which editing was completed. If the prefix matches the prefix of our panel, then we check which of the indicator parameters was changed, set the changes to the variable and to the array for later saving.
Next, we save all changes to the file and restart the indicator.
void OnChartEvent(const int id, const long& lparam, const double& dparam, const string& sparam)
  {
   mPanel.OnEvent(id, lparam, dparam, sparam);

   if(id == CHARTEVENT_OBJECT_ENDEDIT)
      if(StringFind(sparam, mPanel.prefix) >= 0)
        {
         if(sparam == mPanel.prefix + "MAPeriod")
           {
            mPanel.saveBuffer[0] = InpMAPeriod = (int)StringToInteger(GetText(sparam));
           }
         else
            if(sparam == mPanel.prefix + "MAShift")
              {
               mPanel.saveBuffer[1] = InpMAShift = (int)StringToInteger(GetText(sparam));
               PlotIndexSetInteger(0, PLOT_SHIFT, InpMAShift);
              }
            else
               if(sparam == mPanel.prefix + "MAMethod")
                 {
                  mPanel.saveBuffer[2] = InpMAMethod = (int)StringToInteger(GetText(sparam));
                 }

         mPanel.Save();
         ChartSetSymbolPeriod(0, _Symbol, PERIOD_CURRENT);
        }
Handling the hide/display button in the MA indicator is extremely simple.
In order to hide the moving line, we only need to set the style of the DRAW_NONE graphical construction to display DRAW_LINE respectively.
   if(id == CHARTEVENT_OBJECT_CLICK && sparam == mPanel.prefix + "hideButton")
      if(GetButtonState(sparam))
        {
         PlotIndexSetInteger(0, PLOT_DRAW_TYPE, DRAW_NONE);
         mPanel.HideShowInd(true);
        }
      else
        {
         PlotIndexSetInteger(0, PLOT_DRAW_TYPE, DRAW_LINE);
         mPanel.HideShowInd(false);
        }
  }
This completes the changes to the Custom Moving Average indicator. The modified indicator is called Custom Moving Average Pnl.
ParabolicSAR indicator
ParabolicSAR indicator modification is absolutely identical to the Custom Moving Average indicator with the exception of very small nuances.
The ParabolicSAR indicator does not require creating new variables with the same name as the input variables, since they are already there.
Therefore, we immediately add the include file:
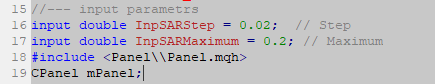
In OnInit(), add the code:
  if(!NoPanel)
     {
      if(mPanel.Load(short_name))
        {
         ExtSarStep = mPanel.saveBuffer[0];
         ExtSarMaximum = mPanel.saveBuffer[1];
        }
      else
        {
         mPanel.Resize(2);
         mPanel.saveBuffer[0] = ExtSarStep;
         mPanel.saveBuffer[1] = ExtSarMaximum;
        }
      mPanel.Init("ParabolicSAR", short_name);
      mPanel.Record("SARStepText", OBJ_LABEL, 1, "SARStep:", 50);
      mPanel.Record("SARStep", OBJ_EDIT, 1, DoubleToString(ExtSarStep, 3), 50);
      mPanel.Record("SARMaximumText", OBJ_LABEL, 2, "SARMax:", 50);
      mPanel.Record("SARMaximum", OBJ_EDIT, 2, DoubleToString(ExtSarMaximum, 2), 50);
      mPanel.Create();
     }
Add the OnChartEvent() function to the indicator code.
//+------------------------------------------------------------------+
void OnChartEvent(const int id, const long& lparam, const double& dparam, const string& sparam)
  {
   mPanel.OnEvent(id, lparam, dparam, sparam);

   if(id == CHARTEVENT_OBJECT_ENDEDIT)
      if(StringFind(sparam, mPanel.prefix) >= 0)
        {
         if(sparam == mPanel.prefix + "SARStep")
            mPanel.saveBuffer[0] = ExtSarStep = StringToDouble(GetText(sparam));
         else
            if(sparam == mPanel.prefix + "SARMaximum")
               mPanel.saveBuffer[1] = ExtSarMaximum = StringToDouble(GetText(sparam));

         mPanel.Save();
         ChartSetSymbolPeriod(0, _Symbol, PERIOD_CURRENT);
        }

   if(id == CHARTEVENT_OBJECT_CLICK && sparam == mPanel.prefix + "hideButton")
      if(GetButtonState(sparam))
        {
         PlotIndexSetInteger(0, PLOT_DRAW_TYPE, DRAW_NONE);
         mPanel.HideShowInd(true);
        }
      else
        {
         PlotIndexSetInteger(0, PLOT_DRAW_TYPE, DRAW_ARROW);
         PlotIndexSetInteger(0, PLOT_ARROW, 159);
         mPanel.HideShowInd(false);
        }
  }
//+------------------------------------------------------------------+
These are all the changes to the ParabolicSAR indicator.
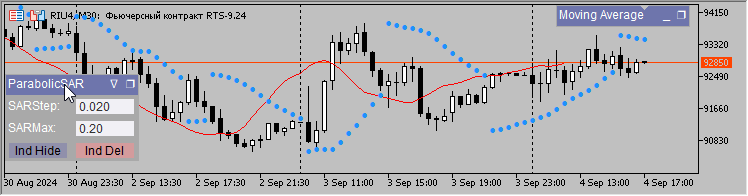
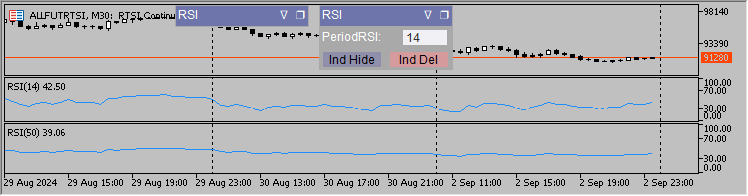
RSI indicator
In the RSI indicator, everything is done exactly the same as in the previous two indicators.
After the input settings, insert:
#include <Panel\\Panel.mqh>
CPanel mPanel;
Next, in OnInit():
   if(!NoPanel)
     {
      if(mPanel.Load(short_name))
        {
         ExtPeriodRSI = (int)mPanel.saveBuffer[0];
        }
      else
        {
         mPanel.Resize(1);
         mPanel.saveBuffer[0] = ExtPeriodRSI;
        }
      mPanel.Init("RSI", short_name);
      mPanel.Record("PeriodRSIText", OBJ_LABEL, 1, "PeriodRSI:", 60);
      mPanel.Record("PeriodRSI", OBJ_EDIT, 1, IntegerToString(ExtPeriodRSI), 40);
      mPanel.Create();
     }
OnChartEvent() will be slightly different from the previous indicators.
The input field object is handled the same way. But hiding/displaying the indicator is processed differently. Up to now, we considered indicators from the main chart, while RSI is a subwindow indicator.
When clicking Ind Hide, we set the indicator window height to zero. Change the panel color, as well as the button color and text.
When pressing the button again (it now has a different name — Ind Show), we set the value of CHART_HEIGHT_IN_PIXELS to -1. We change the panel color, as well as the button color and text.
Quote from the textbook:
"Setting the CHART_HEIGHT_IN_PIXELS property programmatically prevents the user from editing the window/subwindow size. To disable the size fixation, set the property value to -1".
//+------------------------------------------------------------------+
void OnChartEvent(const int id, const long& lparam, const double& dparam, const string& sparam)
  {
   if(mPanel.OnEvent(id, lparam, dparam, sparam))
     {
      if(id == CHARTEVENT_OBJECT_ENDEDIT)
         if(StringFind(sparam, mPanel.prefix) >= 0)
            if(sparam == mPanel.prefix + "PeriodRSI")
              {
               mPanel.saveBuffer[0] = ExtPeriodRSI = (int)StringToInteger(GetText(sparam));
               mPanel.Save();
               ChartSetSymbolPeriod(0, _Symbol, PERIOD_CURRENT);
              }

      if(id == CHARTEVENT_OBJECT_CLICK && sparam == mPanel.prefix + "hideButton") // hide the subwindow indicator
        {
         if(GetButtonState(sparam))
           {
            ChartSetInteger(0, CHART_HEIGHT_IN_PIXELS, ChartWindowFind(), 0);
            mPanel.HideShowInd(true);
           }
         else
           {
            ChartSetInteger(0, CHART_HEIGHT_IN_PIXELS, ChartWindowFind(), -1);
            mPanel.HideShowInd(false);
           }
        }
     }
  }
//+------------------------------------------------------------------+
Yet another indicator
There are indicators that do not use graphical styles at all, instead they draw graphical objects, usually arrows. This is another option for handling the "Hide/Display Indicator" button. Let's look at it in more detail.
Instead of looking for an indicator with arrows, I just wrote a fractal indicator, in which the upper icons are displayed using the PLOT_ARROW graphical construction, while the lower ones are displayed by plotting the OBJ_ARROW object.
I will provide the indicator code here in full.
The settings include the size of the fractal shoulders, as well as the number of days, on which we will draw OBJ_ARROW. We had to resort to limiting the number of days, since a large number of objects could significantly slow down the chart.
As in the previous indicators, immediately after the input variables, we include the Panel.mqh file and declare the CPanel class instance.
Duplicate input variables with normal ones.
#property indicator_chart_window
#property indicator_plots 1
#property indicator_buffers 1
#property indicator_type1   DRAW_ARROW
#property indicator_color1  clrRed
#property indicator_label1 "Fractals"

input int  _day      = 10; // day
input int  _barLeft  = 1;  // barLeft
input int  _barRight = 1;  // barRight
#include <Panel\\Panel.mqh>
CPanel mPanel;

double buff[];
int day = _day, barLeft = _barLeft, barRight = _barRight;
datetime limitTime = 0;
In OnInit(), everything is the same as in the previous indicators.
//+------------------------------------------------------------------+
int OnInit()
  {
   SetIndexBuffer(0, buff, INDICATOR_DATA);
   PlotIndexSetDouble(0, PLOT_EMPTY_VALUE, 0.0);
   PlotIndexSetInteger(0, PLOT_ARROW, 217);
   PlotIndexSetInteger(0, PLOT_ARROW_SHIFT, -5);
   string short_name = StringFormat("Fractals(%d,%d)", _barLeft, _barRight);
   IndicatorSetString(INDICATOR_SHORTNAME, short_name);

   if(!NoPanel)
     {
      if(mPanel.Load(short_name))
        {
         day = (int)mPanel.saveBuffer[0];
         barLeft = (int)mPanel.saveBuffer[1];
         barRight = (int)mPanel.saveBuffer[2];
        }
      else
        {
         mPanel.Resize(3);
         mPanel.saveBuffer[0] = day;
         mPanel.saveBuffer[1] = barLeft;
         mPanel.saveBuffer[2] = barRight;
        }
      mPanel.Init("Fractals", short_name);
      mPanel.Record("dayText", OBJ_LABEL, 1, "Days:", 50);
      mPanel.Record("day", OBJ_EDIT, 1, IntegerToString(day), 50);
      mPanel.Record("barLeftText", OBJ_LABEL, 2, "barLeft:", 50);
      mPanel.Record("barLeft", OBJ_EDIT, 2, IntegerToString(barLeft), 50);
      mPanel.Record("barRightText", OBJ_LABEL, 3, "barRight:", 50);
      mPanel.Record("barRight", OBJ_EDIT, 3, IntegerToString(barRight), 50);
      mPanel.Create();
     }

   return(INIT_SUCCEEDED);
  }
//+------------------------------------------------------------------+
The main differences from OnChartEvent() in previous indicators is that each time the indicator parameters change, we need to delete the objects drawn by the indicator from the chart.
If we press the button that hides the indicator, we hide all the objects drawn by the indicator in the loop. Besides, we also set the type of the DRAW_NONE graphical construction.
In a reverse case, we need not only to set the type of the DRAW_ARROW graphical construction, but also set the arrow index from Wingdings. Next, in the loop we turn all hidden objects into visible ones.
//+------------------------------------------------------------------+
void OnChartEvent(const int id, const long& lparam, const double& dparam, const string& sparam)
  {
   mPanel.OnEvent(id, lparam, dparam, sparam);

   if(id == CHARTEVENT_OBJECT_ENDEDIT)
      if(StringFind(sparam, mPanel.prefix) >= 0)
        {
         if(sparam == mPanel.prefix + "day")
            mPanel.saveBuffer[0] = day = (int)StringToInteger(GetText(sparam));
         else
            if(sparam == mPanel.prefix + "barLeft")
               mPanel.saveBuffer[1] = barLeft = (int)StringToInteger(GetText(sparam));
            else
               if(sparam == mPanel.prefix + "barRight")
                  mPanel.saveBuffer[2] = barRight = (int)StringToInteger(GetText(sparam));

         mPanel.Save();
         ObjectsDeleteAll(0, mPanel.prefix + "DN_", 0, OBJ_ARROW);
         ChartSetSymbolPeriod(0, _Symbol, PERIOD_CURRENT);
        }

   if(id == CHARTEVENT_OBJECT_CLICK && sparam == mPanel.prefix + "hideButton")
     {
      if(GetButtonState(sparam))
        {
         PlotIndexSetInteger(0, PLOT_DRAW_TYPE, DRAW_NONE);
         for(int i = ObjectsTotal(0) - 1; i >= 0; i--)
           {
            string name = ObjectName(0, i);
            if(StringFind(name, "DN_") >= 0)
               SetHide(name);
           }
         mPanel.HideShowInd(true);
        }
      else
        {
         PlotIndexSetInteger(0, PLOT_DRAW_TYPE, DRAW_ARROW);
         PlotIndexSetInteger(0, PLOT_ARROW, 217);
         for(int i = ObjectsTotal(0) - 1; i >= 0; i--)
           {
            string name = ObjectName(0, i);
            if(StringFind(name, "DN_") >= 0)
               SetShow(name);
           }
         mPanel.HideShowInd(false);
        }
     }
  }
//+------------------------------------------------------------------+
We also need to add the check for the flag, indicating the need to hide the indicator, after each newly drawn object. If this flag is 'true', the newly drawn object should be hidden.
//+------------------------------------------------------------------+
int OnCalculate(const int rates_total,
                const int prev_calculated,
                const datetime &time[],
                const double &open[],
                const double &high[],
                const double &low[],
                const double &close[],
                const long &tick_volume[],
                const long &volume[],
                const int &spread[])
  {
   int limit = prev_calculated - 1;

   if(prev_calculated <= 0)
     {
      ArrayInitialize(buff, 0);
      datetime itime = iTime(_Symbol, PERIOD_D1, day);
      limitTime = itime <= 0 ? limitTime : itime;

      if(limitTime <= 0)
         return 0;
      int shift = iBarShift(_Symbol, PERIOD_CURRENT, limitTime);
      limit = MathMax(rates_total - shift, barRight + barLeft);
     }

   for(int i = limit; i < rates_total && !IsStopped(); i++)
     {
      bool condition = true;
      for(int j = i - barRight - barLeft + 1; j <= i - barRight; j++)
         if(high[j - 1] >= high[j])
           {
            condition = false;
            break;
           }

      if(condition)
         for(int j = i - barRight + 1; j <= i; j++)
            if(high[j - 1] <= high[j])
              {
               condition = false;
               break;
              }

      if(condition)
         buff[i - barRight] = high[i - barRight];

      condition = true;
      for(int j = i - barRight - barLeft + 1; j <= i - barRight; j++)
         if(low[j - 1] <= low[j])
           {
            condition = false;
            break;
           }

      if(condition)
         for(int j = i - barRight + 1; j <= i; j++)
            if(low[j - 1] >= low[j])
              {
               condition = false;
               break;
              }

      if(condition)
        {
         string name = mPanel.prefix + "DN_" + (string)time[i - barRight];
         ObjectCreate(0, name, OBJ_ARROW, 0, time[i - barRight], low[i - barRight]);
         ObjectSetInteger(0, name, OBJPROP_ARROWCODE, 218);
         ObjectSetInteger(0, name, OBJPROP_COLOR, clrBlue);
         if(mPanel.hideObject)
            SetHide(name);
        }
     }
   return(rates_total);
  }
//+------------------------------------------------------------------+
void OnDeinit(const int reason)
  {
   ObjectsDeleteAll(0, mPanel.prefix + "DN_", 0, OBJ_ARROW);
  }
//+------------------------------------------------------------------+
While working on the article, I gave an example of using the panel as a quick access to object settings. I think, it is worth explaining the indicator code.
Setting Objects Pnl indicator
In this indicator, we do not need to create an object of the panel class in OnInit(), since the panel should be called for different objects, which means we will create it dynamically using the new operator.
Declare a class object handle. If there was a click on a chart graphical object and Shift key was pressed, initialize the previously created handle of the class object.
We create a panel in the same way as we did in the indicators, with one nuance — the Create() method receives the current mouse chart coordinates as arguments.
Changes in the input fields are handled the same way as in indicators with the only difference that we do not need to save the changes made to the file.
Once the editing is complete, the panel can be removed by pressing the Del Pnl button, while the handle is removed.
Different objects may have different properties, so we should keep this in mind while drawing the panel. If we edit a trend line, then we do not need the field in the panel that is responsible for filling the object.
This means that we do not create such a field for the trend line, instead creating it only for objects designed to be filled. Here we are unable to know the exact number of rows in the panel in advance, therefore we introduce the line variable, write the current row index into it and increase it as needed.
#property indicator_chart_window
#property indicator_plots 0
#define FREE(P) if(CheckPointer(P) == POINTER_DYNAMIC) delete (P)
#include <Panel\\Panel.mqh>
CPanel * mPl;
//+------------------------------------------------------------------+
int OnCalculate(const int, const int, const int, const double &price[]) {return(0);}
//+------------------------------------------------------------------+
void OnChartEvent(const int id,  const long &lparam, const double &dparam, const string &sparam)
  {
   static bool panel = false;

   if(panel)
      mPl.OnEvent(id, lparam, dparam, sparam);

   if(id == CHARTEVENT_OBJECT_CLICK)
      if(!panel)
        {
         if(TerminalInfoInteger(TERMINAL_KEYSTATE_SHIFT) < 0)
           {
            int line = 1;
            mPl = new CPanel();
            ENUM_OBJECT ObjectType = (ENUM_OBJECT)GetType(sparam);
            mPl.Init(EnumToString(ObjectType), sparam);
            mPl.Record("Color_Text", OBJ_LABEL, line, "Color", 50);
            mPl.Record("Color", OBJ_EDIT, line, ColorToString((color)GetColor(sparam)), 50);
            line++;
            mPl.Record("StyleText", OBJ_LABEL, line, "Style", 50);
            mPl.Record("Style", OBJ_EDIT, line, IntegerToString(GetStyle(sparam)), 50);
            line++;
            mPl.Record("WidthText", OBJ_LABEL, line, "Width", 50);
            mPl.Record("Width", OBJ_EDIT, line, IntegerToString(GetWidth(sparam)), 50);
            line++;
            if(ObjectType == OBJ_RECTANGLE || ObjectType == OBJ_RECTANGLE_LABEL || ObjectType == OBJ_TRIANGLE || ObjectType == OBJ_ELLIPSE)
              {
               mPl.Record("FillText", OBJ_LABEL, line, "Fill", 50);
               mPl.Record("Fill", OBJ_EDIT, line, IntegerToString(GetFill(sparam)), 50);
               line++;
              }
            mPl.Record("delButton", OBJ_BUTTON, line, "Del Pnl", 100);
            mPl.Create(0, (int)lparam, (int)dparam);
            panel = true;
           }
        }
      else
         if(sparam == mPl.prefix + "delButton")
           {
            FREE(mPl);
            panel = false;
           }

   if(id == CHARTEVENT_OBJECT_ENDEDIT)
      if(StringFind(sparam, mPl.prefix) >= 0)
        {
         if(sparam == mPl.prefix + "Color")
            SetColor(mPl.indName, StringToColor(GetText(sparam)));
         else
            if(sparam == mPl.prefix + "Style")
               SetStyle(mPl.indName, (int)StringToInteger(GetText(sparam)));
            else
               if(sparam == mPl.prefix + "Width")
                  SetWidth(mPl.indName, (int)StringToInteger(GetText(sparam)));
               else
                  if(sparam == mPl.prefix + "Fill")
                     SetFill(mPl.indName, (int)StringToInteger(GetText(sparam)));
         ChartRedraw();
        }
  }
//+------------------------------------------------------------------+
void OnDeinit(const int reason) {FREE(mPl);}
//+------------------------------------------------------------------+
The object settings panel is called by holding down the Shift key + left-clicking on the object.
Conclusion
Pros:
- A user-friendly solution.
Cons:
- I wanted to set "hiding" the indicator in the CPanel class, but it did not work.
- If we do not add input variables to the short name of the indicator, then calling several indicators with a panel will not be possible due to matching names.
- If we launch an indicator on a chart, change its settings using the panel, and then save the template, then when loading the template, those parameters that were specified in the settings when the indicator was launched are loaded instead of the latest ones.
- Not all indicators can be equipped with a panel.
Translated from Russian by MetaQuotes Ltd.
Original article: https://www.mql5.com/ru/articles/14672
Warning: All rights to these materials are reserved by MetaQuotes Ltd. Copying or reprinting of these materials in whole or in part is prohibited.
This article was written by a user of the site and reflects their personal views. MetaQuotes Ltd is not responsible for the accuracy of the information presented, nor for any consequences resulting from the use of the solutions, strategies or recommendations described.

- Free trading apps
- Over 8,000 signals for copying
- Economic news for exploring financial markets
You agree to website policy and terms of use
That's a lot of letters.
praise and respect to the author!
That's a lot of letters.
praise and respect to the author!
Thank you.
noticed;)
Wow!
I honestly didn't expect it. You have pleasantly surprised me!!!
Great job, Alexander! Respect!