
Market Profile indicator (Part 2): Optimization and rendering on canvas

Contents
Introduction
In the previous article, we delved into the Market Profile indicator. As it turns out, constructing a market profile diagram using ordinary graphical objects consumes quite a lot of resources. Each price point from Low to High of the daily bar is filled with rectangle graphical objects in the number of bars that reached this price level throughout the day. This is true for each item - they all contain many graphical objects, and all these objects are created and drawn for each day where the profile diagram is drawn. When an indicator creates thousands of graphical objects, this may cause significant slowdowns when handling other graphical objects and redrawing the chart.
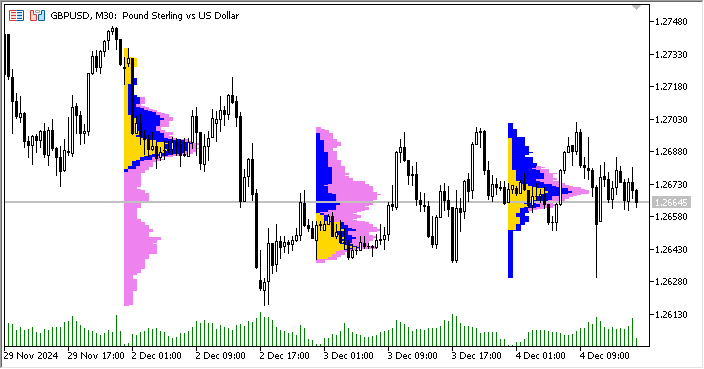
Launching the indicator on the M30 chart and building a Market Profile for just three days:
results in the creation of 4697 rectangular graphical objects:
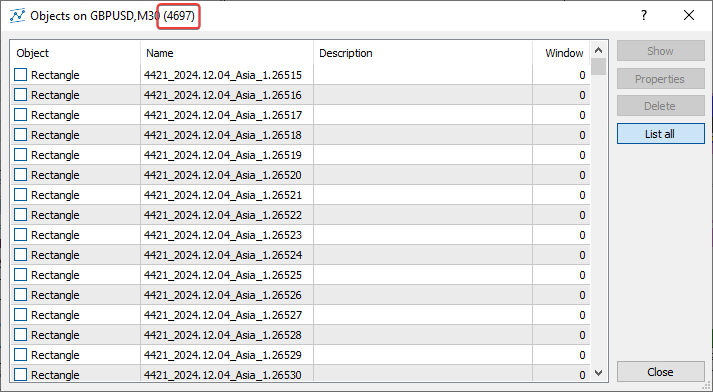
This is a very suboptimal use of resources. If we increase the number of days displayed in the settings, the number of created objects used to draw Market Profile diagrams on the chart for each displayed day will go up dramatically.
But here we simply draw diagrams using graphical objects - rectangles. One short line segment of the profile histogram is one graphical object. This means that we can draw not directly on the chart, but on just one graphical object - a canvas, which is in turn located on the chart along the required coordinates. Then we will have only one (!) graphical object for one day. And for three days there will be three objects instead of 4697! This is a significant difference! This can be done with the help of the CCanvas class for simplified rendering of custom images supplied as part of the client terminal Standard Library.
The version of the Market Profile indicator that renders the profile histogram on the canvas is available in the terminal in \MQL5\Indicators\Free Indicators\, MarketProfile Canvas.mq5 file. While studying the code, we can see that here, unlike the first version (MarketProfile.mq5), the graphics output is made on objects of the CCanvas class. The logic of the indicator remains the same, and we have already discussed it in the "Structure and principles" section of the first article. Rendering is done using the CMarketProfile class, which uses drawing on CCanvas.
The operation logic is extremely simple:
- in a loop by the specified number of days,
- create or get an object of the CMarketProfile class for the current day in the loop,
- draw or redraw the profile of the day on canvas, corresponding to the current day in the loop.
The main work on drawing the profile diagram is carried out inside the CMarketProfile class. Let's take a look at the structure and operation of this class.
CMarketProfile class
Open the file \MQL5\Indicators\Free Indicators\MarketProfile Canvas.mq5 and find the code of the CMarketProfile class in it. Let's look at what's there and discuss what it's all for:
//+------------------------------------------------------------------+
//| Class to store and draw Market Profile for the daily bar         |
//+------------------------------------------------------------------+
class CMarketProfile
  {
public:
                     CMarketProfile() {};
                     CMarketProfile(string prefix, datetime time1, datetime time2, double high, double low, MqlRates &bars[]);
                    ~CMarketProfile(void);

   //--- checks if the object was created for the specified date
   bool              Check(string prefix, datetime time);
   //--- set high/low and array of intraday bars
   void              SetHiLoBars(double high, double low, MqlRates &bars[]);
   //--- set canvas dimensions and drawing options
   void              UpdateSizes(void);
   //--- is the profile in the visible part of the chart?
   bool              isVisibleOnChart(void);
   //--- has the graph scale changed?
   bool              isChartScaleChanged(void);
   //--- calculates profile by sessions
   bool              CalculateSessions(void);
   //--- draws a profile
   void              Draw(double multiplier=1.0);
   //---
protected:
   CCanvas           m_canvas;      // CCanvas class object for drawing profile
   uchar             m_alpha;       // alpha channel value that sets transparency
   string            m_prefix;      // unique prefix of the OBJ_BITMAP object
   string            m_name;        // name of the OBJ_BITMAP object used in m_canvas
   double            m_high;        // day's High
   double            m_low;         // day's Low
   datetime          m_time1;       // start time of the day
   datetime          m_time2;       // end time of the day
   int               m_day_size_pt; // daily bar height in points
   int               m_height;      // daily bar height in pixels on the chart
   int               m_width;       // daily bar width in pixels on the chart
   MqlRates          m_bars[];      // array of bars of the current timeframe between m_time1 and m_time2
   vector            m_asia;        // array of bar counters for the Asian session
   vector            m_europe;      // array of bar counters for the European session
   vector            m_america;     // array of bar counters for the American session
   double            m_vert_scale;  // vertical scaling factor
   double            m_hor_scale;   // horizontal scaling factor
  };
Public methods declared in the class:
- Check() method is used to check the existence of a market profile object created for a specific day;
- SetHiLoBars() method is used to set the High and Low price values of the day into the market profile object and to pass an array of intraday bars into the object;
- UpdateSizes() method sets the canvas dimensions and scaling factors for drawing rectangles in the market profile object;
- isVisibleOnChart() method returns thed flag indicating that the market profile is within the chart's visibility;
- isChartScaleChanged() method is declared in the class but not implemented;
- CalculateSessions() method calculates parameters and fills trading session arrays;
- Draw() method draws a market profile histogram on the canvas based on data from all trading sessions.
The purpose of variables declared in the protected section of a class is fairly clear. I would like to dwell on the arrays of session bar counters.
All of them are declared as vector variables, which allows handling them as data arrays, although a bit simpler:
The use of vectors and matrices, or rather, of special methods of the relevant types, enables the creation of simpler, briefer and clearer code, which is close to mathematical notation. With these methods, you can avoid the need to create nested loops or to mind correct indexing of arrays in calculations. Therefore, the use of matrix and vector methods increases the reliability and speed in developing complex programs.
Let's consider the implementation of the declared class methods.
Constructor:
//+------------------------------------------------------------------+
//| Constructor                                                      |
//+------------------------------------------------------------------+
void CMarketProfile::CMarketProfile(string prefix, datetime time1, datetime time2, double high, double low, MqlRates &bars[]):
   m_prefix(prefix),
   m_time1(time1),
   m_time2(time2),
   m_high(high),
   m_low(low),
   m_vert_scale(NULL),
   m_hor_scale(NULL)
  {
//--- copy the array of intraday bars to the array of MqlRates structures,
//--- create a name for the graphical object and define the size of the daily candle
   ArrayCopy(m_bars, bars);
   m_name=ExtPrefixUniq+"_MP_"+TimeToString(time1, TIME_DATE);
   m_day_size_pt=(int)((m_high-m_low)/SymbolInfoDouble(Symbol(), SYMBOL_POINT));
//--- set vector sizes for trading sessions
   m_asia=vector::Zeros(m_day_size_pt);
   m_europe=vector::Zeros(m_day_size_pt);
   m_america=vector::Zeros(m_day_size_pt);
//--- set the width and height of the canvas
   UpdateSizes();
//--- if this is the first tick at the beginning of the day, then the canvas dimensions will be zero - set the dimensions to 1 pixel in height and width
   m_height=m_height?m_height:1;
   m_width=m_width?m_width:1;
//--- create a graphical object
   if(m_canvas.CreateBitmap(m_name, m_time1, m_high, m_width, m_height, COLOR_FORMAT_ARGB_NORMALIZE))
      ObjectSetInteger(0, m_name, OBJPROP_BACK, true);
   else
     {
      Print("Error creating canvas: ", GetLastError());
      Print("time1=", m_time1, "  high=", m_high, "  width=", m_width, "  height=", m_height);
     }
  }
The parametric constructor receives the prefix of the name of the canvas object being created (on which the day profile is to be rendered), the start and end time of the day, the maximum and minimum prices of the day, and an array of intraday bars. The values of these variables are set to the corresponding class variables in the initialization string. Next:
- the array passed by reference is copied to the class array, a unique name of the graphical object is created from the one passed in the inputs of the prefix, "_MP_" abbreviation and day opening time, and the daily candle is calculated in points;
- each of the trading session arrays receives a size equal to the size of the daily bar in points and is simultaneously filled with zeros - initialized;
- the dimensions of the canvas for drawing the profile are set, and if this is the first tick of the day, the size will be zero, and the width and height are set to the minimum allowed dimensions of one pixel in both dimensions;
- a drawing canvas is created according to the specified dimensions.
The method to check for existence of a market profile object created for a given day:
//+------------------------------------------------------------------+
//| Checks if CMarketProfile object is for the specified 'time' date |
//+------------------------------------------------------------------+
bool CMarketProfile::Check(string prefix, datetime time)
  {
   string calculated= prefix+"_MP_"+TimeToString(time, TIME_DATE);
   return (m_name==(calculated));
  };
Since the name of each profile canvas object is set in the class constructor, and the name uses a string representation of the start time of the day, then, in order to check that the object was created for a specific time, the start time of the day is passed to the method, a string identical to the object name string is created, and the created string is compared with the actual name of the object. The result of the check is returned from the method.
The method for setting the High and Low prices of the day to a market profile object and passing an array of intraday bars to the object:
//+------------------------------------------------------------------+
//| Sets High/Low and a set of current-timeframe bars                |
//+------------------------------------------------------------------+
void CMarketProfile::SetHiLoBars(double high, double low, MqlRates &bars[])
  {
//--- if the maximum of the day has changed, move the OBJ_BITMAP object to the new Y coordinate
   if(high>m_high)
     {
      m_high=high;
      if(!ObjectSetDouble(0, m_name, OBJPROP_PRICE, m_high))
         PrintFormat("Failed to update canvas for %s, error %d", TimeToString(m_time1, TIME_DATE), GetLastError());
     }
   ArrayCopy(m_bars, bars);
   m_high=high;
   m_low=low;
//--- daily range in points
   m_day_size_pt=(int)((m_high-m_low)/SymbolInfoDouble(Symbol(), SYMBOL_POINT));
//--- reset vector sizes for trading sessions
   m_asia=vector::Zeros(m_day_size_pt);
   m_europe=vector::Zeros(m_day_size_pt);
   m_america=vector::Zeros(m_day_size_pt);
  }
The method receives the High and Low values of the daily candle, as well as an array of intraday bars in the MqlRates structure format by reference.
- the High price is written to the object variable and the canvas is shifted to a new coordinate;
- intraday bars are copied from the passed array of bars to the internal array;
- the Low price of the day is set to the class variable;
- the new size of the daily bar is calculated in points
- trading session arrays are increased by the calculated value of the daily bar size in points and filled with zeros - initialized.
It should be noted that the Zeros() matrix and vector method is used to initialize the vectors. The method both sets the size of the vector and fills the entire array with zeros.
For a simple array, we would have to perform two operations: ArrayResize() and ArrayInitialize().
The method to set the canvas dimensions and scaling factors for drawing rectangles in the market profile object:
//+------------------------------------------------------------------+
//|  Sets drawing parameters                                         |
//+------------------------------------------------------------------+
void CMarketProfile::UpdateSizes(void)
  {
//--- convert time/price to x/y coordinates
   int x1, y1, x2, y2;
   ChartTimePriceToXY(0, 0, m_time1, m_high, x1, y1);
   ChartTimePriceToXY(0, 0, m_time2, m_low,  x2, y2);
//--- calculate canvas dimensions
   m_height=y2-y1;
   m_width =x2-x1;
//--- calculate ratios for transforming vertical price levels
//--- and horizontal bar counters to chart pixels
   m_vert_scale=double(m_height)/(m_day_size_pt);
   m_hor_scale =double(m_width*PeriodSeconds(PERIOD_CURRENT))/PeriodSeconds(PERIOD_D1);

//--- change the canvas size
   m_canvas.Resize(m_width, m_height);
  }
The logic of the method is commented in the code. Scaling ratios are used to set the sizes of rectangles drawn on the canvas based on the ratio of the canvas size to the chart window size.
The calculated ratios are added to the calculation of the height and width of the rendered rectangles.
The method that returns a flag that the Market Profile is within the chart visibility:
//+------------------------------------------------------------------+
//|  Checks that the profile is in the visible part of the chart     |
//+------------------------------------------------------------------+
bool CMarketProfile::isVisibleOnChart(void)
  {
   long last_bar=ChartGetInteger(0, CHART_FIRST_VISIBLE_BAR);        // last visible bar on the chart on the left
   long first_bar=last_bar+-ChartGetInteger(0, CHART_VISIBLE_BARS);  // first visible bar on the chart on the right
   first_bar=first_bar>0?first_bar:0;
   datetime left =iTime(Symbol(), Period(), (int)last_bar);          // time of the left visible bar on the chart
   datetime right=iTime(Symbol(), Period(), (int)first_bar);         // time of the right visible bar on the chart

//--- return a flag that the canvas is located inside the left and right visible bars of the chart
   return((m_time1>= left && m_time1 <=right) || (m_time2>= left && m_time2 <=right));
  }
Here we find the numbers of the left and right visible bars on the chart, get their time and return the flag that the time of the left and right edges of the canvas are inside the area of visible bars on the chart.
The method that calculates parameters and fills trading session arrays:
//+------------------------------------------------------------------+
//| Prepares profile arrays by sessions                              |
//+------------------------------------------------------------------+
bool CMarketProfile::CalculateSessions(void)
  {
   double point=SymbolInfoDouble(Symbol(), SYMBOL_POINT);   // one point value
//--- if the array of intraday bars is not filled, leave
   if(ArraySize(m_bars)==0)
      return(false);
//---- iterate over all the bars of the current day and mark the cells of the arrays (vectors) that contain the bars being iterated over in the loop
   int size=ArraySize(m_bars);
   for(int i=0; i<size; i++)
     {
      //--- get the bar hour
      MqlDateTime bar_time;
      TimeToStruct(m_bars[i].time, bar_time);
      uint        hour     =bar_time.hour;
      //--- calculate price levels in points from the Low of the day reached by the price on each bar of the loop
      int         start_box=(int)((m_bars[i].low-m_low)/point);   // index of the beginning of price levels reached by the price on the bar
      int         stop_box =(int)((m_bars[i].high-m_low)/point);  // index of the end of price levels reached by the price on the bar

      //--- American session
      if(hour>=InpAmericaStartHour)
        {
         //--- in the loop from the beginning to the end of price levels, fill the counters of bars where the price was at this level
         for(int ind=start_box; ind<stop_box; ind++)
            m_america[ind]++;
        }
      else
        {
         //--- European session
         if(hour>=InpEuropeStartHour && hour<InpAmericaStartHour)
            //--- in the loop from the beginning to the end of price levels, fill the counters of bars where the price was at this level
            for(int ind=start_box; ind<stop_box; ind++)
               m_europe[ind]++;
         //--- Asian session
         else
            //--- in the loop from the beginning to the end of price levels, fill the counters of bars where the price was at this level
            for(int ind=start_box; ind<stop_box; ind++)
               m_asia[ind]++;
        }
     }
//--- vectors of all sessions are ready
   return(true);
  }
In the previous article, we thoroughly considered the logic of defining the number of bars in a trading session whose price reached levels in points from Low to High of the day. If in the previous version of the indicator all this was done in the main loop of the indicator, then here this entire calculation is taken out into a separate method of the day profile object. The point here is to count and write into the array (vector) cells the number of bars that cross each price level calculated in points from Low to High of the day. After the method completes its work, all vectors will be filled in accordance with the price movement at price levels. The number of bars that crossed each level will be set in the corresponding cells of the array (vector).
The method that draws a market profile histogram on canvas based on data from all trading sessions:
//+------------------------------------------------------------------+
//|  Draw Market Profile on the canvas                               |
//+------------------------------------------------------------------+
void CMarketProfile::Draw(double multiplier=1.0)
  {
//--- sum up all sessions for rendering
   vector total_profile=m_asia+m_europe+m_america;   // profile that combines all sessions
   vector europe_asia=m_asia+m_europe;               // profile that combines only the European and Asian sessions

//--- set a completely transparent background for the canvas
   m_canvas.Erase(ColorToARGB(clrBlack, 0));

//--- variables for drawing rectangles
   int x1=0;                           // X coordinate of the left corner of the rectangle always starts at zero
   int y1, x2, y2;                     // rectangle coordinates
   int size=(int)total_profile.Size(); // size of all sessions

//--- render the American session with filled rectangles
   for(int i=0; i<size; i++)
     {
      //--- skip zero vector values
      if(total_profile[i]==0)
         continue;
      //--- calculate two points to draw a rectangle, x1 is always 0 (X of the lower left corner of the rectangle)
      y1=m_height-int(i*m_vert_scale);                    // Y coordinate of the lower left corner of the rectangle
      y2=(int)(y1+m_vert_scale);                          // Y coordinate of the upper right corner of the rectangle
      x2=(int)(total_profile[i]*m_hor_scale*multiplier);  // X coordinate of the upper right corner of the rectangle
      //--- draw a rectangle at the calculated coordinates with the color and transparency set for the American session
      m_canvas.FillRectangle(x1, y1, x2, y2, ColorToARGB(InpAmericaSession, InpTransparency));
     }

//--- render the European session with filled rectangles
   for(int i=0; i<size; i++)
     {
      //--- skip zero vector values
      if(total_profile[i]==0)
         continue;
      //--- calculate two points to draw a rectangle
      y1=m_height-int(i*m_vert_scale);
      y2=(int)(y1+m_vert_scale);
      x2=(int)(europe_asia[i]*m_hor_scale*multiplier);
      //--- draw a rectangle over the rendered American session using the calculated coordinates
      //--- with color and transparency set for the European session
      m_canvas.FillRectangle(x1, y1, x2, y2, ColorToARGB(InpEuropeSession, InpTransparency));
     }

//--- draw the Asian session with filled rectangles
   for(int i=0; i<size; i++)
     {
      //--- skip zero vector values
      if(total_profile[i]==0)
         continue;
      //--- calculate two points to draw a rectangle
      y1=m_height-int(i*m_vert_scale);
      y2=(int)(y1+m_vert_scale);
      x2=(int)(m_asia[i]*m_hor_scale*multiplier);
      //--- draw a rectangle over the rendered European session using the calculated coordinates
      //--- with color and transparency set for the Asian session
      m_canvas.FillRectangle(x1, y1, x2, y2, ColorToARGB(InpAsiaSession, InpTransparency));
     }
//--- update the OBJ_BITMAP object without redrawing the chart
   m_canvas.Update(false);
  }
The method logic has been described in the code comments in detail. In short, we have calculated and filled arrays (vectors) of three sessions - Asian, European and American. It is necessary to render a profile histogram for each session. First, the American session is rendered, then the European session is rendered on top of it, and finally, the Asian session is rendered on top of the two sessions drawn.
Why do we render sessions in reverse order of their running time?
- The American session, or rather its histogram, includes both the already traded time of the two previous sessions, and the time of the American session, i.e. this is the most complete histogram of the profile of the entire day. That is why it is rendered first.
- Then the European session is rendered, which includes the time of the already traded Asian session. Accordingly, since there are only two sessions here - Asian and European, the histogram will be shorter on the X axis of the American session, which means it needs to be rendered on top of the American one.
- Then the shortest histogram of the Asian session along the X axis is rendered.
I would like to note how convenient it is to combine array data when using vectors:
//--- sum up all sessions for rendering
   vector total_profile=m_asia+m_europe+m_america;   // profile that combines all sessions
   vector europe_asia=m_asia+m_europe;               // profile that combines only the European and Asian sessions
Essentially, it is an element-by-element concatenation of multiple arrays of the same size into one resulting array, which can be represented by the following code:
#define SIZE   3

double array_1[SIZE]={0,1,2};
double array_2[SIZE]={3,4,5};
double array_3[SIZE]={6,7,8};

Print("Contents of three arrays:");
ArrayPrint(array_1);
ArrayPrint(array_2);
ArrayPrint(array_3);

for(int i=0; i<SIZE; i++)
  {
   array_1[i]+=array_2[i]+=array_3[i];
  }

Print("\nResult of the merge:");
ArrayPrint(array_1);
/*
Contents of three arrays:
0.00000 1.00000 2.00000
3.00000 4.00000 5.00000
6.00000 7.00000 8.00000

Result of the merge:
 9.00000 12.00000 15.00000
*/
The code below does the same thing as the line of code in the method discussed above:
vector total_profile=m_asia+m_europe+m_america; // profile that combines all sessions
I think it is unnecessary to say how much more convenient and concise the code is...
The created canvas object is deleted from the class destructor and the chart is redrawn to show the changes:
//+------------------------------------------------------------------+
//| Destructor                                                       |
//+------------------------------------------------------------------+
void CMarketProfile::~CMarketProfile(void)
  {
//--- delete all graphical objects after use
   ObjectsDeleteAll(0, m_prefix, 0, OBJ_BITMAP);
   ChartRedraw();
  }
Now, instead of drawing with graphical objects in the indicator loop, it is sufficient to create one instance of the considered class for each daily bar, calculate the data of all sessions and draw a market profile histogram for each day on the canvas. The number of graphical objects that will be created depends on the number of days specified in the profile display settings, unlike the previous version of the indicator, where each line of the histogram is drawn with its own graphical object.
Optimizing the indicator
Let's now see how the indicator is made using the Market Profile class. Let's open the indicator file \MQL5\Indicators\Free Indicators\MarketProfile Canvas.mq5 from the very beginning and study it.
First of all, the class files are included for simplified creation of custom CCanvas renderings, as well as the class file for creating strongly typed CArrayList<T> lists:
//+------------------------------------------------------------------+
//|                                         MarketProfile Canvas.mq5 |
//|                              Copyright 2009-2024, MetaQuotes Ltd |
//|                                             https://www.mql5.com |
//+------------------------------------------------------------------+
#property copyright "Copyright 2022, MetaQuotes Ltd."
#property link      "https://www.mql5.com"
#property version   "1.00"
#property indicator_chart_window
#property indicator_plots 0

#include <Canvas\Canvas.mqh>
#include <Generic\ArrayList.mqh>

//--- input parameters
Next come the list of inputs of the indicator, a unique prefix of graphical objects, declared market profile class and declared list of class objects:
//--- input parameters
input uint  InpStartDate       =0;           /* day number to start calculation */  // 0 - current, 1 - previous, etc.
input uint  InpShowDays        =7;           /* number of days to display */        // starting with and including the day in InpStartDate
input int   InpMultiplier      =1;           /* histogram length multiplier */
input color InpAsiaSession     =clrGold;     /* Asian session */
input color InpEuropeSession   =clrBlue;     /* European session */
input color InpAmericaSession  =clrViolet;   /* American session */
input uchar InpTransparency    =150;         /* Transparency, 0 = invisible */      // market profile transparency, 0 = fully transparent
input uint  InpEuropeStartHour =8;           /* European session opening hour */
input uint  InpAmericaStartHour=14;          /* American session opening hour */

//--- unique prefix to identify graphical objects belonging to the indicator
string ExtPrefixUniq;

//--- declare CMarketProfile class
class CMarketProfile;
//--- declare a list of pointers to objects of the CMarketProfile class
CArrayList<CMarketProfile*> mp_list;
Since the market profile class is written below the indicator code, class forward declaration is needed to avoid the error of unknown variable type during compilation
'CMarketProfile' - unexpected token
Strongly typed list will contain pointers to objects of CMarketProfile class type set below in the code.
In the OnInit() handler, create the prefix of graphical objects as the last 4 digits of the number of milliseconds that have passed since the system startup:
//+------------------------------------------------------------------+
//| Custom indicator initialization function                         |
//+------------------------------------------------------------------+
int OnInit()
  {
//--- create a prefix for object names
   string number=StringFormat("%I64d", GetTickCount64());
   ExtPrefixUniq=StringSubstr(number, StringLen(number)-4);
   Print("Indicator \"Market Profile Canvas\" started, prefix=", ExtPrefixUniq);

   return(INIT_SUCCEEDED);
  }
Let's look at the full code of the OnCalculate() handler:
//+------------------------------------------------------------------+
//| Custom indicator iteration function                              |
//+------------------------------------------------------------------+
int OnCalculate(const int rates_total,
                const int prev_calculated,
                const datetime &time[],
                const double &open[],
                const double &high[],
                const double &low[],
                const double &close[],
                const long &tick_volume[],
                const long &volume[],
                const int &spread[])
  {
//--- opening time of the current daily bar
   datetime static open_time=0;

//--- number of the last day for calculations
//--- (if InpStartDate = 0 and InpShowDays = 3, lastday = 3)
//--- (if InpStartDate = 1 and InpShowDays = 3, lastday = 4) etc ...
   uint lastday=InpStartDate+InpShowDays;

//--- if the first calculation has already been made
   if(prev_calculated!=0)
     {
      //--- get the opening time of the current daily bar
      datetime current_open=iTime(Symbol(), PERIOD_D1, 0);

      //--- if we do not calculate the current day
      if(InpStartDate!=0)
        {
         //--- if the opening time was not received, leave
         if(open_time==current_open)
            return(rates_total);
        }
      //--- update opening time
      open_time=current_open;
      //--- we will only calculate one day from now on, since all other days have already been calculated during the first run
      lastday=InpStartDate+1;
     }

//--- in a loop for the specified number of days (either InpStartDate+InpShowDays on first run, or InpStartDate+1 on each tick)
   for(uint day=InpStartDate; day<lastday; day++)
     {
      //--- get the data of the day with index day into the structure
      MqlRates day_rate[];
      //--- if the indicator is launched on weekends or holidays when there are no ticks, you should first open the daily chart of the symbol
      //--- if we have not received bar data for the day index of the daily period, we leave until the next call to OnCalculate()
      if(CopyRates(Symbol(), PERIOD_D1, day, 1, day_rate)==-1)
         return(prev_calculated);

      //---  get day start and end time
      datetime start_time=day_rate[0].time;
      datetime stop_time=start_time+PeriodSeconds(PERIOD_D1)-1;

      //--- get all intraday bars of the current day
      MqlRates bars_in_day[];
      if(CopyRates(Symbol(), PERIOD_CURRENT, start_time, stop_time, bars_in_day)==-1)
         return(prev_calculated);

      CMarketProfile *market_profile;
      //--- if the Market Profile has already been created and its drawing has been performed earlier
      if(prev_calculated>0)
        {
         //--- find the Market Profile object (CMarketProfile class) in the list by the opening time of the day with the 'day' index
         market_profile=GetMarketProfileByDate(ExtPrefixUniq, start_time);
         //--- if the object is not found, return zero to completely recalculate the indicator
         if(market_profile==NULL)
           {
            PrintFormat("Market Profile not found for %s. Indicator will be recalculated for all specified days",
                        TimeToString(start_time, TIME_DATE));
            return(0);
           }
         //--- CMarketProfile object is found in the list; set it to High and Low values of the day and pass the array of intraday bars
         //--- in this case, the object is shifted to a new coordinate corresponding to the High of the daily candle, and all arrays (vectors) are reinitialized
         market_profile.SetHiLoBars(day_rate[0].high, day_rate[0].low, bars_in_day);
        }
      //--- if this is the first calculation
      else
        {
         //--- create a new object of the CMarketProfile class to store the Market Profile of the day with 'day' index
         market_profile = new CMarketProfile(ExtPrefixUniq, start_time, stop_time, day_rate[0].high, day_rate[0].low, bars_in_day);
         //--- add a pointer to the created CMarketProfile object to the list
         mp_list.Add(market_profile);
        }
      //--- set canvas dimensions and line drawing parameters
      market_profile.UpdateSizes();
      //--- calculate profiles for each trading session
      market_profile.CalculateSessions();
      //--- draw the Market Profile
      market_profile.Draw(InpMultiplier);
     }
//--- redraw the chart after the loop has been completed and all objects have been created and updated
   ChartRedraw(0);

//--- return the number of bars for the next OnCalculate call
   return(rates_total);
  }
The handler logic is fully described in the comments to the code. In short, it is as follows:
- In a loop by the number of displayed market profile days;
- get into the structure the day corresponding to the loop index;
- get the number of bars of the current chart period included in the day selected in the loop;
- either get a previously created market profile object for the selected day, or create a new one if it is not yet in the list;
- get the size of the daily bar from Low to High in chart pixels and reinitialize the arrays (vectors) of trading sessions;
- in accordance with the new size of the bar of the selected day, we change the size of the canvas;
- re-calculate the market profile of the day for each session;
- redraw the profiles of each trading session on the canvas.
- At the end of the loop, redraw the chart.
In the indicator's OnDeinit() handler, delete all created graphical objects:
//+------------------------------------------------------------------+
//| Custom indicator deinitialization function                       |
//+------------------------------------------------------------------+
void OnDeinit(const int reason)
  {
//--- delete all Market Profile graphical objects after use
   Print("Indicator \"Market Profile Canvas\" stopped, delete all objects CMarketProfile with prefix=", ExtPrefixUniq);

//--- in a loop by the number of CMarketProfile objects in the list
   int size=mp_list.Count();
   for(int i=0; i<size; i++)
     {
      //--- get the pointer to the CMarketProfile object from the list by the loop index
      CMarketProfile *market_profile;
      mp_list.TryGetValue(i, market_profile);
      //--- if the pointer is valid and the object exists, delete it
      if(market_profile!=NULL)
         if(CheckPointer(market_profile)!=POINTER_INVALID)
            delete market_profile;
     }
//--- redraw the chart to display the result immediately
   ChartRedraw(0);
  }
In the OnChartEvent() event handler, change the canvas size of each day of the market profile:
//+------------------------------------------------------------------+
//| Custom indicator chart's event handler                           |
//+------------------------------------------------------------------+
void OnChartEvent(const int id, const long& lparam, const double& dparam, const string& sparam)
  {
//--- if this is a user event, leave
   if(id>=CHARTEVENT_CUSTOM)
      return;

//--- if there is a chart change, update the sizes of all objects of the CMarketProfile class with redrawing the chart
   if(CHARTEVENT_CHART_CHANGE==id)
     {
      //--- in a loop by the number of CMarketProfile objects in the list
      int size=mp_list.Count();
      for(int i=0; i<size; i++)
        {
         //--- get the pointer to the CMarketProfile object by the loop index
         CMarketProfile *market_profile;
         mp_list.TryGetValue(i, market_profile);
         //--- if the object is received and if it is in the visible area of the chart
         if(market_profile)
            if(market_profile.isVisibleOnChart())
              {
               //--- update canvas dimensions and redraw market profile histograms
               market_profile.UpdateSizes();
               market_profile.Draw(InpMultiplier);
              }
        }
      //--- update the chart after recalculating all Profiles
      ChartRedraw();
     }
  }
Since the scale of the chart display can be changed vertically and horizontally, graphical objects with trading session histograms should also be resized relative to the new chart sizes. Therefore, in the event handler, when the chart changes, all objects of the CMarketProfile class should be updated in size and redrawn on the canvas, which has received a new size in accordance with the new scale of the chart.
The function that returns a market profile object created for a specified day start time:
//+------------------------------------------------------------------+
//| Returns CMarketProfile or NULL by the date                       |
//+------------------------------------------------------------------+
CMarketProfile* GetMarketProfileByDate(string prefix, datetime time)
  {
//--- in a loop by the number of CMarketProfile objects in the list
   int size=mp_list.Count();
   for(int i=0; i<size; i++)
     {
      //--- get the pointer to the CMarketProfile object by the loop index
      CMarketProfile *market_profile;
      mp_list.TryGetValue(i, market_profile);
      //--- if the pointer is valid and the object exists,
      if(market_profile!=NULL)
         if(CheckPointer(market_profile)!=POINTER_INVALID)
           {
            //--- if the Market Profile object obtained by the pointer was created for the required time, return the pointer
            if(market_profile.Check(prefix, time))
               return(market_profile);
           }
     }
//--- nothing found - return NULL
   return(NULL);
  }
The function is used in the indicator loop by trading days and returns a pointer to the CMarketProfile class object from the list that was created for a daily bar with a certain day opening time. The function allows us to receive the required object by time for its further update.
Conclusion
We considered the possibility of optimizing the indicator code to reduce resource consumption. We got rid of thousands of graphical objects, replacing them with a single graphical object for a single day the market profile is rendered for.
As a result of the optimization, each trading day, in the amount specified in the settings (7 by default), is displayed on its own canvas (OBJ_BITMAP object), where three trading sessions are rendered in the form of histograms - Asian, European and American, each in its own color, specified in the settings. For three trading days, the market profile will ultimately look like this:
Here we have only three graphical objects, on which the histograms of trading sessions are drawn using the CCanvas class. We can clearly see that re-rendering of even three Bitmap graphical objects on the fly causes noticeable flickering and twitching of images. This suggests that there is still room for further code optimization. In any case, now, instead of several thousand graphical objects, we have only three. This gives a noticeable gain in resource consumption. Visual artifacts can be corrected by further analysis of the code (remember, for example, the unimplemented isChartScaleChanged() method of the CMarketProfile class allowing us to redraw only at the moment of a real change in the scale of the chart).
To sum up, we can say with confidence that any code can always be optimized. Although this might require resorting to a different concept of constructing the visual component, as is done in this indicator.
The article comes with a fully commented indicator file that you can download and study yourself, and if you wish, continue optimizing it.
Translated from Russian by MetaQuotes Ltd.
Original article: https://www.mql5.com/ru/articles/16579
Warning: All rights to these materials are reserved by MetaQuotes Ltd. Copying or reprinting of these materials in whole or in part is prohibited.
This article was written by a user of the site and reflects their personal views. MetaQuotes Ltd is not responsible for the accuracy of the information presented, nor for any consequences resulting from the use of the solutions, strategies or recommendations described.

- Free trading apps
- Over 8,000 signals for copying
- Economic news for exploring financial markets
You agree to website policy and terms of use
Why not write a perfect volume profile
What is meant by "perfect"?
Why not write the perfect volume profile
This is an interesting topic. I also switched to Canvas to display my profile. But this method has some disadvantages. If graphical figures are "drawn and forgotten", mt5 will scale them by itself when moving the chart, changing the TF, etc. actions, then Canvas should be redrawn always, at any CHARTEVENT_CHART_CHANGE, even if VP is somewhere in history, on already unchanged data. And these data must be obtained and not always they (tick data) are in the mt5 cache, here either store the memory and check if the VP boundaries have changed or constantly request from mt5 (now I have it so implemented), which does not work quickly and so the data is not always given completely, and not immediately for sure.
Drawing is one part of the issue. The second part is that a trader does not always need only a picture to admire it, he needs signals based on this picture, such as POC, VHL, VLL, "entry into the void", etc. And we can bind events only to graphical objects (conditionally, we can keep them in an array somewhere in the indicator, but it is still desirable to visualise where this level is, where the alert was triggered). That is, we still need graphical objects to the kanvas VP, although of course they will be an order or even several orders of magnitude less than in the case of displaying VP through graphical objects.
In general, the summary is as follows - we can't get a volumetric terminal from mt5 (yet?) (and we need clusters, deltas, etc.).
The picture is an example of how VP looks like on an impulse wave, POC is shown by a line, here are tick volumes, if there were real volumes I would work on them (finam, amp global). As the practice of comparing tick and real volumes on senior TFs has shown, they either coincide or are very close to each other, except for cases of large volumes passing through the high or low candles, here tick volumes are powerless to help us.
This is an interesting topic. I also switched to Canvas to display my profile. But this method has some disadvantages. If graphical figures are "drawn and forgotten", mt5 will scale them by itself when moving the chart, changing the TF, etc. actions, then Canvas should be redrawn always, at any CHARTEVENT_CHART_CHANGE, even if VP is somewhere in history, on already unchanged data. And this data must be obtained and not always they (tick data) are in the mt5 cache, here either store the memory and check if the VP boundaries have changed or constantly request from mt5 (now I have it so implemented), which does not work quickly and the data is not always given completely, and not immediately for sure.
Drawing is one part of the issue. The second part is that a trader does not always need only a picture to admire it, he needs signals based on this picture, such as POC, VHL, VLL, "entry into the void", etc. And we can bind events only to graphical objects (conditionally, we can keep them in an array somewhere in the indicator, but it is still desirable to visualise where this level is, where the alert was triggered). I.e. we still need graphical objects to the canvas VP, although of course they will be an order or even several orders of magnitude less than in the case of displaying VP through graphical objects.
In general, the summary is as follows: we can't get a volumetric terminal from mt5 (yet?) (and we need clusters, deltas, etc.).
The picture is an example of how VP looks like on an impulse wave, POC is shown by a line, here are tick volumes, if there were real volumes I would work on them (finam, amp global). As the practice of comparing tick and real volumes on senior TFs has shown, they either coincide or are very close to each other, except for cases of large volumes passing through the high or low candles, here tick volumes are powerless to help us.
It's not exactly like that. These are not disadvantages, but features that you need to know in order to use the tool with maximum possibilities and freedom of action.
Everything can be done, even though 3D clusters.
Here is an MQL5 example using only Canvas without using OpenCL. If you use OpenCL (i.e. a graphics card), you can achieve significant speedup (dozens of times).