
The MQL5 Standard Library Explorer (Part 7): Interactive Position Labeling with CCanvas

Contents:
Introduction
Welcome to this part of the series exploring the MQL5 Standard Library. I hope each episode has offered something useful or inspiring along the way. As you progress, you quickly realize that MQL5 programming is a journey built from countless building blocks—there is always something new to learn, refine, and discover. Ultimately, all of this effort serves a single goal: equipping traders with efficient, reliable, and well-designed trading tools.
In this part, we address a common usability gap between the chart window and the Trade tab in the MetaTrader 5 toolbox. Positions are typically managed from the toolbox, where they often appear alongside other orders and trades, making it difficult to focus on a specific position in real time. To solve this, we introduce on-chart position labeling. By associating each open position with a visual label placed directly on the chart, you can immediately relate an order to current price action and market structure. This improves clarity, accelerates decision-making, and allows you to determine whether a position should be closed or held based on live market conditions.
This article follows the previous discussion on optimizing Wizard-generated Expert Advisors, but with a deliberate shift in focus. Rather than diving deeper into optimization at this stage, we step back and return to simplicity to strengthen learning. Parts 4, 5, and 6 provided a foundation for working with the Wizard and its available modules, offering a practical starting point for building Expert Advisors with minimal coding. While optimization naturally raises many questions—and remains a significant topic—it is broad enough to deserve dedicated attention later in the series, where we will explore it in greater depth.
In the next section, we focus on understanding the core concept behind today’s discussion before moving into implementation. This conceptual layer is the most critical part of the article, as it frames how the solution works and why it matters. Please take the time to absorb it fully before continuing to the implementation section.
Concept
In MetaTrader 5, positions are most commonly managed from the Trade tab in the Toolbox window. As the number of open positions and pending orders grows, this list-based approach can quickly become cluttered and less intuitive. More importantly, critical contextual information—such as surrounding market structure and price behavior at the time of entry—remains visually disconnected from the position itself.
While MetaTrader 5 already provides some basic on-chart position management features, these are limited in scope. You can see entry levels, order type, lot size, and order price directly on the chart, as illustrated in the diagram below.
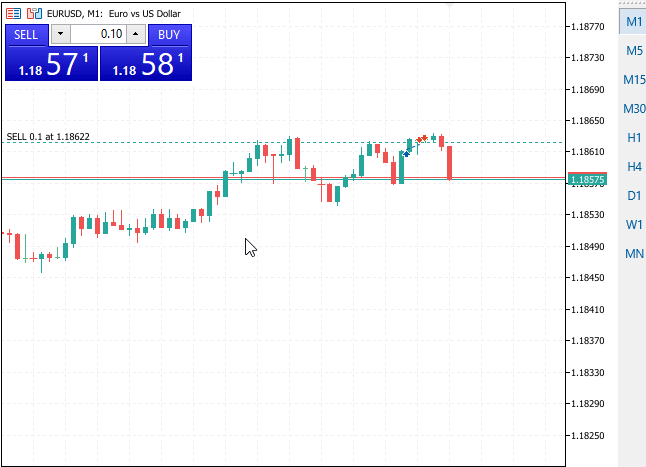
Fig. 1. Default position management on the chart
In Fig. 1, the chart displays the position’s entry level along with its type and volume, while price continues to update on the right axis in real time. However, one essential element is missing: clear, dynamic profit and loss visualization at the position level. In addition, the default on-chart elements offer little flexibility in terms of styling and provide no direct, intuitive way to quickly close a position from the chart itself. Although closing trades is possible through the right mouse button click menu and the Trade tab, our focus here is on maximizing what the chart alone can offer.
These limitations highlight an opportunity for improvement—one that can be addressed using the MQL5 Standard Library. By extending the chart with custom, interactive visual elements, we can bridge the gap between trade data and price action. In the next section, we introduce a conceptual solution that brings position information, real-time profit feedback, and direct access to quickly close the order. Although it is available in the trade tab, we are focusing on what the chart can offer for now. Below I share our conceptual solution to this problem.

Fig. 2. Conceptual Position Info Floating Bubble
In Fig. 2, we conceptualize the position labeling technique using graphical callout bubbles to illustrate how order tickets and real-time profit or loss can be presented directly on the chart. Instead of relying solely on the Trade tab, positions are visualized as interactive bubbles anchored to their corresponding price and time, allowing you to assess market structure and trade performance at a glance.
This conceptual design shifts position management from a detached list into the trading context itself. By tying each position visually to its entry point, we gain immediate insight into how price is behaving relative to the trade, making evaluation and decision-making faster and more intuitive.
The system is organized into three high-level layers. The strategy logic layer determines when and how positions are opened. The visualization layer is responsible for rendering position information on the chart using clear, informative graphics. Finally, the interaction layer enables direct user input, allowing you to manage positions through simple mouse actions.
Together, these layers demonstrate how trading logic, chart visualization, and user interaction can be orchestrated seamlessly using the MQL5 Standard Library, forming the foundation for more advanced and intuitive trading tools in future implementations.
Standard Library Components Covered
By following this discussion, you will get familiar with several key MQL5 Standard Library files and their roles in the project:
- Canvas—for creating custom graphics, drawing shapes, text, and interactive elements
- PositionInfo—for reading live position data such as ticket number, open price, and profit
- Trade—for executing and closing trades programmatically
- Trend—for building and accessing moving average indicators as part of the strategy
Further details of how each of these modules is used and combined will be explored in the implementation section, where the full code brings these concepts to life.
Implementation
In this section, we move from concept to implementation. The goal is not to build a sophisticated trading strategy, but to demonstrate how multiple components of the MQL5 Standard Library can be combined into a coherent, interactive system.
Throughout this walkthrough, keep in mind that every class we use here is reusable well beyond this project. The Interactive Position Labeler is simply the vehicle that allows us to explore these components in a practical, visual, and intuitive way in this context.
In every MQL5 program, the very first thing the compiler encounters is metadata, not functionality. This header section defines what the program is, not what it does. Properties such as the file name banner, copyright, version, and description act as formal identification. They are used by MetaTrader to display information in the Navigator, Strategy Tester, and logs.
//+------------------------------------------------------------------+
//|                              Part7_InteractivePositionLabeler.mq5|
//|                        Copyright 2025, MQL5 Standard Lib Explorer|
//|                                             https://www.mql5.com |
//+------------------------------------------------------------------+
#property copyright "Clemence Benjamin"
#property version   "1.00"
#property description "Interactive Position Info Bubbles with MA Cross Strategy"
Only after this metadata block do we begin assembling the building blocks of the program by including files from the Standard Library. This ordering is not just stylistic; it reflects a clean mental model: first we define who the program is, then we decide what capabilities it needs. The #include directives pull in ready-made classes that live inside the MQL5 installation’s mother directory—the MQL5\Include\ folder. Understanding this root location is crucial, because nearly all standard library components branch out from it into well-organized subfolders such as Trade, Canvas, Indicators, Controls, and many more.
1. Including the Standard Library:
We start by assembling its tools as shown in the code below. Instead of writing raw code for drawing pixels or placing trades, we import specialized classes from the Standard Library.
//--- 1. INCLUDES
#include <Canvas\Canvas.mqh>       // For drawing custom graphics
#include <Trade\PositionInfo.mqh>  // For reading trade details
#include <Trade\Trade.mqh>         // For executing trades
#include <Indicators\Trend.mqh>    // For Moving Averages
These four headers define the entire scope of the application. Each one represents a specific domain handled by the Standard Library:
| Library File | Description |
|---|---|
| Canvas: | Provides the CCanvas class for pixel-level drawing directly on the chart. This is the core visual engine of the project and enables custom shapes, transparency, text rendering, and interactive overlays that go beyond standard chart objects. |
| PositionInfo: | Exposes the CPositionInfo class, which acts as a stateful wrapper around open positions. Instead of repeatedly querying individual position properties, the system selects a position once and works with it as an object. |
| Trade: | Contains the CTrade class, a high-level interface for executing and managing trades. It abstracts order tickets, execution results, and error handling, allowing the strategy logic to remain concise and readable. |
| Trend: | Hosts indicator classes such as CiMA. These classes unify indicator handling under a consistent API (Create → Refresh → Main), making it easy to extend or replace indicators without restructuring the strategy code. |
At this stage, we are already seeing a key Standard Library idea: each class solves a specific problem domain and integrates cleanly with others.
2. Inputs & Globals: Letting the Library Do the Heavy Lifting
We define an enumeration that allows us to switch between multiple bubble geometries. By abstracting shapes into an enum, we avoid hard-coding layout logic and make the rendering system extensible.
Then, we declare input parameters, separating strategy configuration from visual configuration. This separation ensures that visual experimentation does not interfere with trading logic.
//--- 2. INPUTS
enum EnumBubbleShape
  {
   SHAPE_ROUNDED_RECT,
   SHAPE_CIRCLE,
   SHAPE_TRIANGLE
  };

input group "Strategy Settings"
input int             InpFastMA = 10;               // Fast MA Period
input int             InpSlowMA = 20;               // Slow MA Period
input int             InpSL     = 300;              // Stop Loss (Points)
input int             InpTP     = 600;              // Take Profit (Points)

input group "Visual Settings"
input EnumBubbleShape InpShape  = SHAPE_TRIANGLE;   // Default to test layout logic

//--- 3. GLOBAL OBJECTS
CCanvas           ExtCanvas;       // The drawing canvas
CPositionInfo     ExtPosition;     // Position reader
CTrade            ExtTrade;        // Execution module
CiMA              ExtFastMA;       // Fast Moving Average
CiMA              ExtSlowMA;       // Slow Moving Average
Instead of manually calculating moving averages, we rely on the CiMA objects to handle buffering and recalculation. These objects are declared globally because they represent persistent system components:
- CTrade maintains execution context (like magic numbers).
- CPositionInfo acts as a movable cursor over positions.
- CCanvas represents a long-lived drawing surface (re-creating it every tick would kill performance).
3. The Hitbox Structure: Enabling Interaction
Since the canvas has no native notion of buttons, we define our own hitbox structure. This allows us to map pixel coordinates to the trade tickets.
Each time we draw a close button, we register its clickable region. Later, we will evaluate mouse clicks against these bounds.
//--- HITBOX STRUCTURE (For Mouse Clicks)
struct BubbleHitbox
  {
   ulong    ticket;
   int      x1, y1, x2, y2;
  };
BubbleHitbox ExtHitboxes[]; // Dynamic array to store clickable areas
This simple struct allows us to map a visual rectangle (coordinates x1.y1 to x2.y2) to a specific trading ticket. This pattern—separating the visual representation from the logic area—is reusable for buttons, sliders, or any custom control you might build in the future.
4. Initialization: Preparing the Components
When the Expert Advisor starts, the OnInit() function acts as the boot sequence for the entire system. Everything inside this function runs only once, and its responsibility is to ensure that all required components are successfully created before the EA is allowed to operate. If any critical subsystem fails during this phase, the function exits early, and the EA never enters its runtime state.
int OnInit()
  {
The first operation initializes the fast moving average indicator. At this point, it is not calculating values yet; instead, it requests MetaTrader 5 to allocate an indicator handle and bind it to the current symbol and timeframe. The indicator is configured as a simple moving average applied to closing prices. If the platform fails to create the indicator for any reason, initialization is aborted immediately to prevent undefined strategy behavior.
   if(!ExtFastMA.Create(_Symbol, _Period, InpFastMA, 0, MODE_SMA, PRICE_CLOSE))
      return(INIT_FAILED);
Immediately after, the slow-moving average is created in the same manner. By performing this step during initialization, we guarantee that both indicators exist and are ready to be refreshed later during live execution. As with the fast average, a failure here stops the EA before it can run in an incomplete state.
   if(!ExtSlowMA.Create(_Symbol, _Period, InpSlowMA, 0, MODE_SMA, PRICE_CLOSE))
      return(INIT_FAILED);
Once the strategy indicators are in place, the chart is configured to forward mouse-related events to the EA. This enables the program to receive detailed user interaction data, such as mouse movement and clicks, through the OnChartEvent() handler. This step is essential for any interactive chart interface built on a canvas, as it allows graphical elements to respond to user input.
ChartSetInteger(0, CHART_EVENT_MOUSE_MOVE, true);
The next block creates the canvas that will host all visual elements. A bitmap label is allocated and positioned at the top-left corner of the chart, with its width and height matched exactly to the chart’s pixel dimensions. This bitmap acts as an off-screen rendering surface, allowing us to draw shapes, text, and UI components efficiently. The ARGB color format enables transparency, ensuring that the visuals blend naturally with the chart background. If the bitmap cannot be created, initialization fails because the EA relies on this canvas for its interactive display.
   if(!ExtCanvas.CreateBitmapLabel("TradeBubblesCanvas", 0, 0,
                                   (int)ChartGetInteger(0, CHART_WIDTH_IN_PIXELS),
                                   (int)ChartGetInteger(0, CHART_HEIGHT_IN_PIXELS),
                                   COLOR_FORMAT_ARGB_NORMALIZE))
      return(INIT_FAILED);
After the canvas is successfully created, the default font used for all text rendering is configured. By setting the font once during initialization, every subsequent text draw call automatically uses the same font and size. This approach improves performance and ensures visual consistency across all rendered elements.
ExtCanvas.FontSet("Calibri", 16);
Finally, the function signals successful initialization. At this point, all required systems—indicators, chart events, and the rendering surface—are fully prepared. Returning INIT_SUCCEEDED allows MetaTrader to transition the EA into its active state, where it can begin receiving ticks and chart events.
   return(INIT_SUCCEEDED);
  }
Notice the COLOR_FORMAT_ARGB_NORMALIZE flag in the canvas creation. This is critical. It tells the standard library to support the alpha channel (transparency). Without this, our layer would be solid black, obscuring the price chart entirely.
5. OnTick(): Separating Strategy From Visualization
When a new market tick arrives, the EA executes the OnTick() function, which orchestrates all subsequent actions. This function is responsible for evaluating the trading strategy and managing visual updates efficiently. In this process, the EA continuously monitors market conditions, checks existing positions, and determines whether to draw on the chart or execute trades.
At the beginning of each tick, the EA updates its moving average indicators to ensure it is working with the latest market data. This immediate refresh guarantees that any subsequent price or crossover evaluations are based on current values rather than outdated information.
Next, the EA checks for open positions. If none are found, it proceeds to evaluate whether a new trade should be entered. This is managed internally by calling PositionsTotal() to enforce a single-position rule—preventing overlapping trades and controlling risk.
The EA also assesses its execution environment before drawing anything. If it is running in the Strategy Tester without visual mode enabled, it skips rendering altogether to conserve resources.
For visual updates, the EA uses an internal timer to regulate the frame rate. On each tick, it compares the current system time to the timestamp of the last visual refresh. A new drawing routine is only triggered after a set interval, maintaining a balance between smooth visuals and performance—typically around 30 frames per second.
//+------------------------------------------------------------------+
//| Expert tick function (SPEED OPTIMIZED)                           |
//+------------------------------------------------------------------+
void OnTick()
  {
   // --- PRIORITY 1: STRATEGY (Always Run) ---
   // We never skip this. The EA must react to every price change instantly.
   ExtFastMA.Refresh(-1);
   ExtSlowMA.Refresh(-1);

   if(PositionsTotal() == 0)
     {
      CheckStrategy();
     }

   // --- PRIORITY 2: VISUALS (Throttled) ---

   // Optimization A: If running a backtest WITHOUT visual mode, skip drawing completely.
   if(MQLInfoInteger(MQL_TESTER) && !MQLInfoInteger(MQL_VISUAL_MODE)) return;

   // Optimization B: Frame Rate Limiter (Max 30 FPS)
   static uint last_render_time = 0;
   uint current_pc_time = GetTickCount();

   if(current_pc_time - last_render_time > 30)
     {
      DrawBubbles();
      last_render_time = current_pc_time;
     }
  }
By throttling the rendering to ~30 frames per second using GetTickCount(), we allow the trading logic to run at maximum speed while keeping the CPU usage low. This pattern is transferable to any dashboard or panel you build.
6. Strategy Logic: Using Indicator Classes
The strategy itself is simple, designed only to generate positions for us to visualize.
void CheckStrategy()
  {
   // Request indicator values through the library API
   double fast0 = ExtFastMA.Main(0);
   double fast1 = ExtFastMA.Main(1);
   double slow0 = ExtSlowMA.Main(0);
   double slow1 = ExtSlowMA.Main(1);

   // ... (Symbol Info & Trade Logic) ...

   // Example: Golden Cross
   if(fast1 < slow1 && fast0 > slow0)
     {
      double sl = ask - (InpSL * point);
      double tp = ask + (InpTP * point);
      // Clean execution using CTrade
      ExtTrade.Buy(0.10, _Symbol, ask, sl, tp, "MA_Cross_Buy");
     }
   // ... (Sell Logic Symmetrical) ...
  }
We use ExtFastMA.Main(index) to access buffer values cleanly. This abstraction prevents the common "array out of range" errors associated with raw arrays.
7. Drawing Layer: From Market Data to Screen Pixels
This function bridges the gap between trading data (Time/Price) and visualization (X/Y Pixels).
void DrawSingleBubble()
  {
   // ... (Get Position Data) ...

   int x, y;
   // Convert Market Info to Screen Pixels
   // This function aligns graphics with candles during scrolling
   if(!ChartTimePriceToXY(0, 0, time, open_price, x, y)) return;

   // ... (Color and Shape Logic) ...

   // Example: Drawing the Text
   ExtCanvas.TextOut(text_x_final, text_y_final, text, text_color, text_align_final);

   // Example: Registering the Hitbox for the "X" button
   int new_idx = ArraySize(ExtHitboxes);
   ArrayResize(ExtHitboxes, new_idx + 1);
   ExtHitboxes[new_idx].ticket = ticket;
   ExtHitboxes[new_idx].x1 = btn_x1_final;
   // ... (Save coordinates) ...
  }
The ChartTimePriceToXY function is vital. It converts the trade's open price into pixel coordinates. Once converted, the CCanvas API takes over to draw shapes, blend colors, and render text. Note that we immediately save the button's location into ExtHitboxes while drawing it.
8. Interaction Layer: Making Graphics Clickable
Finally, we connect user input to library actions.
//+------------------------------------------------------------------+
//| Chart Event Handler (Clicks & Scrolls)                           |
//+------------------------------------------------------------------+
void OnChartEvent(const int id, const long &lparam, const double &dparam, const string &sparam)
  {
   // Handle Resizing/Scrolling
   if(id == CHARTEVENT_CHART_CHANGE)
     {
      ExtNeedResize = true;
      DrawBubbles();
     }

   // Handle Clicks
   if(id == CHARTEVENT_CLICK)
     {
      int mouse_x = (int)lparam;
      int mouse_y = (int)dparam;

      for(int i = 0; i < ArraySize(ExtHitboxes); i++)
        {
         // Check if click is inside a button's hitbox
         if(mouse_x >= ExtHitboxes[i].x1 && mouse_x <= ExtHitboxes[i].x2 &&
            mouse_y >= ExtHitboxes[i].y1 && mouse_y <= ExtHitboxes[i].y2)
           {
            Print("Interactive Close: Ticket #", ExtHitboxes[i].ticket);
            // Use Standard Library to close the specific ticket
            ExtTrade.PositionClose(ExtHitboxes[i].ticket);
            DrawBubbles();
            return;
           }
        }
     }
  }
By handling CHARTEVENT_CLICK, we complete the loop:
- User Input: Click detected.
- Visual Logic: Check ExtHitboxes to see if a button was pressed.
- Trade Execution: Use ExtTrade.PositionClose to execute the command.
This interaction model turns a static chart into a dynamic trading tool.
Testing and Results
Now that we have built the system, it is time to see it in action. Open the Strategy Tester in MetaTrader 5 and select Part7_InteractivePositionLabeler.ex5. Make sure Visual mode with the display of charts is enabled before clicking Start.
Because this feature relies on real-time chart rendering and mouse interaction, optimization must be disabled during testing. Always use a single visual run in the Strategy Tester when validating interactive components such as Canvas-based labels and buttons.
As the Expert Advisor executes the moving average crossover strategy, you will see custom labels appear instantly next to every new position. These labels update their profit values and colors in real time as prices move.
To test the interactivity, on a live chart, simply hover over the red X button on any label and click it. The associated trade will close immediately, and the label will vanish from the chart.
Explore the screenshots below to see my test results in action.

Fig. 3. Testing on a live chart

Fig. 4. Testing in Strategy Tester Visualization
The complete, compilable source code for this project is attached at the end of this article. Download it, compile it, and start exploring the power of the MQL5 Standard Library.
Conclusion
In this part of the MQL5 Standard Library Explorer series, we have successfully built an interactive position labeler EA that merges strategy logic with dynamic chart visualization. We defined and initialized global objects for indicators, the canvas, and trade management, learning how to access open positions as objects through CPositionInfo, execute trades efficiently with CTrade, and calculate moving averages using CiMA from the Trend library. At the same time, we explored CCanvas for pixel-level drawing, creating interactive bubbles that display position information and respond to clicks directly on the chart.
Through this project, we shared experiences on how the MQL5 Standard Library provides a consistent, high-level interface for multiple aspects of trading applications. We learned to manage resources efficiently, throttle rendering to maintain performance, and handle chart events to make your visualizations interactive. Beyond this EA, you can use the same approach to label any position on the chart, even those opened manually or by other EAs, because no magic number was used in this context.
You are welcome to test this feature on your account or a demo environment, experiment with different bubble shapes, indicator settings, and multiple symbols, and observe how the canvas and interactive logic respond.
Your experiences and ideas are valuable, so please share your thoughts in the comments section. This feedback will help guide the next part of the series, where we will continue to explore more in-depth capabilities of the MQL5 Standard Library. Until then, happy coding and chart exploration!
Attachments
| Source File Name | Description: |
|---|---|
| Part7_InteractivePositionLabeler.mq5 | The complete source code for the Interactive Position Labeler EA, featuring the MA Cross strategy and CCanvas integration. |
Warning: All rights to these materials are reserved by MetaQuotes Ltd. Copying or reprinting of these materials in whole or in part is prohibited.
This article was written by a user of the site and reflects their personal views. MetaQuotes Ltd is not responsible for the accuracy of the information presented, nor for any consequences resulting from the use of the solutions, strategies or recommendations described.

- Free trading apps
- Over 8,000 signals for copying
- Economic news for exploring financial markets
You agree to website policy and terms of use