
From Novice to Expert: Automating Intraday Strategies

Contents:
- Introduction
- Conceptual Research & Market Observation
- Implementation
- Testing
- Conclusion
- Key Lessons
- Attachments
Introduction
Intraday trading refers to opening and closing trades within the same trading day. In simple language, it means we are not interested in long-term investing or holding positions overnight. Instead, we aim to capture shorter market movements—often within minutes or hours.
Because intraday trading operates in a fast environment, traders require consistent decision-making. Emotional delay or hesitation often leads to missed entries, early exits, or late reactions. This is where automation becomes powerful.
One widely used intraday concept is the moving average bounce. In trending markets, price often pulls back toward a dynamic mean before continuing in the direction of the trend. The moving average acts as a dynamic support in uptrends and dynamic resistance in downtrends.
Among various periods, the 50-period moving average has become a popular institutional reference. It is not too fast to be noisy like MA 10 or MA 20, and not too slow like MA 200. It strikes a balance between reactivity and structure. For intraday frameworks, this balance makes it ideal.
Although this article centers around MA 50, the final system will allow customization of the moving average period. Flexibility ensures adaptability across timeframes and trading styles.
Conceptual Research & Market Observation
Before writing code, I performed a manual chart walk-back study. This is an important step many developers skip. By manually scrolling back through historical charts, candle by candle, we observe how price truly behaves around the MA 50.
What we discovered is crucial: there is no single rigid bounce pattern.
Sometimes the bounce appears as a clean pin bar. The tail pierces through or rests precisely on the MA 50 before the price rejects and closes strongly in the trend direction.
Other times, the bounce forms through classical reversal structures:
- Double bottom around MA 50 in an uptrend.
- Double top around MA 50 in a downtrend.
- Engulfing candle formations at the MA level.
- Inside bar breakout occurring after MA contact.
In several cases, price slightly breaks the moving average, forms a minor structure, and then returns for a second test—creating a two-leg retest before continuation.
This variability reveals something important: the bounce is not a candle pattern—it is a behavior cluster.
Therefore, automation must not be overly rigid. If we code only a single pin-bar condition, we will miss many valid bounces. If we code only engulfing logic, we ignore structural retests.
The strategy must therefore abstract the idea of “reaction” rather than focus on one candle formation.
Repeated Bounce Probability Observation
Another powerful discovery emerged from manual study: when price has previously respected MA 50 in a trend, the next interaction often shows a higher probability of reaction.
In other words, if price once bounced cleanly from MA 50 during a trend, the next time price returns to that moving average, the market participants are more likely to defend it again.
This is not guaranteed. It is probabilistic. But probability is the foundation of trading.
This repeated-defense behavior suggests we can introduce a contextual filter:
- Has MA 50 recently acted as support/resistance?
- Was the previous reaction strong?
- Is the trend still intact?
The images below (Fig. 1 and Fig. 2) visually demonstrate the ideas:
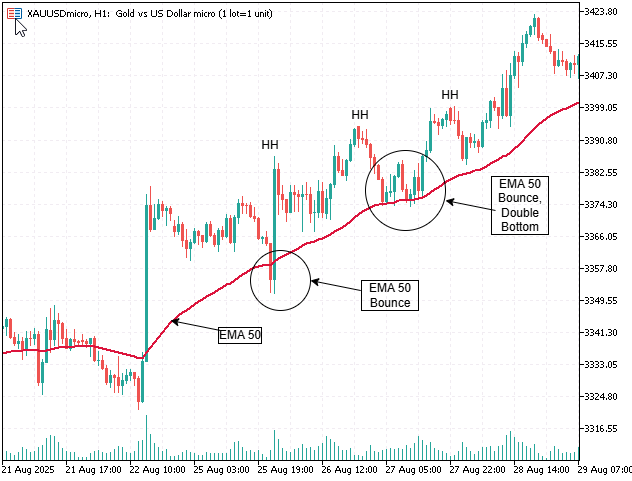
Fig. 1. Double bottom formations around EMA 50, second-leg retest behavior, and higher probability when previous bounce occurred
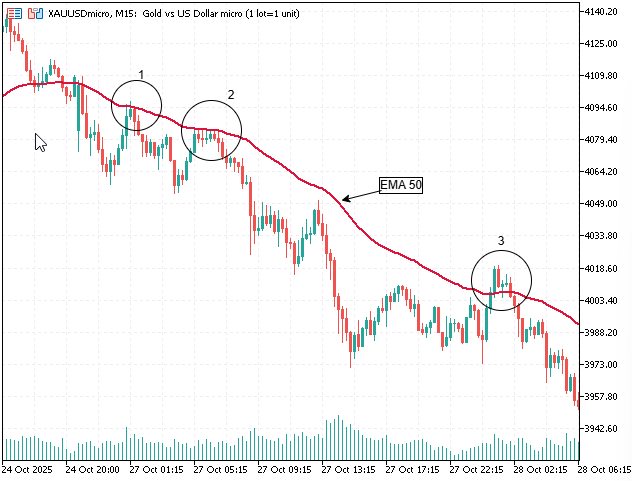
Fig. 2. Bearish EMA 50 bounce
Implementation
Now we translate research into structure.
The first step is trend qualification:
- Price above MA 50 → bullish bias.
- Price below MA 50 → bearish bias.
Second step: detect EMA interaction using candle mechanics:
- Bullish interaction: candle pierces EMA and closes above.
- Bearish interaction: candle pierces EMA and closes below.
This removes dependence on exact proximity and builds a behavior-first core engine.
Third step: reaction confirmation. Flexible conditions include:
- Bullish or bearish close after EMA contact.
- Break of minor swing high/low after retest.
- Pin bar rejection exceeding body size ratio.
- Second-leg confirmation after initial reaction.
Fourth step: repeated-defense filter. Track previous bounce events; allow higher probability entries if EMA acted as support/resistance recently.
MQL5 implementation involves:
- Creating MA handle via iMA()
- Using CopyBuffer() for historical EMA values
- Analyzing OHLC candle structures
- Tracking previous bounce events via flags
- Executing trades using the CTrade class
Modular components include:
- CheckTrend()
- CheckEMAInteraction()
- CheckReaction()
- CheckPreviousBounce()
- ExecuteTrade()
- ManageRisk()
Future expansion modules can include:
- Multi-timeframe confirmation
- ATR-based dynamic stops
- Break-even automation
- Trailing stop logic
Detailed Code Explanation
In this section, we explain the Expert Advisor line by line and section by section, describing what we declare, why we declare it, and how each structural block contributes to the overall architecture.This explanation follows the natural flow of the program—from initialization to execution—exactly as the MetaTrader 5 terminal processes it.
1. Property Declarations and Trade ObjectAt the very top of the file, we define metadata and enforce strict compilation rules
We declare:- #property strict to enforce modern MQL5 syntax standards.
- #property version to track EA evolution.
- #property description to document the purpose of the program.
Immediately after that, we include the trade library and instantiate a CTrade object. This object will handle all trade operations, such as buy and sell orders. Instead of manually building trade requests, we rely on the standardized CTrade class for cleaner execution handling.
#property strict
#property version   "2.00"
#property description "EMA 50 Bounce EA using Candle Interaction Logic"

#include <Trade/Trade.mqh>
CTrade trade;
This section establishes the environment and prepares our trading interface.
2. Input Parameters—User Configuration Layer
Next, we declare all input parameters. These are external variables that allow the user to modify strategy behavior without editing the source code.
We divide inputs into logical categories:
Moving Average Configuration
We declare:
- InpMAPeriod for the EMA length.
- InpPrice for the applied price type.
input int      InpMAPeriod        = 50;
input ENUM_APPLIED_PRICE InpPrice = PRICE_CLOSE;
This allows the strategy to remain flexible beyond EMA 50 if needed.
Risk and Position Management
We declare:
- Fixed lot size (InpLotSize)
- Optional percentage risk mode (UseRiskPercent)
- Risk percentage value (RiskPercent)
input double   InpLotSize         = 0.10;
input bool     UseRiskPercent     = false;
input double   RiskPercent        = 1.0;
This dual-mode risk system allows either static sizing or dynamic capital-based risk management.
Stop and Target Parameters
We declare stop-loss and take-profit distances in points:
input int      StopLossPoints     = 300;
input int      TakeProfitPoints   = 600;
These values are later converted into price offsets using _Point.
Optional Behavioral Filters
We then declare toggleable logic components:
input bool     UseTolerance       = false;
input int      TolerancePoints    = 50;

input bool     RequireSecondLeg   = false;
input bool     UsePinBarFilter    = false;
input bool     UseDoubleStructure = false;
These flags allow modular expansion of the strategy without changing the core EMA interaction logic.
This completes the configuration layer.
3. Global Variables
We declare global variables used throughout the EA lifecycle.
int    maHandle;
double maBuffer[];

bool   previousBounceDetected = false;
- maHandle stores the indicator handle returned by iMA().
- maBuffer[] stores EMA values copied from the indicator buffer.
- previousBounceDetected is reserved for contextual expansion (repeated defense logic).
4. Initialization—OnInit()
When the EA loads, OnInit() executes first.
Here we create the EMA indicator handle:
We specify:- Symbol
- Timeframe
- Period
- Shift (0)
- Mode (MODE_EMA)
- Applied price
If the handle fails, we return INIT_FAILED.
We then set the array as a series:
ArraySetAsSeries(maBuffer,true);
This reverses indexing so that index [0] represents the current candle—consistent with MQL5 time series logic.
int OnInit()
{
   maHandle = iMA(_Symbol,_Period,InpMAPeriod,0,MODE_EMA,InpPrice);

   if(maHandle == INVALID_HANDLE)
      return(INIT_FAILED);

   ArraySetAsSeries(maBuffer,true);

   return(INIT_SUCCEEDED);
}
Initialization prepares our indicator infrastructure.
5. Deinitialization—OnDeinit()
When the EA is removed, we release the indicator handle:
void OnDeinit(const int reason)
{
   if(maHandle != INVALID_HANDLE)
      IndicatorRelease(maHandle);
}
This prevents memory leakage and ensures proper resource cleanup.
6. Main Execution Loop—OnTick()
OnTick() runs every market tick.
However, we intentionally restrict logic to new bars only.
if(!IsNewBar())
   return;
This prevents intra-candle noise and over-triggering.
We then copy EMA data:
if(CopyBuffer(maHandle,0,0,3,maBuffer) <= 0)
   return;
We ensure valid data retrieval before continuing.
Next, we prevent duplicate positions:
if(PositionSelect(_Symbol))
   return;
Finally, we call the core logic.
CheckForSetup();
Full block:
void OnTick()
{
   if(!IsNewBar())
      return;

   if(CopyBuffer(maHandle,0,0,3,maBuffer) <= 0)
      return;

   if(PositionSelect(_Symbol))
      return;

   CheckForSetup();
}
7. Core Logic—CheckForSetup()
This function contains the behavioral engine.
We first retrieve EMA and OHLC values:
double ema = maBuffer[1];
double open1  = iOpen(_Symbol,_Period,1);
double close1 = iClose(_Symbol,_Period,1);
double high1  = iHigh(_Symbol,_Period,1);
double low1   = iLow(_Symbol,_Period,1);
We determine trend bias using the previous candle close:
bool bullishTrend = close2 > ema;
bool bearishTrend = close2 < ema;
Then we define EMA interaction—the heart of the system:
bool bullishInteraction =
   (low1 < ema && close1 > ema);

bool bearishInteraction =
   (high1 > ema && close1 < ema);
This replaces rigid proximity logic with behavioral rejection logic.
Optional filters are then conditionally applied:
- Tolerance soft filter
- Second-leg requirement
- Pin bar filter
- Double structure filter
Final decision:
if(bullishTrend && bullishInteraction)
   ExecuteTrade(ORDER_TYPE_BUY);

if(bearishTrend && bearishInteraction)
   ExecuteTrade(ORDER_TYPE_SELL);
This layered approach ensures structure-first execution.
8. Pin Bar Detection
We compute body and wick sizes:
double body  = MathAbs(close-open);
double lowerWick = MathMin(open,close) - low;
We then enforce:
- Wick at least 2× body
- Directional close confirmation
return (lowerWick > body*2 && close > open);This mechanical definition removes subjectivity.
9. Double Structure Detection
We compare swing points:
return (MathAbs(low1 - low3) <= 20*_Point);This is a simplified structural model allowing expandability later.
10. Trade Execution
In ExecuteTrade():
- We retrieve the bid/ask price.
- We calculate lot size (fixed or risk-based).
- We compute SL and TP offsets.
Buy example:
sl = price - StopLossPoints*_Point;
tp = price + TakeProfitPoints*_Point;
trade.Buy(lot,_Symbol,price,sl,tp,"EMA50 OHLC Buy");
Sell mirrors with this logic symmetrically.
This separation keeps execution isolated from signal logic.
11. Risk-Based Lot CalculationWe compute:
- Account balance
- Monetary risk
- Tick value
- Tick size
- Loss per lot
double lot = riskMoney/lossPerLot;We normalize the broker volume step and enforce minimum lot constraints.
This ensures realistic broker-compliant execution.12. New Bar Detection
Finally, IsNewBar() ensures signal stability:
static datetime lastBar=0;
datetime current=iTime(_Symbol,_Period,0);
If time changes, a new bar is detected.
This prevents multiple triggers per candle.
Testing
Here is where theoretical structure meets observable market behavior. In this study, our primary validation method is visual testing inside the MetaTrader 5 Strategy Tester. The objective is not immediate statistical optimization but structural confirmation—ensuring that the Expert Advisor behaves exactly as designed when interacting with live historical price data.
We use the “Every tick based on real ticks” modeling mode to achieve the highest possible accuracy during replay. Because the strategy depends on candle interaction with the EMA—specifically the pierce-and-close mechanic—precise intrabar modeling is essential. Lower modeling quality could distort rejection behavior and produce misleading interpretations of how the signal forms.
During visual testing, we focus entirely on behavioral correctness. Each trade is examined directly on the chart as the simulation progresses. We confirm that entries occur only after a valid EMA interaction: the candle must pierce the EMA and close back in the direction of the prevailing trend. We ensure that the reaction logic triggers exactly once per valid setup and that no duplicate signals are generated on the same bar. If the second-leg option is enabled, we verify that the system properly waits for the additional confirmation before executing a position.

Fig. 3. Testing on USDJPY
This stage also allows us to observe contextual nuances that statistics alone cannot reveal. We evaluate whether the EMA interaction genuinely reflects market rejection, whether the optional pin bar and double-structure filters behave logically, and whether the system avoids reacting to insignificant price noise. Visual inspection strengthens our understanding of how algorithmic abstraction translates into actual market behavior.
While this article focuses on visual validation, further analysis such as multi-year statistical backtesting, cross-symbol robustness testing, and parameter optimization are recommended as subsequent steps. Those procedures provide quantitative confirmation, but they should only be performed after visual testing confirms that the structural logic operates correctly.
In this framework, visual testing is not a superficial step—it is a critical verification stage that ensures our behavioral model of EMA interaction is faithfully executed before deeper statistical evaluation begins.
Conclusion
The EMA 50 retest strategy is a behavior-driven reaction model, not a rigid candle-pattern system. Through careful manual walk-back research and observation, we have successfully developed a system that trades moving average bounces effectively, turning discretionary insights into structured algorithmic execution. This demonstrates that behavior-based automation is practical and actionable for intraday trading.
Bounce structures around the EMA 50 are highly variable. Some appear as sharp rejections, others as gradual compressions, and some exhibit two-leg retests before continuation. Automation must therefore capture behavioral interaction with the EMA, rather than focusing solely on fixed candle patterns. By combining trend qualification, EMA interaction detection, reaction confirmation logic, and repeated-defense probability concepts, the system identifies and acts on high-probability EMA 50 bounces consistently.
For readers interested in a structured summary, the key lessons of this discussion are outlined in the table below, along with the attached source files that provide both research and implementation references. These resources bridge the gap between conceptual study, coding structure, and practical application.
We welcome your insights, observations, or questions. Please share your thoughts and experiences in the comments section to enrich the discussion and contribute to the collective refinement of this trading approach.
Key Lesson
| Key Lesson | Description |
|---|---|
| 1. Research Before Code: | Manual chart walk-back research should precede automation. Coding without observing real market behavior leads to rigid and unrealistic systems. |
| 2. Code Behavior, Not Shapes: | Markets react through behavior clusters, not fixed candle patterns. Translate reaction logic (pierce + close) instead of memorizing visual formations. |
| 3. Separate Trend From Entry: | Trend qualification must be isolated from entry logic. First determine directional bias, then evaluate interaction conditions. |
| 4. Use Indicator Handles Properly: | Always create indicators using iMA() and retrieve values with CopyBuffer(). Proper handle management ensures stability and performance. |
| 5. Think in Candle Shifts: | Use shift indexing correctly. Index 0 is the forming candle; confirmed signals should use index 1 or higher to avoid premature execution. |
| 6. Control Execution With New-Bar Logic: | Use an IsNewBar() function to prevent intra-candle over-triggering and ensure signal stability. |
| 7. Modular Architecture: | Separate logic into functions such as CheckTrend(), CheckInteraction(), and ExecuteTrade(). Modular systems are scalable and easier to debug. |
| 8. Optional Filters Should Be Toggleable: | Use boolean inputs for structural filters like pin bars or double structures. This allows flexible experimentation without rewriting core logic. |
| 9. Avoid Over-Precision: | Distance-based tolerance should be optional. Behavioral confirmation is more robust than exact price matching. |
| 10. Risk Must Be Engineered: | Implement both fixed lot and percentage risk models. Professional systems calculate lot size based on stop-loss exposure. |
| 11. Normalize Broker Constraints: | Always respect SYMBOL_VOLUME_STEP and SYMBOL_VOLUME_MIN when calculating lot size to ensure broker compliance. |
| 12. Protect Against Duplicate Positions: | Use PositionSelect() before executing trades to avoid stacking unintended multiple entries. |
| 13. Clean Resource Management: | Release indicator handles in OnDeinit() to prevent memory leakage and maintain program integrity. |
| 14. Validate Structurally Before Optimizing: | Visual testing should confirm behavioral correctness before statistical optimization is attempted. |
| 15. Build Systems, Not Signals: | A professional Expert Advisor is not just an entry condition. It includes structure, context, risk control, execution management, and validation methodology. |
Attachments
| File Name | Current Version | Purpose & Description |
|---|---|---|
| EMA50_Bounce_EA.mq5 | 1.00 | Full behavior-driven implementation of the EMA 50 bounce strategy. Utilizes candle OHLC interaction logic with optional structural filters such as pin bars and double top/bottom confirmations. |
| Walkback_Study_Screenshots.zip | 1.00 | Collection of manual walk-back research screenshots demonstrating EMA bounce variability, reaction depth, and second-leg retest structures. |
Warning: All rights to these materials are reserved by MetaQuotes Ltd. Copying or reprinting of these materials in whole or in part is prohibited.
This article was written by a user of the site and reflects their personal views. MetaQuotes Ltd is not responsible for the accuracy of the information presented, nor for any consequences resulting from the use of the solutions, strategies or recommendations described.

- Free trading apps
- Over 8,000 signals for copying
- Economic news for exploring financial markets
You agree to website policy and terms of use