

Building a Traditional Daily Pivot Point Indicator in MQL5
 4 609
4 609
 0
0

Introduction
While MetaTrader 5 provides a pivot-based implementation through Navigator → Indicators → Free Indicators → Pivot Channels, the implementation discussed in this article shares the same foundation of calculating daily pivot levels from previous session data. However, it uses a different approach by managing pivot levels through graphical objects instead of indicator buffers, providing direct control over individual trading sessions and chart objects. When a custom workflow requires separate historical sessions, configurable labels, object cleanup, and controlled daily updates, a graphical-object approach becomes a practical alternative.
This article presents an MQL5 indicator that uses graphical objects instead of indicator buffers to calculate and display classic daily pivot points. The levels P plus R1–R3 and S1–S3 are calculated strictly from the previous day's High/Low/Close values, while each trading session is independently managed through object creation, deletion, and updating. The implementation retrieves D1 data, draws historical pivot sessions on the chart, refreshes levels when a new daily bar begins, and extends the current session lines forward without unnecessary recalculation. Designed to operate on D1 and lower timeframes, the indicator provides a structured approach for visualizing daily pivot levels during intraday analysis.
Project Overview and Implementation Plan
It is crucial to understand what we are developing and the actions necessary to do it before starting the actual implementation in MQL5. A well-defined implementation plan guarantees that every component is built methodically and helps us divide the project into smaller, more manageable tasks. In this section, we will examine the structure of the traditional daily pivot point indicator and outline the step-by-step process we will follow.
What We Are Building
In this project, we will build a traditional daily pivot point indicator for MetaTrader 5 that automatically calculates and displays key market levels directly on the main chart. The indicator will plot the central Pivot Point (P), three resistance levels (R1, R2, R3), and three support levels (S1, S2, S3). These levels will be drawn automatically at the start of each trading day, removing the need for manual calculations and chart drawing. The indicator will also allow multiple historical pivot sessions to be displayed so traders can easily analyze how price reacts around previous key levels.
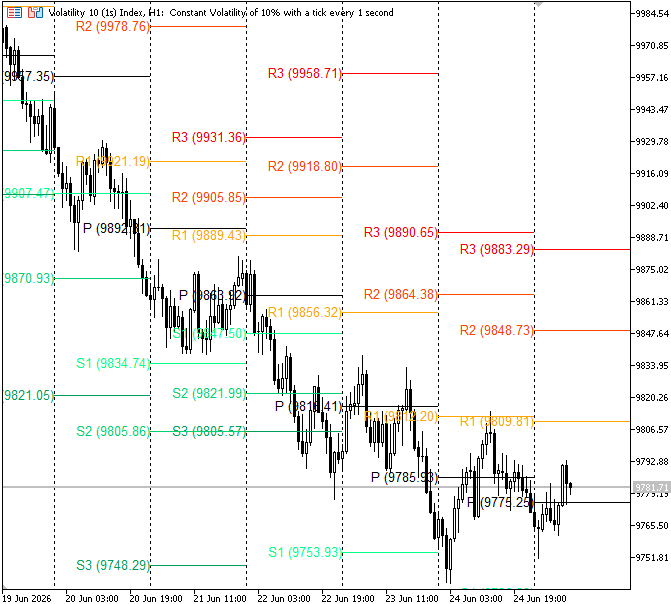
The pivot point will be determined using the high, low, and close prices from the previous day. The formula used to calculate the central pivot level when these variables are extracted from the daily period is:
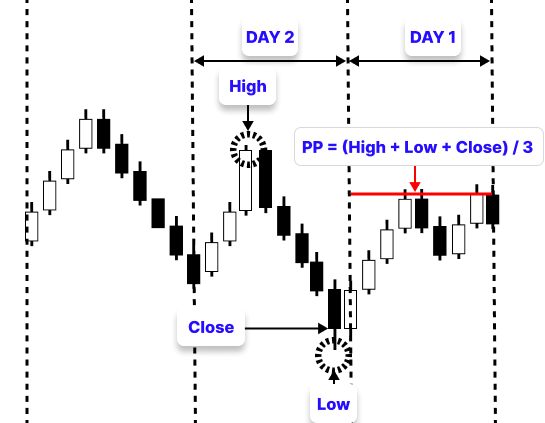
Pivot Point (PP) = (High + Low + Close) / 3
These numbers are taken from the daily timeframe. After this calculation, a horizontal trend line will be drawn on the chart at the pivot price level, marking it clearly for the current trading day and extending it across the session for continuous reference.
After calculating the pivot point, we will compute the support and resistance levels using the same previous day data. The formulas are:
- R1 = (2 × P) – Low
- S1 = (2 × P) – High
- R2 = P + (High − Low)
- S2 = P − (High − Low)
- R3 = High + 2 × (P − Low)
- S3 = Low − 2 × (High − P)
Once these levels are calculated, horizontal trend lines will also be drawn at each price level on the current trading day, allowing traders to visually identify potential support zones, resistance zones, breakouts, and reversal areas directly on the chart.
Note: The pivot levels are calculated from the previous day's high, low, and close values. Therefore, the indicator is designed for charts from M1 through D1 while remaining unavailable on higher timeframes because the calculations rely on daily data.
Implementation Plan
This section covers the detailed process for developing the indicator in MQL5.
Defining Input Parameters and Configuration Settings:
All the input settings that determine how the pivot point indicator behavior and its chart appearance are defined in this stage. Users can modify the indicator settings using these inputs without changing the main code. We include parameters such as the number of historical pivot sessions to display, whether to show level names and price values on the chart, the position of the labels, and the line width for better visual clarity.
To facilitate the visual differentiation of each level, we additionally create a set of color inputs for the pivot point, resistance levels, and support levels. We make the indicator adaptable, user-friendly, and simple to modify for various trading preferences and chart styles by collecting these options at the start of the code.
Creating the Pivot Calculation Function and Trend Line Object Drawing Function:
In the second step, we’ll create a function that calculates the pivot point for each trading day using the previous day’s high, low, and close prices. This means the pivot level shown on any given day is not based on that same day’s price movement but strictly on data from the day before. For each day in our historical range, we first go one step back to fetch the previous day’s market data, then use it to compute the pivot point for the current day.
For example, if we are calculating pivots for 3 days, the indicator will loop through those 3 days on the chart.
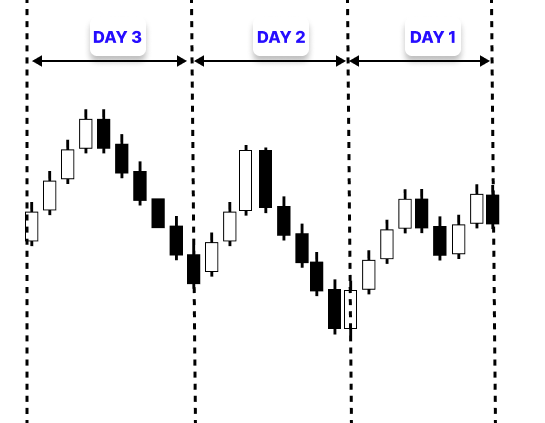
The data from the day before day 1 (day 2) is used for day 1.
The data from the day before day 2 (day 3) is used for day 2, and this process is repeated until all designated days are covered.
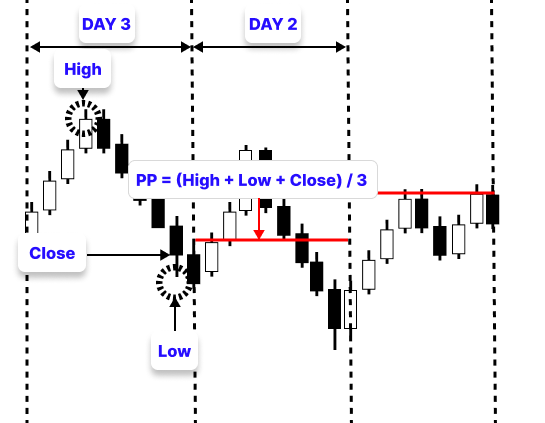
This ensures each day has its own correctly aligned pivot levels based on its respective previous session. We will also create a reusable drawing function that generates horizontal trend line objects on the chart, which will be used to visualize the pivot point and later the support and resistance levels. This approach allows the same drawing logic to be applied consistently across all calculated levels.
Calculating Support and Resistance Levels and Drawing Historical Pivot Sessions:
After calculating the pivot point for each trading day, we proceed to derive the corresponding support and resistance levels using the same previous day’s high, low, and pivot values. These levels are generated for every day in the selected historical range, ensuring that each session has its own complete set of market reference zones based strictly on prior market data.
The resistance and support levels are computed using the standard pivot formulas, producing R1, R2, R3, and S1, S2, S3. These levels act as potential price reaction zones where the market may slow down, reverse, or break depending on momentum and volatility conditions. After calculating the values, the code passes each level to a function that draws a horizontal trend line at the corresponding price. These lines are extended across the full trading session, starting from the beginning of the day and ending either at the next session or the current time for the active day. To improve readability, each level is assigned a distinct color and optional label, making it easy to visually separate pivot, resistance, and support zones directly on the chart.
Managing Object Updates and Extending Current Day Pivot Levels:
The indicator must appropriately control how these graphical objects behave when market conditions change after the pivot levels have been computed and shown. Because MetaTrader 5 constantly refreshes prices, the indicator must prevent duplicate objects and avoid conflicts with existing drawings. This is taken care of by a cleanup procedure that eliminates all previously generated objects by checking whether their names start with a distinct prefix. Only objects belonging to this indicator are deleted, ensuring that no other chart objects are affected.
When a new trading day begins, or when the indicator runs for the first time, all pivot objects are removed and redrawn to reflect the latest daily data. This ensures that every session starts with clean and accurate levels based on the most recent previous day's information.
For the current trading day, instead of redrawing everything on every tick, the indicator simply extends the existing pivot lines forward in time. It achieves this by updating the second anchor point of each horizontal trend line so that the levels continue projecting into the future. This allows the pivot levels to remain dynamic and visually continuous throughout the active trading session without unnecessary recalculation or redraw operations.
Note: The project discussed in this article is entirely practice-based and intended to teach readers MQL5 through real-world, hands-on application. It is not a guaranteed method for making profits in live trading.
Implementation in MQL5
We will go from the indicator's conceptual design to its actual implementation in MQL5 in this part. From defining the input parameters and carrying out the pivot calculations to creating and controlling the pivot levels on the chart, we will transfer the previously covered ideas into code and implement each part step by step.
Defining Input Parameters and Configuration Settings
Just as discussed in the implementation plan, we begin by defining the input parameters and configuration settings that will control the behavior and appearance of the indicator.
Example:#property indicator_chart_window #property indicator_plots 0 //--- Enumeration used to determine whether labels are displayed //--- on the left or right side of the pivot lines enum ENUM_LABEL_POS { LABEL_LEFT, LABEL_RIGHT }; //--- User inputs input int InpHistoricalPivots = 15; // Number of past daily pivots to draw input bool InpShowLabels = true; // Show level names (P, R1, S1...) input bool InpShowPrices = true; // Show price values next to levels input ENUM_LABEL_POS InpLabelPosition = LABEL_LEFT; // Label position input int InpLineWidth = 1; // Line width //--- User-defined colors for pivot and support/resistance levels input color InpColorP = clrYellow; // Pivot color input color InpColorR1 = clrOrange; // R1 color input color InpColorR2 = clrOrangeRed; // R2 color input color InpColorR3 = clrRed; // R3 color input color InpColorS1 = clrLime; // S1 color input color InpColorS2 = clrLimeGreen; // S2 color input color InpColorS3 = clrGreen; // S3 color //+------------------------------------------------------------------+ //| Custom indicator initialization function | //+------------------------------------------------------------------+ int OnInit() { //--- Set the indicator name displayed in the chart window IndicatorSetString(INDICATOR_SHORTNAME, "Daily Pivot Points (Traditional)"); //--- return(INIT_SUCCEEDED); } //+------------------------------------------------------------------+
Explanation:
The first two property directives define how the indicator will be displayed in MetaTrader 5. The #property indicator_chart_window directive instructs MetaTrader 5 to draw the indicator directly on the main price chart instead of creating a separate indicator window below the chart. Since pivot points represent support and resistance levels that traders typically analyze alongside price action, displaying them on the main chart provides better visual context. The #property indicator_plots 0 directive specifies that the indicator does not use traditional indicator buffers and plots. Instead, all pivot levels will be rendered using graphical objects such as trend lines and text labels.
The ENUM_LABEL_POS enumeration, which lets users select the location of the pivot level labels, is then defined. LABEL_LEFT, which positions labels at the start of the pivot lines, and LABEL_RIGHT, which positions them at the end, are the two options available in the enumeration. Because users can choose descriptive choices straight from the input settings, using an enumeration rather than a straightforward integer input simplifies the indicator's configuration.
The InpHistoricalPivots input specifies the number of historical daily pivot sessions that should be displayed on the chart. The default value of 15 means that the indicator will calculate and draw pivot levels for the last fifteen trading days. Increasing this value allows traders to study more historical price interactions, while decreasing it reduces chart clutter.
The InpShowLabels and InpShowPrices Boolean inputs control the information displayed alongside each pivot level. When InpShowLabels is set to true, the indicator displays the level names such as P, R1, R2, S1, and S2 on the chart. Similarly, when InpShowPrices is enabled, the exact price value corresponding to each level is displayed. These options provide flexibility, allowing traders to display only the information they consider necessary.
To decide whether the labels are positioned on the left or right side of the pivot lines, the InpLabelPosition input uses the previously established enumeration. Users can change the label location to suit their own tastes and chart style thanks to this option. Depending on their visual needs, users can make the levels more or less noticeable by adjusting the pivot lines' thickness using the InpLineWidth input. Each category is given a unique color, which enhances chart readability and facilitates traders' ability to rapidly discern pivot, support, and resistance zones.
Creating the Pivot Calculation Function and Trend Line Object Drawing Function
As outlined in the implementation plan, the second stage of the implementation is to calculate the pivot point for each trading day and plot the resulting level on the chart.
First, we will create a function that calculates the pivot point using the previous day’s high, low, and close values. Then, we will create a separate reusable function to draw horizontal trend lines for marking the pivot levels on the chart, so it can be called in multiple places throughout the indicator.
Note: We will highlight the specific code sections related to each implementation stage as we progress, ensuring each part is clearly understood on its own without mixing it with previously explained sections.
Example:
//--- Prefix used to uniquely identify indicator objects on the chart
string   g_prefix       = "DPP_";

//+------------------------------------------------------------------+
//| Pivot formula                                                    |
//+------------------------------------------------------------------+
double CalcPivot(double h, double l, double c)
  {
//--- Calculate the traditional pivot point
   return (h + l + c) / 3.0;
  }

//+------------------------------------------------------------------+
//| Draw one level (line + optional label)                           |
//+------------------------------------------------------------------+
void DrawLevel(string dayTag,
               string levelName,
               double price,
               datetime t1,
               datetime t2,
               color clr)
  {
//--- Construct a unique name for the line object
   string lineName = g_prefix + dayTag + "_" + levelName;

//--- Remove any existing object with the same name
   ObjectDelete(0, lineName);

//--- Create a horizontal trend line using two points
   ObjectCreate(0, lineName, OBJ_TREND, 0, t1, price, t2, price);

//--- Configure the appearance and behavior of the line
   ObjectSetInteger(0, lineName, OBJPROP_RAY_RIGHT, false);
   ObjectSetInteger(0, lineName, OBJPROP_COLOR, clr);
   ObjectSetInteger(0, lineName, OBJPROP_WIDTH, InpLineWidth);
   ObjectSetInteger(0, lineName, OBJPROP_SELECTABLE, false);
   ObjectSetInteger(0, lineName, OBJPROP_HIDDEN, true);
  }
Explanation:
The pivot point is determined by the function CalcPivot(), which uses price information from the previous trading day. The high, low, and close prices are the three inputs, and the average value is returned. All the indicator's support and resistance calculations are based on this average, which creates the center pivot level. Instead of having to rewrite the function every time we loop through several historical days, this logic may be reused and easily called by putting it within a separate function.
To ensure that all graphical objects created by the indicator are properly managed on the chart, we define a prefix variable called g_prefix. This prefix is added to every object name generated by the indicator, including pivot lines and labels. Since MetaTrader 5 charts can contain objects from different indicators or manual drawings, this naming system allows us to uniquely identify everything created by this indicator. It also makes it easier to delete or update only our own objects without affecting anything else on the chart.
The DrawLevel() function is used to plot each pivot, support, and resistance level as a horizontal trend line on the chart. It receives parameters such as the day identifier, level name, calculated price, time range, and color. Inside the function, a unique object name is first created by combining the prefix, day tag, and level name. This ensures that each level on each day has a distinct identity. Before drawing a new line, any existing object with the same name is deleted to avoid duplication and keep the chart updated.
After that, a horizontal trend line is created using two points that share the same price but different time values, making the line perfectly horizontal at the pivot level. Lastly, a number of parameters are used to regulate the line's appearance and behavior on the chart. The line is made non-selectable, hidden from the object list, and given a certain color and width based on user choices. It is also prohibited from extending indefinitely to the right. This guarantees that all pivot, support, and resistance levels are clearly visible on the chart while maintaining its cleanliness. Next, we will develop a function that fetches the necessary data from the previous day and gets it ready to be shown on the chart in addition to calculating the pivot point.
Example:
//+------------------------------------------------------------------+
//| Calculate and draw pivots for every requested historical day     |
//+------------------------------------------------------------------+
void DrawAllPivots()
  {

//--- Determine how many daily bars are available
   int availableDays = iBars(_Symbol, PERIOD_D1);

//--- Limit the number of pivots to the available history
   int days = MathMin(InpHistoricalPivots, availableDays - 1);

//--- Process each historical trading day
   for(int d = 0; d < days; d++)
     {
      //--- Retrieve the previous day's high, low, and close
      double h = iHigh(_Symbol, PERIOD_D1, d + 1);
      double l = iLow(_Symbol, PERIOD_D1, d + 1);
      double c = iClose(_Symbol, PERIOD_D1, d + 1);

      //--- Calculate pivot and support/resistance levels
      double p  = CalcPivot(h, l, c);

      //--- Determine the start and end time for the session
      datetime sessionStart = iTime(_Symbol, PERIOD_D1, d);

      //--- Extend today's levels into the future, historical levels end
      //--- at the beginning of the next trading day
      datetime sessionEnd = (d == 0)
                            ? TimeCurrent() + PeriodSeconds(PERIOD_D1)
                            : iTime(_Symbol, PERIOD_D1, d - 1);

      //--- Convert the day index into a unique tag
      string tag = IntegerToString(d);

      //--- Draw all pivot levels for the current day
      DrawLevel(tag, "P",  p,  sessionStart, sessionEnd, InpColorP);

     }

//--- Force the chart to refresh immediately
   ChartRedraw(0);
  }
Explanation:
Plotting and calculating pivot levels for all specified previous trading days is the responsibility of the DrawAllPivots() function. It serves as the indicator's central component by integrating pivot computation, data retrieval, and chart presentation into a single procedure. To ensure that only current market data is read, the function starts by figuring out how many daily bars are present on the terminal. To avoid out-of-range errors and restrict computations to the intended number of historical sessions, it then compares this value with the user-defined InpHistoricalPivots input and only processes the smaller of the two.
Next, the function loops through each historical day one by one. For each iteration, it retrieves the previous day’s high, low, and close values using the daily timeframe data. This is important because each pivot point must be based strictly on the completed trading session before it. After retrieving the price data, the pivot point is calculated using the CalcPivot() function, which converts the previous day’s values into a single central reference level. This value is then used as the foundation for plotting all pivot-related levels.
The function then determines the correct time range for each session. The start time is taken from the beginning of the current day in the loop, while the end time is either extended into the future for the current day or set to the start of the next day for historical sessions. This ensures that each set of pivot levels is properly aligned within its trading session. A unique tag is also created from the loop index to ensure that each day’s objects have distinct names. This prevents overlap or conflicts between different pivot sessions on the chart. Finally, the function calls the drawing function to plot the pivot levels on the chart and refreshes the chart display so all levels appear immediately.
Example://--- Stores the opening time of the most recent daily bar datetime g_lastDailyBar = 0; //+------------------------------------------------------------------+ //| Custom indicator initialization function | //+------------------------------------------------------------------+ int OnInit() { //--- Set the indicator name displayed in the chart window IndicatorSetString(INDICATOR_SHORTNAME, "Daily Pivot Points (Traditional)"); //--- Reset the last processed daily bar time g_lastDailyBar = 0; //--- return(INIT_SUCCEEDED); } //+------------------------------------------------------------------+ //| Custom indicator iteration function | //+------------------------------------------------------------------+ int OnCalculate(const int32_t rates_total, const int32_t prev_calculated, const datetime &time[], const double &open[], const double &high[], const double &low[], const double &close[], const long &tick_volume[], const long &volume[], const int32_t &spread[]) { //--- Prevent the indicator from running on timeframes above D1 if(PeriodSeconds(PERIOD_CURRENT) > PeriodSeconds(PERIOD_D1)) return 0; //--- Get the opening time of the current daily bar datetime currentDailyBar = iTime(_Symbol, PERIOD_D1, 0); //--- Redraw all pivot levels when a new trading day begins //--- or when the indicator is loaded for the first time if(currentDailyBar != g_lastDailyBar || prev_calculated == 0) { //--- Store the current daily bar time g_lastDailyBar = currentDailyBar; //--- Recalculate and redraw all pivot levels DrawAllPivots(); } //--- return value of prev_calculated for next call return(rates_total); } //+------------------------------------------------------------------+
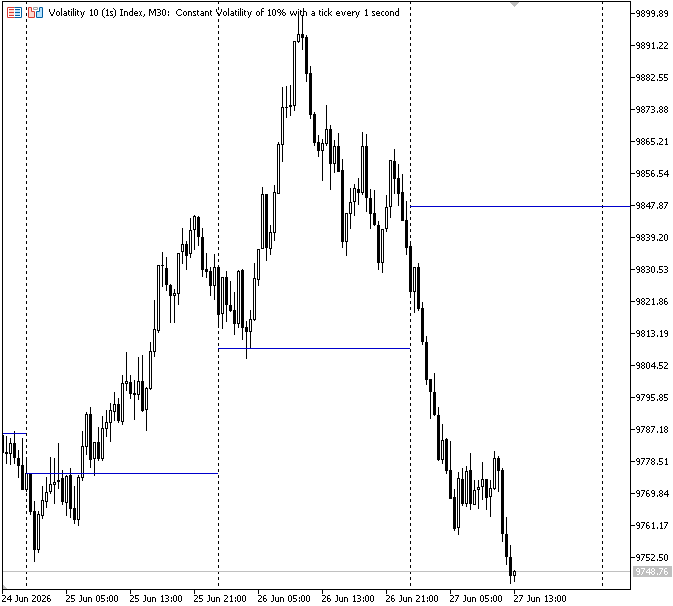
Output:
Explanation:
The first condition ensures that the indicator only runs on appropriate timeframes. Since pivot levels are based on daily data, the indicator is restricted from operating on timeframes higher than the daily chart. By comparing the current timeframe with the daily timeframe, the code prevents execution on weekly or monthly charts where the logic would not be meaningful. The function then uses daily period data to retrieve the opening time of the current daily candle. This value serves as a reference point to determine the beginning of a new day and indicates the beginning of the most recent trading session.
The main logic then checks whether a new trading day has started or whether the indicator is being loaded for the first time. This is done by comparing the current daily bar time with the previously stored value. If there is a difference, either the indicator has just been initialized or a new session has started. The DrawAllPivots() function is called, and the stored daily bar time is updated to the most recent value when this condition is satisfied. This keeps the chart accurate and current by ensuring that all pivot levels are recalculated and redrawn using the most recent data from the previous day.
Calculating Support and Resistance Levels and Drawing Historical Pivot Sessions
The next step is to calculate and plot the support and resistance levels derived from the pivot point onto the chart as horizontal levels.
Example://+------------------------------------------------------------------+ //| Draw one level (line + optional label) | //+------------------------------------------------------------------+ void DrawLevel(string dayTag, string levelName, double price, datetime t1, datetime t2, color clr) { //--- Construct a unique name for the line object string lineName = g_prefix + dayTag + "_" + levelName; //--- Remove any existing object with the same name ObjectDelete(0, lineName); //--- Create a horizontal trend line using two points ObjectCreate(0, lineName, OBJ_TREND, 0, t1, price, t2, price); //--- Configure the appearance and behavior of the line ObjectSetInteger(0, lineName, OBJPROP_RAY_RIGHT, false); ObjectSetInteger(0, lineName, OBJPROP_COLOR, clr); ObjectSetInteger(0, lineName, OBJPROP_WIDTH, InpLineWidth); ObjectSetInteger(0, lineName, OBJPROP_SELECTABLE, false); ObjectSetInteger(0, lineName, OBJPROP_HIDDEN, true); //--- Draw labels if enabled by the user if(InpShowLabels || InpShowPrices) { //--- Create a unique name for the text label string labelName = g_prefix + dayTag + "_" + levelName + "_lbl"; //--- Position the label at either the left or right end of the line datetime labelTime = (InpLabelPosition == LABEL_LEFT) ? t1 : t2; //--- Remove any existing label with the same name ObjectDelete(0, labelName); //--- Create the text object ObjectCreate(0, labelName, OBJ_TEXT, 0, labelTime, price); //--- Build the label text string txt = ""; //--- Add level name if requested if(InpShowLabels) txt += levelName + " "; //--- Add price value if requested if(InpShowPrices) txt += "(" + DoubleToString(price, _Digits) + ")"; //--- Apply text settings ObjectSetString(0, labelName, OBJPROP_TEXT, txt); ObjectSetInteger(0, labelName, OBJPROP_COLOR, clr); ObjectSetInteger(0, labelName, OBJPROP_ANCHOR, (InpLabelPosition == LABEL_LEFT) ? ANCHOR_RIGHT : ANCHOR_LEFT); ObjectSetInteger(0, labelName, OBJPROP_SELECTABLE, false); ObjectSetInteger(0, labelName, OBJPROP_HIDDEN, true); } } //+------------------------------------------------------------------+ //| Calculate and draw pivots for every requested historical day | //+------------------------------------------------------------------+ void DrawAllPivots() { //--- Determine how many daily bars are available int availableDays = iBars(_Symbol, PERIOD_D1); //--- Limit the number of pivots to the available history int days = MathMin(InpHistoricalPivots, availableDays - 1); //--- Process each historical trading day for(int d = 0; d < days; d++) { //--- Retrieve the previous day's high, low, and close double h = iHigh(_Symbol, PERIOD_D1, d + 1); double l = iLow(_Symbol, PERIOD_D1, d + 1); double c = iClose(_Symbol, PERIOD_D1, d + 1); //--- Calculate pivot and support/resistance levels double p = CalcPivot(h, l, c); double r1 = (2.0 * p) - l; double s1 = (2.0 * p) - h; double r2 = p + (h - l); double s2 = p - (h - l); double r3 = h + 2.0 * (p - l); double s3 = l - 2.0 * (h - p); //--- Determine the start and end time for the session datetime sessionStart = iTime(_Symbol, PERIOD_D1, d); //--- Extend today's levels into the future, historical levels end //--- at the beginning of the next trading day datetime sessionEnd = (d == 0) ? TimeCurrent() + PeriodSeconds(PERIOD_D1) : iTime(_Symbol, PERIOD_D1, d - 1); //--- Convert the day index into a unique tag string tag = IntegerToString(d); //--- Draw all pivot levels for the current day DrawLevel(tag, "P", p, sessionStart, sessionEnd, InpColorP); DrawLevel(tag, "R1", r1, sessionStart, sessionEnd, InpColorR1); DrawLevel(tag, "S1", s1, sessionStart, sessionEnd, InpColorS1); DrawLevel(tag, "R2", r2, sessionStart, sessionEnd, InpColorR2); DrawLevel(tag, "S2", s2, sessionStart, sessionEnd, InpColorS2); DrawLevel(tag, "R3", r3, sessionStart, sessionEnd, InpColorR3); DrawLevel(tag, "S3", s3, sessionStart, sessionEnd, InpColorS3); } //--- Force the chart to refresh immediately ChartRedraw(0); }
Output:
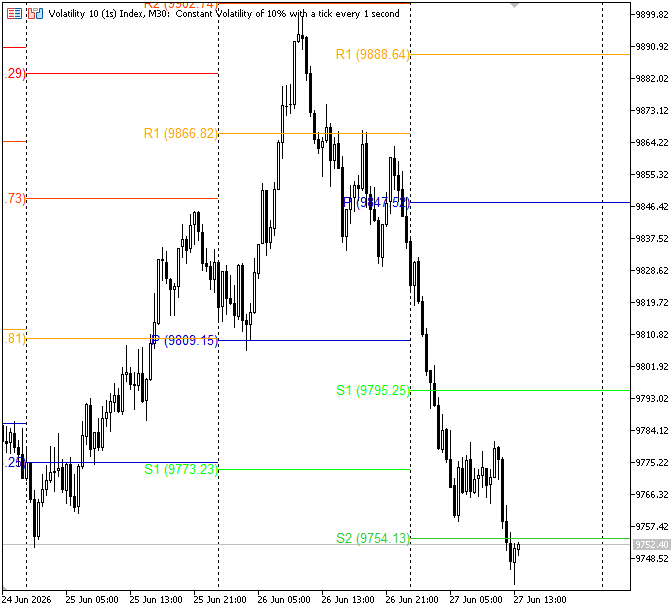
Explanation:
Each pivot, support, and resistance level's optional text labels are displayed by the block inside the DrawLevel() function. The user inputs InpShowLabels and InpShowPrices govern this function, enabling users to choose whether they want additional descriptive information on the chart or just clear horizontal lines. The function initially combines the indicator prefix, day tag, and level name to create a unique label name when label display is enabled. This guarantees that each label is linked to its matching pivot line and may be controlled separately on the chart without interference or overlap.
The user's preferred setting controls where labels are placed. The label is shown at the start of the pivot line using the session's commencement time when the right position is chosen. The label is shown at the end of the line using the session's ending time when the correct position is chosen. Traders have more control over how data is displayed on the chart thanks to this option. The indicator initially looks for and removes any labels that already have the same identifier to prevent displaying duplicate labels. The selected time and price level are then used to build a new text object that precisely aligns with its corresponding pivot line.
The label text is dynamically created to display pricing figures, level names, or both, depending on user choices. This allows you to select between a more extensive informational perspective and a simple visual layout. Following creation, the text's look is polished for readability and consistency. The label color is hidden from the object list, synchronized with the matching line, and rendered non-selectable. Regardless of whether it is placed on the left or right side, the anchor is also changed to guarantee precise alignment.
The indicator uses the previously calculated pivot point to compute all support and resistance levels inside the DrawAllPivots() function before plotting on the chart. To guarantee that every level accurately represents the historical market structure, these values are produced for every trading day using data from previous sessions. The DrawLevel() function is used to depict each level as horizontal lines on the chart after it has been calculated. Using the specified start and end periods, each line is drawn at the appropriate price level and stretched during the entire session.
Managing Object Updates and Extending Current Day Pivot Levels
The final step is to bring all the components together and ensure the pivot levels are properly calculated, drawn, and updated on the chart.
Example:
//+------------------------------------------------------------------+
//| Remove every object this indicator has drawn                     |
//+------------------------------------------------------------------+
void DeleteAllObjects()
  {
//--- Get the total number of objects on the chart
   int total = ObjectsTotal(0, -1, -1);

//--- Loop through all chart objects in reverse order
   for(int i = total - 1; i >= 0; i--)
     {
      //--- Retrieve the object name
      string name = ObjectName(0, i, -1, -1);

      //--- Delete only objects created by this indicator
      if(StringFind(name, g_prefix) == 0)
         ObjectDelete(0, name);
     }
  }

//+------------------------------------------------------------------+
//| Calculate and draw pivots for every requested historical day     |
//+------------------------------------------------------------------+
void DrawAllPivots()
  {
//--- Remove previously drawn pivot objects
   DeleteAllObjects();

//--- Determine how many daily bars are available
   int availableDays = iBars(_Symbol, PERIOD_D1);

//--- Limit the number of pivots to the available history
   int days = MathMin(InpHistoricalPivots, availableDays - 1);

//--- Process each historical trading day
   for(int d = 0; d < days; d++)
     {
      //--- Retrieve the previous day's high, low, and close
      double h = iHigh(_Symbol, PERIOD_D1, d + 1);
      double l = iLow(_Symbol, PERIOD_D1, d + 1);
      double c = iClose(_Symbol, PERIOD_D1, d + 1);

      //--- Calculate pivot and support/resistance levels
      double p  = CalcPivot(h, l, c);
      double r1 = (2.0 * p) - l;
      double s1 = (2.0 * p) - h;
      double r2 = p + (h - l);
      double s2 = p - (h - l);
      double r3 = h + 2.0 * (p - l);
      double s3 = l - 2.0 * (h - p);

      //--- Determine the start and end time for the session
      datetime sessionStart = iTime(_Symbol, PERIOD_D1, d);

      //--- Extend today's levels into the future, historical levels end
      //--- at the beginning of the next trading day
      datetime sessionEnd = (d == 0)
                            ? TimeCurrent() + PeriodSeconds(PERIOD_D1)
                            : iTime(_Symbol, PERIOD_D1, d - 1);

      //--- Convert the day index into a unique tag
      string tag = IntegerToString(d);

      //--- Draw all pivot levels for the current day
      DrawLevel(tag, "P",  p,  sessionStart, sessionEnd, InpColorP);
      DrawLevel(tag, "R1", r1, sessionStart, sessionEnd, InpColorR1);
      DrawLevel(tag, "S1", s1, sessionStart, sessionEnd, InpColorS1);
      DrawLevel(tag, "R2", r2, sessionStart, sessionEnd, InpColorR2);
      DrawLevel(tag, "S2", s2, sessionStart, sessionEnd, InpColorS2);
      DrawLevel(tag, "R3", r3, sessionStart, sessionEnd, InpColorR3);
      DrawLevel(tag, "S3", s3, sessionStart, sessionEnd, InpColorS3);
     }

//--- Force the chart to refresh immediately
   ChartRedraw(0);
  }
//+------------------------------------------------------------------+
//| Custom indicator deinitialization function                       |
//+------------------------------------------------------------------+
void OnDeinit(const int reason)
  {
//--- Remove all objects created by this indicator
   DeleteAllObjects();

//--- Refresh the chart
   ChartRedraw(0);
  }

//+------------------------------------------------------------------+
//| Custom indicator iteration function                              |
//+------------------------------------------------------------------+
int OnCalculate(const int rates_total,
                const int prev_calculated,
                const datetime &time[],
                const double &open[],
                const double &high[],
                const double &low[],
                const double &close[],
                const long &tick_volume[],
                const long &volume[],
                const int &spread[])
  {
//--- Prevent the indicator from running on timeframes above D1
   if(PeriodSeconds(PERIOD_CURRENT) > PeriodSeconds(PERIOD_D1))
      return 0;

//--- Get the opening time of the current daily bar
   datetime currentDailyBar = iTime(_Symbol, PERIOD_D1, 0);

//--- Redraw all pivot levels when a new trading day begins
//--- or when the indicator is loaded for the first time
   if(currentDailyBar != g_lastDailyBar || prev_calculated == 0)
     {
      //--- Store the current daily bar time
      g_lastDailyBar = currentDailyBar;

      //--- Recalculate and redraw all pivot levels
      DrawAllPivots();
     }
   else
     {
      //--- Otherwise, simply extend today's pivot lines forward
      datetime t2 = TimeCurrent() + PeriodSeconds(PERIOD_D1);

      //--- Names of today's pivot levels
      string names[7] = {"P", "R1", "S1", "R2", "S2", "R3", "S3"};

      //--- Update each of today's pivot lines
      for(int k = 0; k < 7; k++)
        {
         //--- Construct the object name for today's pivot level
         string lineName = g_prefix + "0_" + names[k];

         //--- If the object exists, move its second anchor point
         //--- further into the future
         if(ObjectFind(0, lineName) >= 0)
            ObjectSetInteger(0, lineName, OBJPROP_TIME, 1, t2);
        }
     }

   return(rates_total);
  }
//+------------------------------------------------------------------+
Explanation:
To ensure chart cleanliness, all objects created by the indicator are deleted using the DeleteAllObjects() function. This step is important because pivot calculations are updated regularly, and without removing previous objects, the chart would contain multiple overlapping lines and labels. The function begins by counting the total number of chart objects currently displayed. It then processes each object in reverse order, starting from the latest created. This reverse loop allows safe deletion and prevents indexing issues during the cleanup process.
The function then obtains the name of each object encountered and determines if it is part of this indicator. This is accomplished by matching the object name with the indicator's predetermined prefix. The pivot system only includes items that have this prefix. The item is removed from the chart if a match is discovered. This guarantees that additional indicators or manually drawn objects remain intact while only pivot-related items are eliminated.
The DrawAllPivots() function initiates this cleanup procedure before drawing new pivot levels. By doing this, the indicator avoids duplication and maintains the accuracy and organization of the display by ensuring that each update begins with a clean chart state. OnDeinit() calls DeleteAllObjects() to remove all pivot objects when the indicator is unloaded. To instantly update the visual output, ChartRedraw(0) refreshes the chart after removal.
The "else" block handles what happens when the indicator is already running and no new trading day has started. Instead of recalculating all pivot values again, it focuses only on keeping the current day’s pivot lines properly extended as new price data comes in. In this case, a future time value is first calculated by adding one full daily period to the current time. This creates an extended endpoint for today’s pivot lines, ensuring they continue stretching forward as the market progresses.
The indicator then defines an array with the names of every pivot level for the current day, including the primary pivot point and every level of support and resistance. This enables the code to handle each level in a structured loop rather than one at a time.
The loop then goes through each level, creates the exact object name for that specific pivot line, and checks if it exists on the chart. If the object is found, only its second anchor point is updated to the new future time. This effectively extends the horizontal line forward without changing its price level. By avoiding needless recalculations or redraw processes, this strategy guarantees that the pivot lines stay visually continuous throughout the trading day, improving the indicator's responsiveness and efficiency.
Conclusion
By following the implementation steps in this article, you obtain a working MQL5 blueprint for “Daily Pivot Points (Traditional)” that translates classic pivot formulas into a usable charting tool. The delivered indicator:
- reads prior daily High, Low, and Close for multiple historical sessions;
- computes P and R1–R3 / S1–S3 and draws them as horizontal trend lines on the main chart (no indicator buffers);
- uses a prefix-based naming scheme to manage its objects, enabling clean deletion and avoiding interference with other chart drawings;
- exposes inputs for the number of historical pivots, colors, line width, and optional labels/prices;
- restricts execution to timeframes ≤ D1, recalculates only when a new D1 candle appears, and otherwise only extends current-day lines forward.
Warning: All rights to these materials are reserved by MetaQuotes Ltd. Copying or reprinting of these materials in whole or in part is prohibited.
This article was written by a user of the site and reflects their personal views. MetaQuotes Ltd is not responsible for the accuracy of the information presented, nor for any consequences resulting from the use of the solutions, strategies or recommendations described.

 Measuring What Matters (Part 2): Building the Covariance Matrix: Eigenvalue Decomposition and Risk Factor Analysis in MQL5
 Market Simulation: Position View (III)
 MQL5 Trading Tools (Part 40): Adding SQLite Persistence and Per-Timeframe Visibility to the Canvas Drawing Layer
 From Basic to Intermediate: Working with Files in the MetaTrader 5 Sandbox

- Free trading apps
- Over 8,000 signals for copying
- Economic news for exploring financial markets
You agree to website policy and terms of use