
Price Action Analysis Toolkit Development (Part 69): Flag Pattern Detection in MQL5

Contents
- Introduction
- Understanding Flag Patterns and Market Structure
- MQL5 Implementation
- Outcomes
- Conclusion
Introduction
Recognizing flag patterns visually is straightforward in hindsight. In real time, detection requires structured, rule-based validation due to market noise, uneven consolidations, and premature breakouts. Without measurable rules for pole strength, retracement depth, consolidation duration, and breakout confirmation, an automated detector may miss valid setups. It may also produce many weak or overlapping patterns. This requires a structured detection model. It should evaluate continuation behavior using reproducible quantitative criteria (volatility normalization, retracement thresholds, consolidation constraints, and breakout confirmation) rather than subjective visual interpretation.
In this article, we develop an MQL5 flag pattern detector designed specifically for real-time chart analysis and visualization in MetaTrader 5. The implementation identifies bullish and bearish flag formations by combining ATR-normalized pole validation, retracement filtering, consolidation analysis, breakout confirmation, and overlap control into a single detection pipeline. Once a valid structure is confirmed, the indicator automatically draws the flagpole, slanted channel, shaded consolidation zone, breakout arrow, and labels directly on the chart while optionally generating alerts for newly detected patterns.
Understanding Flag Patterns and Market Structure
What Is a Flag Pattern?
A flag pattern is a continuation structure that forms during temporary market equilibrium after a strong impulsive move. It reflects a pause in directional momentum rather than a reversal, and is typically characterized by volatility contraction, controlled retracement, and eventual breakout continuation in the original trend direction.
This structure reflects a short period of market balance after strong momentum. Buyers or sellers briefly slow down, price compresses into a narrow range, and volatility contracts before momentum resumes. Flag patterns are widely regarded as continuation patterns because they suggest that the dominant market direction remains intact despite the temporary pause. Once price breaks beyond the consolidation boundary, momentum often resumes in the direction of the original trend.
There are two primary types of flag patterns: the Bullish Flag and the Bearish Flag. The bullish flag forms after a strong upward impulse and represents a temporary downward-sloping consolidation before continuation higher. The bearish flag forms after a strong downward impulse and develops as a temporary upward-sloping consolidation before continuation lower.
Below, we will examine both formations in detail, including their structural behavior and continuation dynamics.
Bullish and Bearish Flag Patterns
Bullish Flag Pattern
A bullish flag forms after a strong upward impulse (flagpole), followed by a controlled downward or sideways consolidation phase.
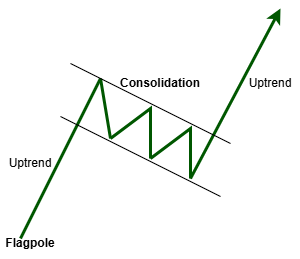
This consolidation represents temporary profit-taking and liquidity absorption before potential continuation to the upside once price breaks above resistance.
Bearish Flag Pattern
A bearish flag forms after a strong downward impulse, followed by a temporary upward or sideways consolidation phase.
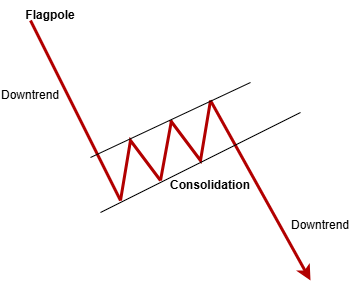
This phase represents short-term market balance and absorption before continuation lower once price breaks below support.
In both cases, the consolidation phase typically exhibits decreasing volatility and reduced directional efficiency, which distinguishes it from reversal patterns such as double tops or head and shoulders formations. This distinction is critical for algorithmic classification.
Recognizing a Flag Pattern
Although flag patterns can vary in appearance, they usually contain three core elements:
- A strong impulsive move that forms the flagpole.
- A controlled consolidation that slopes against the original trend or moves sideways.
- A breakout that resumes the direction of the initial momentum.

The consolidation phase is generally smaller than the pole itself and tends to develop within a relatively tight range. This compressed structure is what gives the pattern its characteristic flag appearance on the chart.
Formation Dynamics
Flag patterns develop through a sequence of market events that reflect momentum, temporary balance, and continuation:
1. Strong Directional Expansion
The pattern begins with a powerful bullish or bearish move that creates the flagpole. This phase is usually characterized by strong momentum and increased market participation.
2. Temporary Consolidation
After the impulsive move, price slows down and enters a controlled consolidation phase. During this period, traders may take profits, reduce exposure, or wait for further confirmation before re-entering the market.
3. Volatility Contraction
As consolidation develops, price movement typically becomes tighter and more structured. The market shifts into a temporary equilibrium where momentum pauses but does not necessarily reverse.
4. Breakout and Trend Continuation
If the dominant market pressure remains intact, price eventually breaks out of the consolidation region in the direction of the original trend, completing the flag continuation structure.
MQL5 Implementation
The Flag_Pattern_Detector is a specialized tool designed to identify and visually highlight flag formations within market data directly on the trading chart. Unlike traditional oscillators or buffer-based indicators, this system operates as a fully graphical pattern recognition engine. It does not generate numerical signal buffers. Instead, it builds real-time geometric representations using chart objects. This design allows direct visual interpretation of market behavior without relying on abstract indicator values.
Properties and Indicator Setup
This indicator is configured to run within the main chart window, ensuring that all visual elements are embedded directly onto the trading chart for seamless integration. It does not generate standard indicator buffers or plots, as its primary function is graphical. The implementation sets _indicator_buffers = 0 and _indicator_plots = 0 , which prevents default plotting and ensures fully graphical output. Instead, all pattern visualizations—such as trendlines, rectangles, breakout arrows, and descriptive labels—are created dynamically during execution.
#property copyright "Copyright 2026, Christian Benjamin."
#property link      "https://www.mql5.com/en/users/lynnchris"
#property version   "1.0"
#property indicator_chart_window
#property indicator_buffers 0
#property indicator_plots   0
This design choice offers maximum flexibility, allowing for customized styling, positioning, and visibility of each graphical element based on real-time data, without cluttering the chart with unnecessary plots.
User Inputs and Customization Options
To support different trading approaches and user preferences, the indicator includes a wide range of customizable input parameters. The LookbackBars setting defines the number of historical bars scanned during initialization, allowing the system to perform a detailed review of recent market activity. The MinPoleATR parameter specifies the minimum pole size in ATR multiples, effectively filtering out weak price movements that do not meet the requirements of a reliable flag formation.
//--- input parameters
input int      LookbackBars      =2000;        // Bars to scan backward (first load only)
input double   MinPoleATR        =1.0;         // Minimum flagpole size (ATR multiple)
input double   MaxRetracePercent =61.8;        // Max retracement of flag (% of pole)
input int      MinFlagBars       =4;           // Minimum flag duration
input int      MaxFlagBars       =0;           // Max flag duration (0 = no limit)
input bool     DebugMode         =true;        // Print detected flags to Experts tab
input color    BullFlagColor     =clrDodgerBlue;
input color    BearFlagColor     =clrTomato;

//--- alert parameters
input bool     EnableAlerts      =true;        // Popup alert on new flag
input bool     EnableSound       =false;       // Play a sound file
input string   SoundFile         ="alert.wav"; // Sound file name (terminal/Sounds)
input bool     EnableNotification=false;       // Push notification to mobile
input bool     EnableEmail       =false;       // Send email alert
Pattern quality is further refined through the MaxRetracePercent parameter, which restricts how much of the pole may be retraced before the setup is considered invalid. The MinFlagBars and MaxFlagBars settings control the minimum and maximum duration of the flag structure, preventing the detection of formations that are unrealistically short or excessively prolonged.
Additional options include debug output and customizable colors for bullish and bearish flags to improve readability. The indicator also provides a flexible alert system through EnableAlerts, EnableSound, EnableNotification, and EnableEmail, ensuring traders can receive real-time notifications whenever new flag patterns are identified, allowing for faster decision-making and timely market responses.
The parameterization of the system is designed to enforce strict structural filtering of price action. By combining volatility-based thresholds (ATR multipliers) with percentage-based retracement limits, the model ensures that only statistically significant impulsive moves qualify as valid flagpoles. This reduces noise sensitivity and improves pattern reliability across different market conditions.
Structures for Pattern Management
The implementation employs two primary data structures to manage detected patterns effectively. The first is DrawnFlag, which stores details of patterns that have already been visualized on the chart. This includes information such as start and end bars for the pole and flag, timestamps, and whether the pattern is bullish or bearish. This prevents the same pattern from being drawn multiple times, maintaining chart clarity.
//--- structures
struct DrawnFlag
  {
   int               poleStart;
   int               poleEnd;
   int               flagStart;
   int               flagEnd;
   datetime          startTime;
   datetime          endTime;
   bool              isBull;
  };

struct ActiveFlag
  {
   int               poleStart;
   int               poleEnd;
   int               flagStart;
   int               lastUpdate;
   bool              isBull;
   double            poleHigh;
   double            poleLow;
   double            poleLength;
   double            extreme;
   int               pullbacks;
   int               pushes;
   datetime          poleStartTime;
   datetime          poleEndTime;
  };

DrawnFlag   drawnFlags[];
ActiveFlag  activeFlags[];
int         atrHandle;
double      atrBuffer[];
The second data structure is ActiveFlag, which tracks ongoing, unbroken patterns that are still in the process of forming or confirming. It records similar information but also includes real-time metrics like the highest high or lowest low of the pole, the pole's length, extreme points, and counts of pullbacks and pushes within the pattern. Managing these two structures separately allows the system to monitor, update, and eventually record patterns that are in progress or completed, providing a comprehensive overview of pattern dynamics.
Initialization: Setting Up Resources
When the indicator is loaded, the OnInit() function is called to initialize necessary resources and handles. It creates a handle for the Average True Range (ATR) indicator using the iATR() function, which provides a volatility measure crucial for validating the significance of potential pattern poles. If creating this handle fails, the initialization process is halted to prevent errors during runtime.
//+------------------------------------------------------------------+
//| Initialization                                                   |
//+------------------------------------------------------------------+
int OnInit()
  {
   atrHandle=iATR(_Symbol,PERIOD_CURRENT,20);
   if(atrHandle==INVALID_HANDLE)
      return INIT_FAILED;

   if(DebugMode)
      Print("Flag Detector v1.0 loaded on ",_Symbol);

   return INIT_SUCCEEDED;
  }
Furthermore, if debug mode is enabled, a message is printed to the Experts tab confirming that the indicator has successfully loaded. During this phase, graphical objects such as trendlines, rectangles, arrows, and labels are not yet created; instead, they are dynamically generated during pattern detection. This resource setup ensures efficiency, proper resource management, and readiness for real-time pattern detection.
Deinitialization and Resource Cleanup
When the indicator is removed from the chart or the terminal is closed, the OnDeinit() function is executed to release resources and clean up graphical objects. Proper deinitialization is important in graphical indicators because multiple chart objects and indicator handles are created dynamically during runtime.
//+------------------------------------------------------------------+
//| Deinitialization                                                 |
//+------------------------------------------------------------------+
void OnDeinit(const int reason)
  {
   if(atrHandle!=INVALID_HANDLE)
      IndicatorRelease(atrHandle);

   ObjectsDeleteAll(0,"Flag_");
   ArrayFree(drawnFlags);
   ArrayFree(activeFlags);
  }
The ATR handle is released using IndicatorRelease() to free resources. The chart objects created by the indicator are then removed using ObjectsDeleteAll() with the "Flag_" prefix, which is the intended MQL5 approach for deleting objects by name prefix on the current chart.
Main Calculation: Pattern Detection Logic
The OnCalculate() function implements a dual-phase processing model consisting of historical initialization and incremental real-time updates. This separation ensures computational efficiency by performing full historical scanning only once, followed by lightweight updates on new price data.
The function begins by copying ATR values for the entire range of recent bars, establishing a volatility baseline to evaluate pattern significance. It then performs a backward scan over the recent bars to identify strong directional moves, referred to as poles. These poles are detected based on the cumulative upward or downward price movements over three bars, which are then compared against the ATR-based threshold specified by MinPoleATR.
Once a potential pole is identified, the code searches forward for a breakout in the opposite direction, indicating a possible flag pattern. It verifies that the retracement from the pole’s high or low does not exceed the maximum percentage specified by MaxRetracePercent.
//+------------------------------------------------------------------+
//| OnCalculate – Main Processing Loop                               |
//+------------------------------------------------------------------+
int OnCalculate(const int32_t rates_total,
                const int32_t prev_calculated,
                const datetime &time[],
                const double   &open[],
                const double   &high[],
                const double   &low[],
                const double   &close[],
                const long     &tick_volume[],
                const long     &volume[],
                const int32_t  &spread[])
  {
   if(CopyBuffer(atrHandle,0,0,rates_total,atrBuffer)!=rates_total)
      return 0;

   if(prev_calculated==0)
     {
      //--- first run: scan for completed historical flags
      ScanHistoricalFlags(rates_total,open,high,low,close,time);

      //--- scan for active (unfinished) flags
      int activeScanStart=MathMax(0,rates_total-LookbackBars);
      for(int i=activeScanStart; i<=rates_total-MinFlagBars-1; i++)
        {
         int  moveStart,moveEnd;
         bool isBullMove;
         if(FindThreeBarMove(i,rates_total,open,close,atrBuffer,moveStart,moveEnd,isBullMove))
            TryAddActiveFlag(moveStart,moveEnd,isBullMove,high,low,time,rates_total);
        }
     }
   else
     {
      int newBars=rates_total-prev_calculated;
      if(newBars>0)
        {
         //--- update existing active flags
         for(int i=ArraySize(activeFlags)-1; i>=0; i--)
           {
            bool remove=false;
            for(int bar=prev_calculated; bar<rates_total; bar++)
              {
               if(UpdateActiveFlag(i,high,low,close,time,bar,rates_total))
                 {
                  remove=true;
                  break;
                 }
              }
            if(remove)
               RemoveActiveFlag(i);
           }

         //--- scan recent bars for new flagpoles
         int newPoleScanStart=MathMax(0,rates_total-5);
         for(int i=newPoleScanStart; i<=rates_total-3; i++)
           {
            int  moveStart,moveEnd;
            bool isBullMove;
            if(FindThreeBarMove(i,rates_total,open,close,atrBuffer,moveStart,moveEnd,isBullMove))
               TryAddActiveFlag(moveStart,moveEnd,isBullMove,high,low,time,rates_total);
           }
        }
     }

   return rates_total;
  }
After the initial historical scan (prev_calculated == 0) completes, the indicator switches into real-time processing mode using the prev_calculated parameter. In this mode, it performs incremental updates rather than full-chart recalculation, which is the intended MQL5 pattern for efficient indicator processing. The real-time branch updates active patterns, checks new bars for breakout or invalidation, and scans only the newest price area for fresh flagpoles. This keeps the indicator responsive while avoiding unnecessary repeated calculations.
During historical initialization, the system performs exhaustive pattern discovery across the defined lookback window. This ensures that all valid structures are identified before transitioning into real-time mode.
In MQL5, prev_calculated is the previous return value of OnCalculate(), and the platform specifically uses it to support economical recalculation of only the bars that have changed.
The real-time branch performs three key operations:
- Active Flag Updates
Existing active patterns stored in activeFlags[] are continuously updated using the UpdateActiveFlag() function. Each new bar is evaluated to check for retracement continuation, invalidation conditions, or breakout confirmation.
- Breakout Detection and Cleanup
When a breakout condition is confirmed, the pattern is immediately rendered on the chart using DrawSlantedPattern(), recorded in drawnFlags[], and then removed from the active tracking array if necessary.
- Micro Pole Re-Scanning (Recent Bars Only)
The system performs a lightweight scan of the most recent bars (approximately last 5 bars) to detect newly forming flagpoles. This ensures that emerging patterns are captured quickly without repeating full historical analysis.
This incremental processing model ensures that the indicator remains responsive, efficient, and suitable for real-time trading environments while maintaining full structural validation of patterns. In real-time mode, computation is restricted to newly formed bars and active pattern updates. This minimizes redundant processing and ensures the indicator remains responsive even on lower timeframes such as M1 and M5.
To ensure pattern validity, it also checks that the duration of the pattern conforms to the minimum and maximum flag bar constraints (MinFlagBars and MaxFlagBars). Counts of pullbacks and pushes within the pattern are analyzed to confirm internal consistency.
Utility Functions and Visualization
DrawSlantedPattern()
The function DrawSlantedPattern() creates the full visual structure of a confirmed flag pattern on the chart. It draws the flagpole, builds the consolidation channel, highlights the pattern zone, places the breakout arrow, and adds a text label so the setup is easy to identify at a glance.
The consolidation channel is built from dynamically selected highs and lows inside the flag area. For bullish flags, the channel slopes downward after the impulsive rise; for bearish flags, it slopes upward after the decline. Allowing the structure to follow the market rather than forcing a fixed template.
//+------------------------------------------------------------------+
//| Draw completed flag pattern                                      |
//+------------------------------------------------------------------+
void DrawSlantedPattern(int poleStart,int poleEnd,int flagStart,int flagEnd,bool isBull,
                        const double &high[],const double &low[],const datetime &time[])
  {
//--- Build unique object name prefix for this pattern
   string prefix="Flag_"+IntegerToString(poleStart)+"_"+IntegerToString(poleEnd)+"_";
//--- Remove any previous drawings with the same prefix (to avoid clutter)
   ObjectsDeleteAll(0,prefix);

   int      endConsol=MathMax(flagStart,flagEnd-1);
   datetime startTime=time[flagStart];
   datetime endTime  =time[endConsol];
   color    clr      =isBull ? BullFlagColor : BearFlagColor;
   string   typeStr  =isBull ? "Bullish Flag" : "Bearish Flag";

//--- 1. Draw the flagpole as a solid line from the start to the end of the impulsive move
   ObjectCreate(0,prefix+"pole",OBJ_TREND,0,
                time[poleStart],isBull ? low[poleStart] : high[poleStart],
                time[poleEnd],  isBull ? high[poleEnd]  : low[poleEnd]);
   ObjectSetInteger(0,prefix+"pole",OBJPROP_COLOR,clr);
   ObjectSetInteger(0,prefix+"pole",OBJPROP_WIDTH,2);
   ObjectSetInteger(0,prefix+"pole",OBJPROP_RAY_RIGHT,false);

//--- 2. Construct a slanted parallel channel that encloses the consolidation
//--- The channel slope is estimated from two anchor points inside the consolidation
   int    half=flagStart+(endConsol-flagStart)/2;
   double upperStart,upperEnd,lowerStart,lowerEnd;

//--- Bull flag: channel slopes downward
   if(isBull)
     {
      //--- Find the highest high in the first half and second half for slope calculation
      int    idxHighFirst=flagStart;
      int    idxHighSecond=half+1;
      double highFirst   =high[flagStart];
      double highSecond  =(half+1<=endConsol) ? high[half+1] : high[flagStart];

      for(int i=flagStart+1; i<=half && i<=endConsol; i++)
        {
         if(high[i]>highFirst)
           {
            highFirst   =high[i];
            idxHighFirst=i;
           }
        }

      for(int i=half+2; i<=endConsol; i++)
        {
         if(high[i]>highSecond)
           {
            highSecond   =high[i];
            idxHighSecond=i;
           }
        }

      //--- If the second high is equal to or above the first, force a slight downward tilt
      if(highSecond>=highFirst)
         highSecond=highFirst-(highFirst-FindMinInRange(flagStart,endConsol,low))*0.1;

      //--- Calculate the slope of the upper line
      double slope=0;
      if(time[idxHighSecond]!=time[idxHighFirst])
         slope=(highSecond-highFirst)/(double)(time[idxHighSecond]-time[idxHighFirst]);

      //--- Extend the upper line across the whole consolidation period
      upperStart=highFirst+slope*(startTime-time[idxHighFirst]);
      upperEnd  =highFirst+slope*(endTime  -time[idxHighFirst]);

      //--- Find the lowest low to anchor the lower channel line
      double lowestLow=FindMinInRange(flagStart,endConsol,low);
      int    idxLowest=flagStart;
      for(int i=flagStart+1; i<=endConsol; i++)
        {
         if(low[i]<lowestLow)
           {
            lowestLow=low[i];
            idxLowest=i;
           }
        }

      //--- Create the lower line parallel to the upper line
      lowerStart=lowestLow+slope*(startTime-time[idxLowest]);
      lowerEnd  =lowestLow+slope*(endTime  -time[idxLowest]);

      //--- Push the lower line down if any low falls below it (ensures all bars are inside)
      for(int i=flagStart; i<=endConsol; i++)
        {
         double ratio  =(double)(time[i]-startTime)/(double)(endTime-startTime);
         double lineVal=lowerStart+(lowerEnd-lowerStart)*ratio;
         if(low[i]<lineVal)
           {
            double diff=lineVal-low[i]+_Point;
            lowerStart-=diff;
            lowerEnd  -=diff;
           }
        }
     }
//--- Bear flag: channel slopes upward
   else
     {
      //--- Find the lowest low in the first and second halves for slope calculation
      int    idxLowFirst=flagStart;
      int    idxLowSecond=half+1;
      double lowFirst   =low[flagStart];
      double lowSecond  =(half+1<=endConsol) ? low[half+1] : low[flagStart];

      for(int i=flagStart+1; i<=half && i<=endConsol; i++)
        {
         if(low[i]<lowFirst)
           {
            lowFirst   =low[i];
            idxLowFirst=i;
           }
        }

      for(int i=half+2; i<=endConsol; i++)
        {
         if(low[i]<lowSecond)
           {
            lowSecond   =low[i];
            idxLowSecond=i;
           }
        }

      //--- Force a slight upward tilt if the second low is equal to or below the first
      if(lowSecond<=lowFirst)
         lowSecond=lowFirst+(FindMaxInRange(flagStart,endConsol,high)-lowFirst)*0.1;

      //--- Calculate slope of the lower line
      double slope=0;
      if(time[idxLowSecond]!=time[idxLowFirst])
         slope=(lowSecond-lowFirst)/(double)(time[idxLowSecond]-time[idxLowFirst]);

      //--- Extend the lower line across the consolidation
      lowerStart=lowFirst+slope*(startTime-time[idxLowFirst]);
      lowerEnd  =lowFirst+slope*(endTime  -time[idxLowFirst]);

      //--- Find the highest high to anchor the upper channel line
      double highestHigh=FindMaxInRange(flagStart,endConsol,high);
      int    idxHighest=flagStart;
      for(int i=flagStart+1; i<=endConsol; i++)
        {
         if(high[i]>highestHigh)
           {
            highestHigh=high[i];
            idxHighest =i;
           }
        }

      //--- Upper line parallel to lower line
      upperStart=highestHigh+slope*(startTime-time[idxHighest]);
      upperEnd  =highestHigh+slope*(endTime  -time[idxHighest]);

      //--- Push the upper line up if any high sticks out
      for(int i=flagStart; i<=endConsol; i++)
        {
         double ratio  =(double)(time[i]-startTime)/(double)(endTime-startTime);
         double lineVal=upperStart+(upperEnd-upperStart)*ratio;
         if(high[i]>lineVal)
           {
            double diff=high[i]-lineVal+_Point;
            upperStart+=diff;
            upperEnd  +=diff;
           }
        }
     }

//--- 3. Draw the upper and lower channel lines (dashed and bold)
   ObjectCreate(0,prefix+"upper",OBJ_TREND,0,startTime,upperStart,endTime,upperEnd);
   ObjectSetInteger(0,prefix+"upper",OBJPROP_COLOR,clr);
   ObjectSetInteger(0,prefix+"upper",OBJPROP_WIDTH,3);
   ObjectSetInteger(0,prefix+"upper",OBJPROP_STYLE,STYLE_DASH);
   ObjectSetInteger(0,prefix+"upper",OBJPROP_RAY_RIGHT,false);

   ObjectCreate(0,prefix+"lower",OBJ_TREND,0,startTime,lowerStart,endTime,lowerEnd);
   ObjectSetInteger(0,prefix+"lower",OBJPROP_COLOR,clr);
   ObjectSetInteger(0,prefix+"lower",OBJPROP_WIDTH,3);
   ObjectSetInteger(0,prefix+"lower",OBJPROP_STYLE,STYLE_DASH);
   ObjectSetInteger(0,prefix+"lower",OBJPROP_RAY_RIGHT,false);

//--- 4. Fill the channel area with a lightened rectangle
   double rectHigh=MathMax(MathMax(upperStart,upperEnd),MathMax(lowerStart,lowerEnd));
   double rectLow =MathMin(MathMin(upperStart,upperEnd),MathMin(lowerStart,lowerEnd));
   color  fillClr =ColorLighter(clr,70);
   ObjectCreate(0,prefix+"rect",OBJ_RECTANGLE,0,startTime,rectHigh,endTime,rectLow);
   ObjectSetInteger(0,prefix+"rect",OBJPROP_COLOR,fillClr);
   ObjectSetInteger(0,prefix+"rect",OBJPROP_FILL,true);
   ObjectSetInteger(0,prefix+"rect",OBJPROP_BACK,true);
   ObjectSetInteger(0,prefix+"rect",OBJPROP_WIDTH,1);

//--- 5. Place a breakout arrow at the end of the flag
   if(isBull)
      ObjectCreate(0,prefix+"arrow",OBJ_ARROW_UP,  0,time[flagEnd],low[flagEnd] -10*_Point);
   else
      ObjectCreate(0,prefix+"arrow",OBJ_ARROW_DOWN,0,time[flagEnd],high[flagEnd]+10*_Point);

   ObjectSetInteger(0,prefix+"arrow",OBJPROP_COLOR,clr);
   ObjectSetInteger(0,prefix+"arrow",OBJPROP_WIDTH,2);

//--- 6. Add a simple text label in the middle of the channel
   int    midIdx    =(flagStart+endConsol)/2;
//--- Place label slightly above the channel (bull) or below (bear)
   double labelPrice=isBull ? rectHigh+(rectHigh-rectLow)*0.15 : rectLow-(rectHigh-rectLow)*0.15;
   ObjectCreate(0,prefix+"label",OBJ_TEXT,0,time[midIdx],labelPrice);
   ObjectSetString(0,prefix+"label",OBJPROP_TEXT,    typeStr);
   ObjectSetInteger(0,prefix+"label",OBJPROP_COLOR,   clr);
   ObjectSetInteger(0,prefix+"label",OBJPROP_FONTSIZE,9);
   ObjectSetInteger(0,prefix+"label",OBJPROP_BACK,    true);
  }
For bullish flags, the channel slopes downward after the impulsive rise; for bearish flags, it slopes upward after the decline. The upper and lower boundaries are calculated from the internal price structure of the flag, allowing the channel to adapt to market movement instead of relying on a fixed template.
To improve readability, the channel lines are drawn with dashed styling and increased width, while the consolidation zone is highlighted with a lightened rectangle. A breakout arrow marks the confirmation candle, and a text label identifies the pattern direction. The result is a geometrically consistent and structurally adaptive visual representation of market behavior.
IsTooClose() and RecordDrawnFlag()
The IsTooClose() function prevents the same flag from being drawn more than once by checking whether the newly detected start and end bars match a previously recorded pattern. This keeps the chart clear and avoids repeated markings of the same setup.
//+------------------------------------------------------------------+
//| Store confirmed pattern                                          |
//+------------------------------------------------------------------+
void RecordDrawnFlag(int poleStart,
                     int poleEnd,
                     int flagStart,
                     int flagEnd,
                     datetime startTime,
                     datetime endTime,
                     bool isBull)
  {
   int sz = ArraySize(drawnFlags);
   ArrayResize(drawnFlags, sz + 1);

   drawnFlags[sz].poleStart = poleStart;
   drawnFlags[sz].poleEnd   = poleEnd;
   drawnFlags[sz].flagStart  = flagStart;
   drawnFlags[sz].flagEnd    = flagEnd;
   drawnFlags[sz].startTime  = startTime;
   drawnFlags[sz].endTime    = endTime;
   drawnFlags[sz].isBull     = isBull;
  }
The RecordDrawnFlag() function saves the confirmed pattern coordinates after a breakout has been validated. The stored data is later used to prevent duplicate detection and to keep completed patterns available for reference.
//+------------------------------------------------------------------+
//| Try to add an active flag                                        |
//+------------------------------------------------------------------+
bool TryAddActiveFlag(int poleStart,
                      int poleEnd,
                      bool isBull,
                      const double &high[],
                      const double &low[],
                      const datetime &time[],
                      int rates_total)
Active Pattern Management
TryAddActiveFlag() and RemoveActiveFlag()
The TryAddActiveFlag() function examines a newly detected pole and decides whether it should be tracked as an active pattern. It checks whether the structure has already been recorded, applies retracement and duration limits, and evaluates the internal consolidation behavior before adding the setup to active monitoring.
//+------------------------------------------------------------------+
//| Update active pattern                                            |
//+------------------------------------------------------------------+
bool UpdateActiveFlag(int index,
                      const double &high[],
                      const double &low[],
                      const double &close[],
                      const datetime &time[],
                      int newBar,
                      int rates_total)
If a breakout is confirmed, the pattern is drawn permanently on the chart, alerts are triggered if enabled, and the completed setup is recorded in the DrawnFlag array. Invalid or expired patterns are removed through the RemoveActiveFlag() function to ensure that only relevant formations remain under active monitoring.
//+------------------------------------------------------------------+
//| Remove active flag                                               |
//+------------------------------------------------------------------+
void RemoveActiveFlag(int index)
- RemoveActiveFlag() removes invalid or completed setups from active tracking so that only relevant patterns remain under observation.
Alerts and User Feedback
//+------------------------------------------------------------------+
//| Alert manager                                                    |
//+------------------------------------------------------------------+
void DoAlert(string msg,
             bool playSound,
             bool pushNote,
             bool sendMail)
  {
   //--- Check if alerts are enabled
   if(!EnableAlerts)
      return;

   //--- Display popup alert
   Alert(msg);

   //--- Play notification sound
   if(playSound)
      PlaySound(SoundFile);

   //--- Send push notification
   if(pushNote)
      SendNotification(msg);

   //--- Send email notification
   if(sendMail)
      SendMail("Flag Detector Alert", msg);
  }
The DoAlert() function handles notifications according to the user’s settings. It can display popup alerts, play a sound, send a mobile notification, or email the signal when a valid pattern is confirmed.
//+------------------------------------------------------------------+
//| Lighten a color                                                  |
//+------------------------------------------------------------------+
color ColorLighter(color clr, double percent)
  {
   percent = MathMax(0, MathMin(100, percent));

   double factor = percent / 100.0;

   uchar r = (uchar)((clr >> 16) & 0xFF);
   uchar g = (uchar)((clr >> 8)  & 0xFF);
   uchar b = (uchar)(clr & 0xFF);

   r = (uchar)(r + (255 - r) * factor);
   g = (uchar)(g + (255 - g) * factor);
   b = (uchar)(b + (255 - b) * factor);

   return (color)((r << 16) | (g << 8) | b);
  }
Additionally, the utility function ColorLighter() generates lightened fill color to highlight pattern areas subtly, improving visual clarity without obscuring underlying price data. These alerting and highlighting mechanisms are designed to be effective yet unobtrusive, helping traders stay aware of important pattern developments as they happen.
Outcomes
After successfully compiling the indicator in MetaEditor, the next essential step is to test its validity and performance. This validation process should be performed across a diverse set of currency pairs (e.g., majors, minors, and exotics) and multiple timeframes (from M1 to MN) under various market conditions to ensure robustness and reliability.
The evaluation of the indicator was performed based on structural clarity, breakout accuracy, and pattern consistency across multiple instruments and timeframes. The goal was not prediction accuracy in isolation, but robustness of pattern identification under varying market volatility conditions.
Backtesting
The GIF below shows the indicator in action during testing on EURUSD M5.
The indicator successfully detects and clearly visualizes both bullish and bearish flag patterns. As seen in the GIF, the flagpole, consolidation zone, and breakout arrows are all clearly marked. In most cases, the detected patterns deliver positive signals, as demonstrated in the backtest performed by scrolling through historical price action on the chart.
Live Performance

The image above presents a different test on the Step Index (M1). The indicator successfully identified a textbook Bearish Flag pattern. You can clearly see:
- The strong downward flagpole
- The sideways consolidation (flag) zone
- The breakout arrow confirming the continuation of the downtrend
Following the signal, two clear sell entries were generated.
Summary of Testing
These tests across different instruments (EURUSD and Step Index) and timeframes confirm that the indicator effectively detects both bullish and bearish flag patterns. The flagpole, consolidation zones, and breakout signals are clearly visualized, providing reliable pattern recognition. The strong performance observed in manual backtesting, combined with positive results during live market conditions, demonstrates the indicator’s robustness and validates its accuracy across varying market environments.
Conclusion
This article addressed a core challenge in price action trading: the difficulty of consistently detecting bullish and bearish flag patterns in live market conditions. Due to market noise, irregular consolidations, and premature breakouts, reliable real-time identification has traditionally relied on subjective visual judgment. The goal was to build a structured, rule-based MQL5 solution capable of automatically recognizing high-quality flag formations and presenting them clearly on the chart.
The Flag_Pattern_Detector delivers exactly that. It implements a complete detection pipeline using ATR-normalized pole validation, retracement filtering, consolidation structure analysis, internal momentum checks, and breakout confirmation. The indicator automatically:
- Scans for strong impulsive flagpoles using ATR multiples;
- Validates consolidation zones based on duration, depth, and internal behavior;
- Draws clean slanted channels, highlighted consolidation areas, flagpoles, and breakout arrows;
- Prevents overlapping or duplicate patterns while maintaining chart clarity;
- Provides real-time alerts and works efficiently across different instruments and timeframes.
The Flag_Pattern_Detector transforms subjective chart interpretation into a structured computational model for continuation pattern recognition. By combining volatility normalization, structural validation, and real-time graphical rendering, the system provides a consistent and scalable approach to detecting bullish and bearish flags across different market environments. This makes it suitable not only as a trading tool but also as a foundation for further algorithmic pattern recognition development.
Warning: All rights to these materials are reserved by MetaQuotes Ltd. Copying or reprinting of these materials in whole or in part is prohibited.
This article was written by a user of the site and reflects their personal views. MetaQuotes Ltd is not responsible for the accuracy of the information presented, nor for any consequences resulting from the use of the solutions, strategies or recommendations described.

- Free trading apps
- Over 8,000 signals for copying
- Economic news for exploring financial markets
You agree to website policy and terms of use