Custom Indicator: Plotting Partial Entry, Exit and Reversal Deals for Netting Accounts
Contents
- Introduction
- What is a netting account?
- Working with trading events
- Practical example of usage. Introduction
- Indicator properties
- Algorithm description
- Another practical example
- Integration with a trading Expert Advisor
- Conclusion
1. Introduction
When we talk about indicators, we can think of different functions: plotting (histograms, trend lines, arrows or bars), calculating data based on price and volume movements, and observing statistical patterns in our trades. However, in this article we will consider another way of constructing an indicator in MQL5. We will talk about how to manage your own positions, including entries, partial exits, etc. We will make extensive use of dynamic matrices and some trading functions related to trade history and open positions.
2. What is a netting account?
As the title of the article suggests, this indicator only makes sense to use on an account with a netting accounting system. In this system, only one position of the same symbol is allowed. If we trade in one direction, the position size will increase. If the trade is made in the opposite direction, then the open position will have three possible options:
- The new trade has a lower volume -> the position is decreased
- Volumes are equal -> the position is closed
- The new trade has a higher volume -> the position is reversed
For example, on a hedging account, we can make two one-lot EURUSD Buy trades, which will result in two different positions for the same instrument. Making two one-lot EURUSD Buy trades on a netting account will result in the creation of a single two-lot position with the weighted average price of the two trades. Since the volumes of both trades were equal, the position price is the arithmetic mean of the prices of each of the trades.
This calculation is performed as follows:

We have an average price (P) weighted by the volume (N) in lots for each trade.
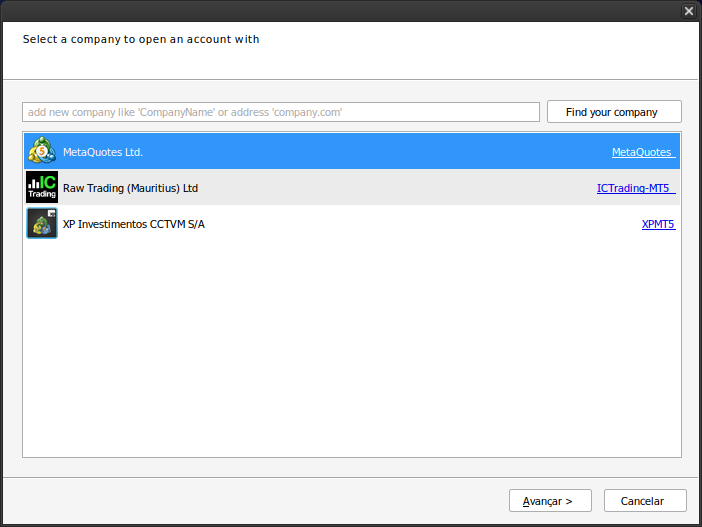
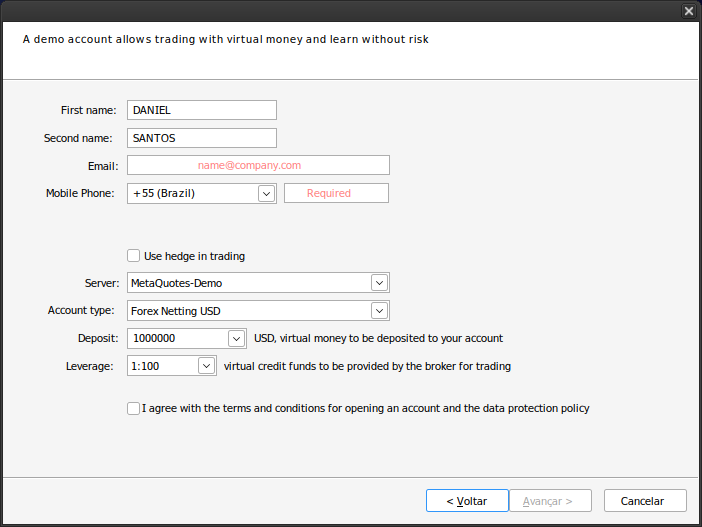
For more detailed information on the differences between the systems, I recommend reading the article written by MetaQuotes: "MetaTrader 5 features hedging position accounting system". From this point on, in this article we will look at all the operations performed on a netting account. If you don't have such an account yet, you can open a free demo account with MetaQuotes as shown below.
In MetaTrader 5, click File > Open Account:

Once the demo account is opened, click the Continue button and leave the "Use hedge in trading" option unchecked.

3. Working with trading events
Operations with trading events are required for managing orders, trades, and positions. Trading orders can be instant or pending, and once an order is executed, trades are generated that can open, close or modify a position.
Indicators are not allowed to use functions such as OrderSend(), but they can interact with the trading history and position properties. Using the OnCalculate function, an indicator can get such kind of information as opening price, closing price, volume, etc. Although the OnTrade() function is used primarily in Expert Advisors, it is also applicable to indicators, as they can detect trade events outside the strategy tester, making updating chart objects faster and more efficient.
4. Practical example of usage. Introduction
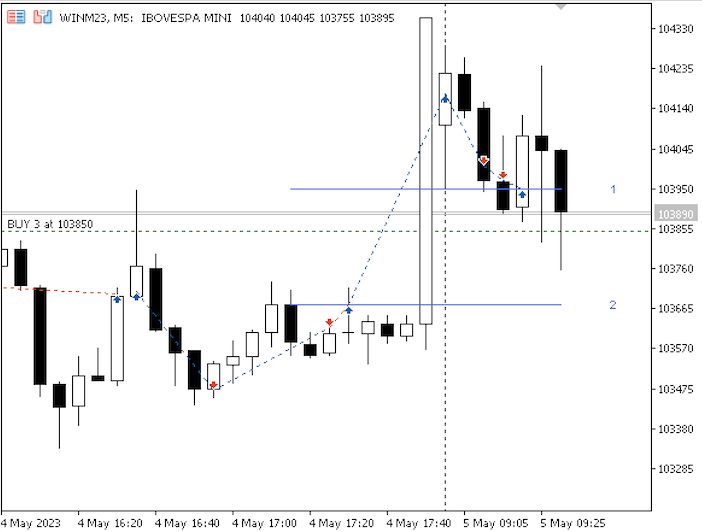
The image below shows a practical example of using the custom indicator we are developing. There's a three-lot buy position that comes from a larger trade that had several partial entries and exits (and even reversals). This explains the apparent discrepancy between the average price shown on the chart and the quoted prices, as well as the lot sizes. By monitoring trading events, you can understand the criteria by which the algorithm removes lines and updates the number of lots on the screen as partial exits occur.

5. Indicator properties
At the beginning of description, it is necessary to specify indicators properties. Our indicator has the following properties:
#property indicator_chart_window               // Indicator displayed in the main window
#property indicator_buffers 0                  // Zero buffers
#property indicator_plots   0                  // No plotting
//--- plot Label1
#property indicator_label1  "Line properties"
#property indicator_type1   DRAW_LINE          // Line type for the first plot
#property indicator_color1  clrRoyalBlue       // Line color for the first plot
#property indicator_style1  STYLE_SOLID        // Line style for the first plot
#property indicator_width1  1                  // Line width for the first plot
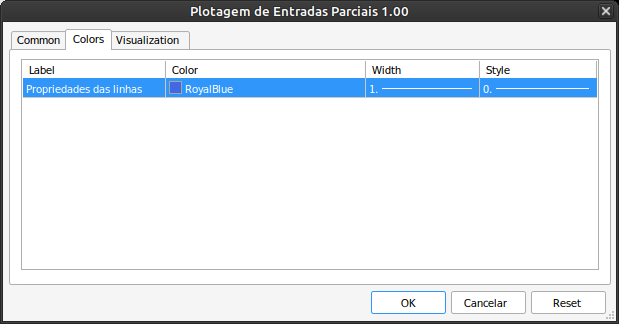
This code affects information displayed on the indicator loading screen where initial parameters are requested.

6. Algorithm description
The OnInit() function, executed at the beginning of the program, is responsible for initializing an array of type double called "Element", which acts as the actual indicator buffer. This array consists of three columns, and each index stores the price (0), volume (1), and ticket number (2). Each row of this array corresponds to some trade in history. If the initialization is successful, i.e. it is confirmed that the account is not a hedge account, the OnTrade() function is triggered next. If an error occurs during initialization, the indicator is closed and removed from the chart.
See:
int OnInit()
  {
   ArrayResize(Element,0,0);
   int res=INIT_SUCCEEDED;
   if(AccountInfoInteger(ACCOUNT_MARGIN_MODE)==ACCOUNT_MARGIN_MODE_RETAIL_HEDGING)
      res=INIT_FAILED;
   else
      OnTrade();
   return(res);
  }
After initialization, the OnTrade() function is triggered natively by the OnCalculate() function when trading events occur. To ensure it is triggered only once and only when a new candlestick is formed, we add a filter using the isNewBar function and the isOldBar Boolean variable. Thus, the OnTrade function is activated in three cases: upon initialization, when a there is a new candlestick, and at each trading event. These processes provide reading, processing and storing of events in the Element array, which is then displayed as graphic objects on the screen in the form of lines and text.
The OnTrade() function updates the key variables of the trading algorithm. It starts with a datetime variable called "date" which stores the start time of the selection from the order history. If there is no open position at the start of the program, the "date" variable is updated with the open time of the current candlestick.
When a trade is executed, the PositionsTotal() function returns a value greater than zero and, through a loop, filters out the positions of the symbol corresponding to the chart on which the indicator is running. The history is then selected and the executed orders corresponding to the position ID are retrieved. The "date" variable is updated with the oldest time of these orders, which corresponds to the time the ID was created.
If a second position appears with a different ID, you need to check if there are graphic elements to be removed by the ClearRectangles() function to make sure everything is up to date. After that we set the size of the Element array to zero, which removes the data it contains. If there are no open positions, the function also activates the ClearRectangnles() function and resets the Element array. The "date" variable stores the value of the last known server time, i.e. the current time. Finally, the remaining value of the "date" variable is passed to the ListOrdersPositions() function.
void
 OnTrade()
  {
//---
   static datetime date=0;
   if(date==0)
      date=lastTime;
   long positionId=-1,numberOfPositions=0;
   for(int i=PositionsTotal()-1; i>=0; i--)
      if(m_position.SelectByIndex(i))
         if(m_position.Symbol()==ativo000)
           {
            numberOfPositions++;
            positionId=m_position.Identifier();
            oldPositionId=positionId;
           }
   if(numberOfPositions!=0)
     {
      //Print("PositionId: "+positionId);
      HistorySelectByPosition(positionId);
      date=TimeCurrent();
      for(int j=0; j<HistoryDealsTotal(); j++)
        {
         ulong ticket = HistoryDealGetTicket(j);
         if(ticket > 0)
            if(HistoryDealGetInteger(ticket,DEAL_TIME)<date)
               date=(datetime)HistoryDealGetInteger(ticket,DEAL_TIME);
        }
      if(HistoryDealsTotal()==1 && (ArraySize(Element)/3)>1)
         if(ClearRectangles())
            ArrayResize(Element,0,0);
     }
   else
     {
      bool isClean=ClearRectangles();
      ArrayResize(Element,0,0);
      if(isClean)
        date=TimeCurrent();        // Do not use the array until there is new open position
      ArrayPrint(Element);         // If there are no errors, this function will not be called here: the array with zero size
     }
   ListOrdersPositions(date);
  }
The ListOrdersPositions() function plays an important role because it is responsible for activating the functions that add or remove entries from the Element array: the AddValue() and RemoveValue() functions. When receiving the parameter dateInicio, two options will be possible. If there is no trade history during the period specified for the HistorySelect(start, end) function, it will jump directly to the end of the history, calling the PlotRectangles() function, which updates the objects on the screen according to the contents of the Element array. But if there are deals in history, the HistoryDealsTotal() function should return a non-zero value. In this case, a new check is performed to study each deal found, classify it by entry type, collect information on price, volume and ticket number. Possible deal types: DEAL_ENTRY_IN, DEAL_ENTRY_OUT and DEAL_ENTRY_INOUT.
If the deal is an entry deal, then the AddValue function is activated. If it is an exit deal, then RemoveValue is activated with the following parameters: price, volume and ticket numbers received earlier. If we have a reversal, then the AddVolume() function is also triggered if the ticket number has not been previously entered into the array. In addition, price and volume parameters are passed, with the latter calculated as the difference between the collected volume and the volume of previous trades still present in the array.
This process simulates the reconstruction of a historical position: when we come across a reversal trade, the position is reversed and included in the array as if it were a new entry that adjusts the lot count. In addition, the lines that were on the screen up to this point are deleted. The Sort() function sorts the Element array in ascending order by the price column and removes from the chart objects whose values in column 1 (volume) of the array are zero. Finally, this function checks for inconsistencies and removes from the array rows that have indices 0 and 1 (price and volume) equal to zero.
void ListOrdersPositions(datetime dateInicio)
  {
//Analyze the history
   datetime inicio=dateInicio,fim=TimeCurrent();
   if(inicio==0)
      return;
   HistorySelect(inicio, fim);
   double deal_price=0, volume=0,newVolume;
   bool encontrouTicket;
   uint tamanhoElement=0;
   for(int j=0; j<HistoryDealsTotal(); j++)
     {
      ulong ticket = HistoryDealGetTicket(j);
      if(ticket <= 0)
         return;
      if(HistoryDealGetString(ticket, DEAL_SYMBOL)==_Symbol)
        {
         encontrouTicket=false;
         newVolume=0;            // Need to reset each 'for' loop
         volume=HistoryDealGetDouble(ticket,DEAL_VOLUME);
         deal_price=HistoryDealGetDouble(ticket,DEAL_PRICE);
         double auxArray[1][3] = {deal_price,volume,(double)ticket};
         if(HistoryDealGetInteger(ticket,DEAL_ENTRY)==DEAL_ENTRY_IN)
            AddValue(deal_price,volume,(double)ticket);
         if(HistoryDealGetInteger(ticket,DEAL_ENTRY)==DEAL_ENTRY_OUT)
            RemoveValue(deal_price,volume,(double)ticket);
         if(HistoryDealGetInteger(ticket,DEAL_ENTRY)==DEAL_ENTRY_INOUT)
           {
            tamanhoElement = ArraySize(Element)/3; //Always check the array size, it can vary with the Add/RemoveValue() functions
            for(uint i=0; i<tamanhoElement; i++)
               if(Element[i][2]==ticket)
                 {
                  encontrouTicket=true;
                  break;
                 }
            if(!encontrouTicket) // If after the previous scanning we don't find mentioning of the ticket in the array
              {
               for(uint i=0; i<tamanhoElement; i++)
                 {
                  newVolume+=Element[i][1];
                  Element[i][1]=0;
                 }
               newVolume=volume-newVolume;
               AddValue(deal_price,newVolume,double(ticket));
              }
           }
        }
     }
   PlotRectangles();
  }
7. Another practical example
The description of the algorithm presented above is sufficient for a clearer understanding of its operation. Let's now consider it in more detail using an example that shows the operations involved and the content of the most important variables. The trades are executed outside the strategy tester, and Trade events will be detected. We know that on a netting account, trades for each position have the same identifier, so we can filter them by this criterion. As an example, below are the events of a certain position:
| Time | Symbol | Deal | Type | Direction | Volume | Price |
|---|---|---|---|---|---|---|
| 2023.05.04 09:42:05 | winm23 | 1352975 | buy | in | 1 | 104035 |
| 2023.05.04 09:43:16 | winm23 | 1356370 | sell | in/out | 2 | 103900 |
| 2023.05.04 16:34:51 | winm23 | 2193299 | buy | out | 1 | 103700 |
| 2023.05.04 16:35:05 | winm23 | 2193395 | buy | in | 1 | 103690 |
| 2023.05.04 16:35:24 | winm23 | 2193543 | buy | in | 1 | 103720 |
| 2023.05.04 16:55:00 | winm23 | 2206914 | sell | out | 1 | 103470 |
| 2023.05.04 17:27:26 | winm23 | 2214188 | sell | in/out | 2 | 103620 |
| 2023.05.04 17:30:21 | winm23 | 2215738 | buy | in/out | 4 | 103675 |
| 2023.05.05 09:03:28 | winm23 | 2229482 | buy | in | 1 | 104175 |
| 2023.05.05 09:12:27 | winm23 | 2236503 | sell | out | 1 | 104005 |
| 2023.05.05 09:19:18 | winm23 | 2246014 | sell | out | 1 | 103970 |
| 2023.05.05 09:22:45 | winm23 | 2250253 | buy | in | 1 | 103950 |
| 2023.05.05 16:00:10 | winm23 | 2854029 | sell | out | 1 | 106375 |
| 2023.05.05 16:15:40 | winm23 | 2864767 | sell | out | 1 | 106275 |
| 2023.05.05 16:59:41 | winm23 | 2884590 | sell | out | 1 | 106555 |
Regardless of previous operations, at this point the Element array will have a size of zero and will have no open positions. At 09:42:05 on May 04, 2023, a one-lot Sell entry deal is executed (which is already recorded in the platform history), which immediately calls the OnTrade() function. Considering that MetaTrader 5 was launched on the computer a few minutes earlier (09:15 h), there was enough time for the date variable to update to 2023.05.04 09:15:00, and this value has been stored there since then. In OnTrade(), we go through the list of open positions. The account type we are using only allows one position per symbol. In this case it is WINM23. The numberOfPositions variable takes the value 1, and the positionID variable takes the value 1352975, which coincides with the ticket of the first deal, which, in turn, is the number of the order that created it. Now the date variable is updated with the time of the deal, and all future deals up to trade number 2193299 will receive the same time from the Identifier() function.
The function ListOrdersPositions(date) is triggered and selects the period from 09:42:05 to TimeCurrent() to retrieve the historical data. Within the loop, upon detecting an entry type "IN", the function AddValue() is called with the parameters price=104035, volume=1, and ticket=1352975. Since AddValue() does not find this ticket in the initially empty array, it inserts a new row containing the three provided values. The function ArrayPrint(Element) then displays this matrix in the terminal.
Next, the PlotRectangles() function is called, which saves the timestamps of both the current candlestick and the 15th previous candlestick. These values determine the line length to be plotted. The GetDigits() function defines the number of decimal places for the symbol's tick size (in this case, zero), which is used to generate the names of objects alongside the price values stored in the Element array. Rectangle and text objects are created as long as the corresponding price volume in the array is nonzero and the objects do not exist on the chart. If an object is already present, its attributes, such as color, text, and position, are updated. Although these rectangles technically function as lines (since they have no height), OBJ_RECTANGLE was initially chosen to enable a future feature for deleting all objects of this type when removing the chart. While this generic deletion mechanism was never implemented, the use of zero-height rectangles was retained. Thus, the row in the array corresponding to the buy deal 104035 is processed. Since its volume is nonzero and the object named "104035text" does not yet exist, the associated text and rectangle objects are created.
In the next minute, a Sell deal of two lots is executed. Since there was already one lot in the buy position, this results in a position reversal, leaving a short one-lot position. MetaTrader immediately adds this deal to the history records. The same processing logic applies as before, iterating through the order history loop. The deal with the ticket=1352975 appears again within the selected period and is passed to the AddValue() function. Since the function now finds this ticket in the sole existing array entry, it exits without adding a new entry. The next detected deal is of type "INOUT", and the only existing deal in the array has its Element[0][1] value stored in newVolume, which is then set to zero.
The transaction volume is calculated as HistoryDealGetDouble(ticket, DEAL_PRICE) - newVolume, and newVolume = 2 - 1 = 1. Consequently, AddValue(103900, 1, 135370) is executed, following the same logic. The function PlotRectangles() runs again, and after sorting the array in ascending order via Sort(), the first price in the array is now 103900. Since no objects for this price exist on the chart, they are created. The second array element (with the price 104035) already has its objects drawn, so its attributes are updated. At this stage, the Element array contains: {{103900,1,1356370}}, {104035,0,1352975}}.
As the process continues, a third deal appears, identified as an exit deal with price=103700, volume=1, and ticket=2193299. The exit deal triggers the RemoveValue() function with these parameters. RemoveValue() terminates if it encounters a zero volume or an existing row with the same ticket. Since these conditions are not met, the function proceeds to locate the price to be removed using ArrayBsearch(). It is a binary search algorithm that requires a sorted array (as ensured by Sort()). The closest index to 103700 is the first entry in the array. Since this row's volume is also one, it is zeroed out, triggering the RemoveRectangle() function, which removes the graphical objects associated with price 103900. Subsequently, AddValue() inserts the row {103700,0,219299}, which remains unchanged by Sort(). The position is now closed. At this stage, the Element array contains: {{103700,0,219299}}, {103900,0,1356370}}, {104035,0,1352975}}.
When a position is completely closed, the numberOfPositions variable is set to zero, and when ClearRectangles() is successfully executed, the isClean variable is set to true. The array is cleared, and date is updated to the current time. This means no orders will be returned for the newly defined period. The system waits for a new deal to continue passing to the array and processing subsequent actions. At this point, the Element array is empty: { }. This returns the system to a state similar to the one described at the beginning of this example. The same logic can be applied to understand the indicator behavior with subsequent deals. In the current example, the operation starts at price 103690, as referenced in "7. Another practical example". By carefully following each step, it becomes clear why the behavior described in that first example occurs. The explanation is linked to the exit deal prices and how the algorithm sequentially removes rows with prices closest to those of "DEAL_ENTRY_OUT" deals.
8. Integration with a trading Expert Advisor
There are two ways to use custom indicators like this one in the strategy tester. The first approach involves compiling an Expert Advisor (EA) or another indicator that calls the custom indicator. To do this, ensure that the compiled file "Plotagem de Entradas Parciais.ex5" is located in the "Indicators" folder. Then, insert the following lines of code into the OnInit() function of the caller. Before doing so, remember to declare the global variable handlePlotagemEntradasParciais as an int type:
   iCustom(_Symbol,PERIOD_CURRENT,"Plotagem de Entradas Parciais");
//--- if the handle is not created
   if(handlePlotagemEntradasParciais ==INVALID_HANDLE)
     {
      //--- Print an error message and exit with an error code
      PrintFormat("Failed to create indicator handle for symbol %s/%s, error code %d",
                  _Symbol,
                  EnumToString(_Period),
                  GetLastError());
      //--- The indicator is terminated prematurely
      return(INIT_FAILED);
     }
The second approach eliminates the need to modify these lines in the EA, making it a more convenient option for testing. Simply load the indicator onto the chart using the standard method, then save the template as "Tester.tpl" (overwriting an existing file with the same name if necessary). This ensures that the indicator is automatically loaded each time the EA is tested. Keep in mind that this method is only relevant when visual mode with chart display is enabled in the strategy tester.
9. Conclusion
We have created a custom indicator that plots partial entries to explore new ways of creating and utilizing indicators in MQL5, one of the most advanced and modern programming languages for MetaTrader 5, a leading trading platform.
Translated from Portuguese by MetaQuotes Ltd.
Original article: https://www.mql5.com/pt/articles/12576
Warning: All rights to these materials are reserved by MetaQuotes Ltd. Copying or reprinting of these materials in whole or in part is prohibited.
This article was written by a user of the site and reflects their personal views. MetaQuotes Ltd is not responsible for the accuracy of the information presented, nor for any consequences resulting from the use of the solutions, strategies or recommendations described.
 Price Action Analysis Toolkit Development (Part 11): Heikin Ashi Signal EA
 Artificial Bee Hive Algorithm (ABHA): Theory and methods
 Developing a Replay System (Part 58): Returning to Work on the Service
 Trend Prediction with LSTM for Trend-Following Strategies
- Free trading apps
- Over 8,000 signals for copying
- Economic news for exploring financial markets
You agree to website policy and terms of use