Price Action Analysis Toolkit Development (Part 22): Correlation Dashboard

Contents
Introduction
Correlation is a statistical measure of how two variables move in relation to one another. Financial markets reflect the degree to which two instruments rise and fall together (positive correlation) or in opposite directions (negative correlation). Importantly, correlation describes relationships, not causation.In my previous article, I showed how to plot the EURUSD–GBPUSD correlation using Python libraries. Now, I’ll guide you through creating a custom Expert Advisor that delivers correlation analysis directly in MetaTrader 5 with practical, on-chart visualizations. This tool creates a live dashboard that displays correlation values across various instruments: currencies, commodities, and more, over a selected timeframe.
By using this dashboard, traders gain a more profound understanding of how price movements across different markets interact. Whether instruments move in tandem, diverge strongly, or behave independently, this insight helps with:
- Managing portfolio risk (by avoiding overexposure to correlated trades)
- Identifying potential hedges or pairs trades
- Enhancing diversification
- Spotting shifts in market dynamics when correlations change.
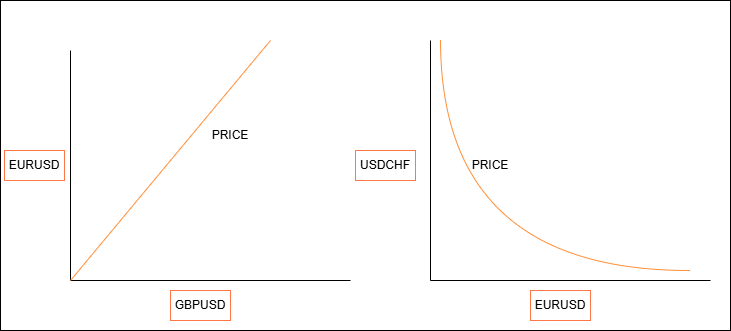
Fig 1. Pair Relationships
The first diagram shows how EURUSD and GBPUSD tend to move together: when EURUSD rises, GBPUSD also rises. This is called a strong positive correlation or direct proportion. The second diagram shows EURUSD and USDCHF moving in opposite directions: as EURUSD goes up, USDCHF falls. That is a strong negative correlation (an inverse proportion). When two pairs neither move together nor in opposition, we say they are uncorrelated or independent.
Strategy Overview
The Correlation Dashboard EA continuously pulls the last N closes for each pair in your list and converts them into simple returns. It then computes the Pearson r for every unique instrument pair and plots these values as an on-chart heat-map matrix with colored cells showing strength and sign. The EA overlays each r value and classifies it as strong positive, moderate, no correlation, moderate negative, or strong negative. It prints an interpretation with tailored advice—hedge, confirm, diversify, or spread—and fires alerts when any correlation exceeds your threshold.
In one glance you see which markets move together, which oppose, and which remain independent, so you can adjust positions with confidence. We calculate the Pearson correlation coefficient (r) as follows, here’s the MQL5 code that performs the calculation:
//+------------------------------------------------------------------+
//| Pearson correlation                                              |
//+------------------------------------------------------------------+
double CalcCorrelation(const string s1, const string s2)
{
   double a1[], a2[];
   // Fetch closing prices
   if(CopyClose(s1, TimeFrame, 0, LookbackBars, a1) < LookbackBars ||
      CopyClose(s2, TimeFrame, 0, LookbackBars, a2) < LookbackBars)
      return(0);

   int n = LookbackBars - 1;
   double r1[], r2[];
   ArrayResize(r1, n);
   ArrayResize(r2, n);

   // Compute simple returns
   for(int k = 1; k < LookbackBars; k++)
   {
      r1[k-1] = (a1[k] - a1[k-1]) / a1[k-1];
      r2[k-1] = (a2[k] - a2[k-1]) / a2[k-1];
   }

   // Calculate means
   double m1 = AverageArray(r1);
   double m2 = AverageArray(r2);

   // Build covariance numerator and variances
   double num = 0, d1 = 0, d2 = 0;
   for(int i = 0; i < n; i++)
   {
      double da = r1[i] - m1;
      double db = r2[i] - m2;
      num += da * db;      // covariance sum
      d1  += da * da;      // variance of series 1
      d2  += db * db;      // variance of series 2
   }

   // Return r (or 0 if division by zero)
   return (d1 > 0 && d2 > 0) ? num / MathSqrt(d1 * d2) : 0;
}
- Strong Positive Correlation (r >/= 0.8)
Interpretation: When EURUSD ticks up 1%, GBPUSD tends to tick up 0.85% on average. A long signal on EURUSD is effectively reinforced by GBPUSD, so you treat them as a single cluster, avoid offsetting positions and consider using one as a hedge for the other.
- Strong Negative Correlation (r < or = –0.8)
Interpretation: A 1% rise in EURUSD coincides with a 0.92% drop in USDCHF. You can run inter-market spreads (long EURUSD, short USDCHF) to capture relative moves while neutralizing outright directional exposure, or watch for divergences as a warning of weakening conviction.
- No Correlation (modulus of r < 0.5)
Interpretation: Changes in AUDUSD carry almost no predictive power for USDJPY and vice versa. These “independent” pairs are ideal diversification candidates—adding them to your basket smooths portfolio volatility without introducing hidden directional bias.
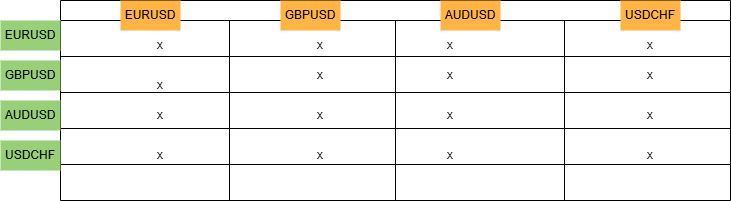
Fig 2. Dashboard
Figure 2 above illustrates the interface we aim to build: a table showing correlation values, denoted by “x”, that range from –1 to +1.
MQL5 Code Dissection
We begin, as is customary in MQL5 development, by defining the fundamental characteristics of our program through initial directives and including necessary libraries. These lines establish standard #property directives for identification and version control, providing essential metadata visible within the MetaTrader 5 terminal.//+------------------------------------------------------------------+ //| Correlation Dashboard.mq5| //| Copyright 2025, MetaQuotes Ltd.| //| https://www.mql5.com/en/users/lynnchris| //+------------------------------------------------------------------+ #property copyright "Copyright 2025, MetaQuotes Ltd." #property link "https://www.mql5.com/en/users/lynnchris" #property version "1.0" #property strictA critical element here is #property strict, which is included to mandate rigorous compilation rules. This practice is highly recommended as it helps to catch potential coding errors early in the development process, leading to more robust and reliable code. Following these directives, we include the <Trade\Trade.mqh> library:
#include <Trade\Trade.mqh>
While this specific EA focuses on analysis rather than automated trading, incorporating this library grants access to a comprehensive suite of functions and classes relevant to trade management, keeping options open for future enhancements or integration into a larger trading system.
Before we can effectively calculate and interpret correlations, we need some fundamental building blocks. This is where our utility functions come into play. The AverageArray function provides a necessary tool for calculating the mean of a dataset, a step required in our correlation formula.
//+------------------------------------------------------------------+
//| Utility: average of an array                                     |
//+------------------------------------------------------------------+
double AverageArray(const double &arr[])
  {
   int sz = ArraySize(arr);
   if(sz == 0)
      return(0);
   double sum = 0;
   for(int i = 0; i < sz; i++)
      sum += arr[i];
   return(sum / sz);
  }
Moving beyond the raw numbers, the InterpretCorrelation function takes the calculated correlation coefficient and transforms it into a more intuitive description, categorizing the strength and direction of the relationship with terms like "strong positive" or "weak or no correlation" based on predefined thresholds.
//+------------------------------------------------------------------+
//| Interpret raw correlation                                        |
//+------------------------------------------------------------------+
string InterpretCorrelation(double r)
  {
   if(r >=  0.8)
      return("strong positive correlation");
   if(r >=  0.5)
      return("moderate positive correlation");
   if(r >   -0.5)
      return("weak or no correlation");
   if(r >   -0.8)
      return("moderate negative correlation");
   return("strong negative correlation");
  }
Building upon this interpretation, the RecommendAction function offers practical commentary and potential trading implications based on the observed correlation between two specific instruments, providing actionable insights derived from the statistical analysis.
//+------------------------------------------------------------------+
//| Recommend trading action based on r                              |
//+------------------------------------------------------------------+
string RecommendAction(double r, const string s1, const string s2)
  {
   if(r >=  0.8)
      return("They move almost in lock-step. Avoid opposite positions; use one as hedge.");
   if(r >=  0.5)
      return("Tendency to move together. Be cautious opening offset trades—seek confirmation.");
   if(r >   -0.5)
      return("Little to no relation: ideal for diversification.");
   if(r >   -0.8)
      return("Often move in opposition. Consider small inter-market spreads.");
   return("Very strong inverse relationship—candidate for statistical arbitrage.");
  }
To make the Correlation Dashboard adaptable to various trading preferences and analytical needs, we provide a set of input parameters that the user can configure via the EA's properties window.
//+------------------------------------------------------------------+
//| Inputs                                                           |
//+------------------------------------------------------------------+
input string    InstrumentsList      = "EURUSD,GBPUSD,USDJPY,USDCHF,AUDUSD,NZDUSD,XAUUSD";
input ENUM_TIMEFRAMES TimeFrame      = PERIOD_H1;
input int       LookbackBars         = 100;    // bars for correlation
input double    AlertThreshold       = 0.8;    // threshold for alerts
input int       UpdateSeconds        = 5;      // timer interval

// Notifications
input bool      UsePushNotifications = true;
input bool      UseEmailAlerts       = false;
First, the user defines the universe of assets to be analyzed through the InstrumentsList, providing a simple comma-separated string of symbols. They then select the TimeFrame for the analysis, determining the granularity of the historical data used. TheLookbackBars input allows the user to control the length of the historical period considered for the correlation calculation. The AlertThreshold parameter lets the user define the level of correlation significance that should trigger a notification. Finally, UpdateSeconds sets the frequency at which the EA recalculates and updates the dashboard, while UsePushNotifications and UseEmailAlerts provide control over the preferred methods of receiving alerts.
To ensure that critical data is accessible across different parts of the EA, we declare a few global variables.
//+------------------------------------------------------------------+
//| Globals                                                          |
//+------------------------------------------------------------------+
string Instruments[];
double CorrArray[];
int    InstrumentCount;
The Instruments array will store the individual symbol names after they are parsed from the user's input list. The CorrArray is a dedicated array to hold the calculated pairwise correlation coefficients, organized to allow easy access to the correlation between any two instruments. A simple integer, InstrumentCount, keeps track of how many symbols are being analyzed.
When the Expert Advisor is attached to a chart, the OnInit function is the first to execute, setting up the necessary components for operation. It begins by parsing the InstrumentsList to populate the Instruments array and confirms that at least two symbols were provided, as correlation requires a pair.
//+------------------------------------------------------------------+
//| Expert initialization                                            |
//+------------------------------------------------------------------+
int OnInit()
  {
// parse & select instruments
   InstrumentCount = StringSplit(InstrumentsList, ',', Instruments);
   if(InstrumentCount < 2)
     {
      Print("Error: need at least two symbols.");
      return(INIT_FAILED);
     }
   for(int i = 0; i < InstrumentCount; i++)
      SymbolSelect(Instruments[i], true);
It then ensures that MetaTrader has data readily available for all specified symbols using SymbolSelect. The CorrArray is then sized appropriately to store all the pairwise correlations.
// allocate storage
   ArrayResize(CorrArray, InstrumentCount * InstrumentCount);
A key step here is calling DrawDashboard(), which renders the initial visual representation of the correlation matrix on the chart.
// draw dashboard & start timer
   DrawDashboard();
To ensure the dashboard remains dynamic, EventSetTimer is used to schedule periodic calls to the OnTimer function, initiating the update cycle.
   EventSetTimer(UpdateSeconds);
   return(INIT_SUCCEEDED);
  }
If any of the initialization steps fail (e.g., fewer than two symbols are provided), OnInit returns INIT_FAILED, preventing the EA from running.
When the EA is no longer needed and is removed from the chart or the terminal is closed, the OnDeinit function is executed to perform necessary cleanup.
//+------------------------------------------------------------------+
//| Expert deinitialization                                          |
//+------------------------------------------------------------------+
void OnDeinit(const int reason)
  {
   EventKillTimer();
   ClearObjects();
  }
Its primary tasks are to stop the periodic timer using EventKillTimer(), preventing further execution of the update logic, and to remove all graphical objects created by the EA from the chart using ClearObjects(), leaving the chart in a clean state.
The OnTimer function serves as the engine of the EA's dynamic behavior, being automatically triggered at the interval specified by the user. Upon execution, it first calls UpdateCorrelations() to refresh all the correlation calculations with the latest data.
//+------------------------------------------------------------------+
//| Timer: update, interpret, display, alert                         |
//+------------------------------------------------------------------+
void OnTimer()
  {
   UpdateCorrelations();
Following this, it iterates through each unique pair of instruments, retrieving their correlation, and utilizing the utility functions to generate interpretive text and trading advice, which is then logged to the Experts tab.
// interpret & advise for each unique pair
   for(int i = 0; i < InstrumentCount; i++)
      for(int j = i + 1; j < InstrumentCount; j++)
        {
         double r    = CorrArray[i * InstrumentCount + j];
         string cat  = InterpretCorrelation(r);
         string tip  = RecommendAction(r, Instruments[i], Instruments[j]);
         PrintFormat(
            "%s vs %s \xBB r=%.2f: %s; Advice: %s",
            Instruments[i], Instruments[j],
            r, cat, tip
         );
        }
After processing the data, it calls RefreshValues() to update the visual dashboard on the chart, displaying the new correlation coefficients and adjusting the color coding.
RefreshValues();
Finally, it checks if any correlations have crossed the predefined AlertThreshold by calling CheckAlerts(), and if so, initiates the notification process.
 CheckAlerts();
}
The core analytical task is performed within the correlation calculation functions. UpdateCorrelations() acts as the manager, looping through all possible pairs of instruments and invoking CalcCorrelation for each pair to obtain the correlation coefficient, which is then stored in the CorrArray.
//+------------------------------------------------------------------+
//| Compute pairwise correlations                                    |
//+------------------------------------------------------------------+
void UpdateCorrelations()
  {
   for(int i = 0; i < InstrumentCount; i++)
      for(int j = 0; j < InstrumentCount; j++)
         CorrArray[i * InstrumentCount + j] =
            CalcCorrelation(Instruments[i], Instruments[j]);
  }
The CalcCorrelation (const string s1, const string s2) function is where the statistical computation takes place. It retrieves historical closing price data for the specified LookbackBars for both instruments using CopyClose.
//+------------------------------------------------------------------+
//| Pearson correlation                                              |
//+------------------------------------------------------------------+
double CalcCorrelation(const string s1, const string s2)
  {
   double a1[], a2[];
   if(CopyClose(s1, TimeFrame, 0, LookbackBars, a1) < LookbackBars ||
      CopyClose(s2, TimeFrame, 0, LookbackBars, a2) < LookbackBars)
      return(0);
To ensure a relevant measure for financial data, it calculates the percentage price change between consecutive bars.
int n = LookbackBars - 1;
double r1[], r2[];
ArrayResize(r1, n);
ArrayResize(r2, n);

for(int k = 1; k < LookbackBars; k++)
  {
   r1[k-1] = (a1[k] - a1[k-1]) / a1[k-1];
   r2[k-1] = (a2[k] - a2[k-1]) / a2[k-1];
  }
Using these normalized price changes, it computes the Pearson correlation coefficient, quantifying the linear relationship between the two time series.
 double m1 = AverageArray(r1), m2 = AverageArray(r2);
 double num = 0, d1 = 0, d2 = 0;
 for(int k = 0; k < n; k++)
   {
    double da = r1[k] - m1;
    double db = r2[k] - m2;
    num += da * db;
    d1  += da * da;
    d2  += db * db;
   }
 return (d1 > 0 && d2 > 0) ? num / MathSqrt(d1 * d2) : 0;
}
It includes a check to handle cases where there is no price variation to avoid division by zero.
The visual dashboard on the chart is managed through a set of functions. DrawDashboard() is responsible for initially constructing the graphical layout during initialization, creating the matrix structure with labels for symbols and placeholder areas for the correlation values.//+------------------------------------------------------------------+ //| Draw static dashboard | //+------------------------------------------------------------------+ void DrawDashboard() { ClearObjects(); const int x0 = 20, y0 = 40, dx = 100, dy = 25; CreateLabel("hdr", x0, y0-30, "Correlation Dashboard", clrWhite, 14); // column headers for(int j = 0; j < InstrumentCount; j++) CreateLabel( StringFormat("col_%d", j), x0 + (j+1)*dx, y0, Instruments[j], clrYellow, 10 ); // row headers & cells for(int i = 0; i < InstrumentCount; i++) { CreateLabel( StringFormat("row_%d", i), x0, y0 + (i+1)*dy, Instruments[i], clrYellow, 10 ); for(int j = 0; j < InstrumentCount; j++) { string rect = StringFormat("r_%d_%d", i, j); ObjectCreate(0, rect, OBJ_RECTANGLE_LABEL, 0, 0, 0); ObjectSetInteger(0, rect, OBJPROP_XDISTANCE, x0 + (j+1)*dx - 5); ObjectSetInteger(0, rect, OBJPROP_YDISTANCE, y0 + (i+1)*dy - 12); ObjectSetInteger(0, rect, OBJPROP_XSIZE, dx); ObjectSetInteger(0, rect, OBJPROP_YSIZE, dy); CreateLabel( StringFormat("val_%d_%d", i, j), x0 + (j+1)*dx, y0 + (i+1)*dy, "--", clrWhite, 9 ); } } }ClearObjects() is a utility function that efficiently removes all objects created by the EA from the chart, used during deinitialization and potentially before redrawing.
//+------------------------------------------------------------------+
//| Clear all chart objects                                          |
//+------------------------------------------------------------------+
void ClearObjects()
  {
   for(int i = ObjectsTotal(0)-1; i >= 0; i--)
      ObjectDelete(0, ObjectName(0, i));
  }
RefreshValues() is the function called periodically by OnTimer to update the visual display. It retrieves the latest correlation values and dynamically adjusts the background and text colors of the dashboard cells, creating a heat-map visualization that allows for quick identification of strong positive and negative correlations.
//+------------------------------------------------------------------+
//| Refresh heat-map values & colors                                 |
//+------------------------------------------------------------------+
void RefreshValues()
  {
   for(int i = 0; i < InstrumentCount; i++)
      for(int j = 0; j < InstrumentCount; j++)
        {
         double v = CorrArray[i * InstrumentCount + j];
         color bg = (v >  0.8 ? clrGreen :
                     v >  0.5 ? clrLightGreen :
                     v < -0.5 ? clrRed   : clrLightCoral);
         color fg = (v >= 0  ? clrLime : clrRed);

         string rect = StringFormat("r_%d_%d", i, j);
         if(ObjectFind(0, rect) != -1)
            ObjectSetInteger(0, rect, OBJPROP_COLOR, bg);

         string lbl = StringFormat("val_%d_%d", i, j);
         if(ObjectFind(0, lbl) != -1)
           {
            ObjectSetString(0, lbl, OBJPROP_TEXT, DoubleToString(v, 2));
            ObjectSetInteger(0, lbl, OBJPROP_COLOR, fg);
           }
        }
  }
To keep the user informed of significant shifts in market relationships, an alerting mechanism is implemented in the CheckAlerts function.
//+------------------------------------------------------------------+
//| Alert on threshold & notify                                      |
//+------------------------------------------------------------------+
void CheckAlerts()
  {
   for(int i = 1; i < InstrumentCount; i++)
     {
      double v = CorrArray[i]; // Potential issue here, likely intended CorrArray[0 * InstrumentCount + i]
      if(v >= AlertThreshold) // Only checks for positive correlation >= threshold
        {
         string msg = StringFormat(
                         "High correlation: %s vs %s = %.2f",
                         Instruments[0], Instruments[i], v
                      );
         Alert(msg);
         Print(msg);
         if(UsePushNotifications)
            SendNotification(msg);
         if(UseEmailAlerts)
            SendMail("Correlation Alert", msg);
        }
     }
  }
This function specifically monitors the correlation between the first symbol in the user's list and all other instruments. If the correlation (above the positive threshold in this implementation, though easily adaptable to include strong negative correlations by checking the absolute value) reaches or surpasses the AlertThreshold, it triggers a notification. This involves generating a clear message detailing the pair and their correlation, displaying a standard MetaTrader 5 alert, printing the message to the Experts tab, and optionally sending push notifications or emails based on the user's configuration.
Note: As highlighted in the code comment, there appears to be a potential indexing issue in CorrArray[i] within this function, which likely intends to access the correlation between Instruments[0] and Instruments[i]. Furthermore, it currently only alerts on positive correlations exceeding the threshold; alerting on strong negative correlations would require checking the absolute value.
Outcomes
When deployed on live data the EA immediately rendered the dashboard. It began displaying up-to-the-minute correlation readings in green for positive relationships and red for inverse ones. The display refreshed at each set interval. The Experts tab recorded every coefficient. It provided a concise interpretation of each value. This setup lets you review both the raw numbers and their practical meaning without missing a beat.2025.05.08 02:05:03.019 Correlation Dashboard (GBPUSD,M30) EURUSD vs USDJPY → r=-0.79: moderate negative correlation; Advice: Often move in opposition. Consider small inter-market spreads. 2025.05.08 02:05:03.019 Correlation Dashboard (GBPUSD,M30) EURUSD vs USDCHF → r=-0.80: moderate negative correlation; Advice: Often move in opposition. Consider small inter-market spreads. 2025.05.08 02:05:03.019 Correlation Dashboard (GBPUSD,M30) EURUSD vs AUDUSD → r=0.48: weak or no correlation; Advice: Little to no relation: ideal for diversification. 2025.05.08 02:05:03.019 Correlation Dashboard (GBPUSD,M30) EURUSD vs NZDUSD → r=0.57: moderate positive correlation; Advice: Tendency to move together. Be cautious opening offset trades—seek confirmation. 2025.05.08 02:05:03.019 Correlation Dashboard (GBPUSD,M30) EURUSD vs XAUUSD → r=0.11: weak or no correlation; Advice: Little to no relation: ideal for diversification. 2025.05.08 02:05:03.019 Correlation Dashboard (GBPUSD,M30) GBPUSD vs USDJPY → r=-0.71: moderate negative correlation; Advice: Often move in opposition. Consider small inter-market spreads. 2025.05.08 02:05:03.019 Correlation Dashboard (GBPUSD,M30) GBPUSD vs USDCHF → r=-0.63: moderate negative correlation; Advice: Often move in opposition. Consider small inter-market spreads. 2025.05.08 02:05:03.019 Correlation Dashboard (GBPUSD,M30) GBPUSD vs AUDUSD → r=0.54: moderate positive correlation; Advice: Tendency to move together. Be cautious opening offset trades—seek confirmation. 2025.05.08 02:05:03.019 Correlation Dashboard (GBPUSD,M30) GBPUSD vs NZDUSD → r=0.63: moderate positive correlation; Advice: Tendency to move together. Be cautious opening offset trades—seek confirmation. 2025.05.08 02:05:03.019 Correlation Dashboard (GBPUSD,M30) GBPUSD vs XAUUSD → r=0.11: weak or no correlation; Advice: Little to no relation: ideal for diversification. 2025.05.08 02:05:03.019 Correlation Dashboard (GBPUSD,M30) USDJPY vs USDCHF → r=0.75: moderate positive correlation; Advice: Tendency to move together. Be cautious opening offset trades—seek confirmation. 2025.05.08 02:05:03.019 Correlation Dashboard (GBPUSD,M30) USDJPY vs AUDUSD → r=-0.33: weak or no correlation; Advice: Little to no relation: ideal for diversification. 2025.05.08 02:05:03.019 Correlation Dashboard (GBPUSD,M30) USDJPY vs NZDUSD → r=-0.47: weak or no correlation; Advice: Little to no relation: ideal for diversification. 2025.05.08 02:05:03.019 Correlation Dashboard (GBPUSD,M30) USDJPY vs XAUUSD → r=-0.04: weak or no correlation; Advice: Little to no relation: ideal for diversification. 2025.05.08 02:05:03.019 Correlation Dashboard (GBPUSD,M30) USDCHF vs AUDUSD → r=-0.24: weak or no correlation; Advice: Little to no relation: ideal for diversification. 2025.05.08 02:05:03.019 Correlation Dashboard (GBPUSD,M30) USDCHF vs NZDUSD → r=-0.32: weak or no correlation; Advice: Little to no relation: ideal for diversification. 2025.05.08 02:05:03.019 Correlation Dashboard (GBPUSD,M30) USDCHF vs XAUUSD → r=0.05: weak or no correlation; Advice: Little to no relation: ideal for diversification. 2025.05.08 02:05:03.019 Correlation Dashboard (GBPUSD,M30) AUDUSD vs NZDUSD → r=0.87: strong positive correlation; Advice: They move almost in lock-step. Avoid opposite positions; use one as hedge. 2025.05.08 02:05:03.019 Correlation Dashboard (GBPUSD,M30) AUDUSD vs XAUUSD → r=0.08: weak or no correlation; Advice: Little to no relation: ideal for diversification. 2025.05.08 02:05:03.019 Correlation Dashboard (GBPUSD,M30) NZDUSD vs XAUUSD → r=0.11: weak or no correlation; Advice: Little to no relation: ideal for diversification.
The information above comes from the Experts tab log, where each newly detected correlation is recorded. I’ve highlighted the strongest relationships, those with r ≤ –0.8 (strong negative) and r ≥ +0.8 (strong positive). Below is the on-chart dashboard diagram for visual reference.
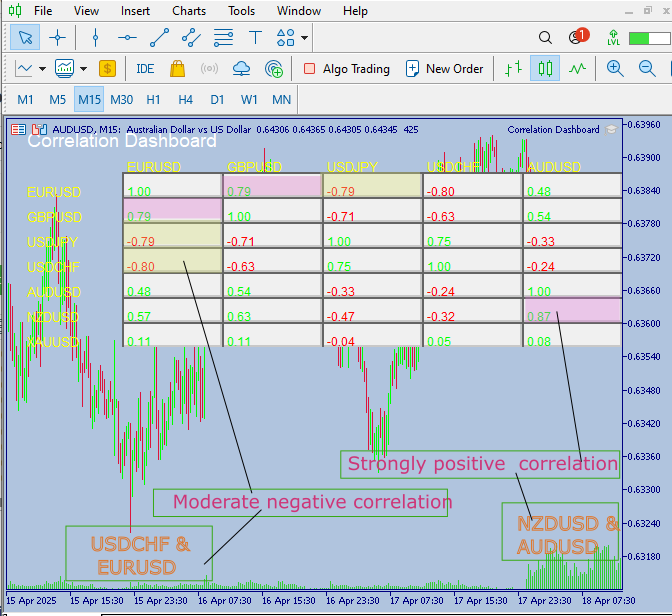
Fig 3. Correlation Board
NZDUSD and AUDUSD exhibit a strong positive correlation, meaning they move in tandem with nearly identical price action. Below, we compare their real‐time price movements side by side to confirm that the dashboard’s correlation reading accurately reflects what’s happening in the market.
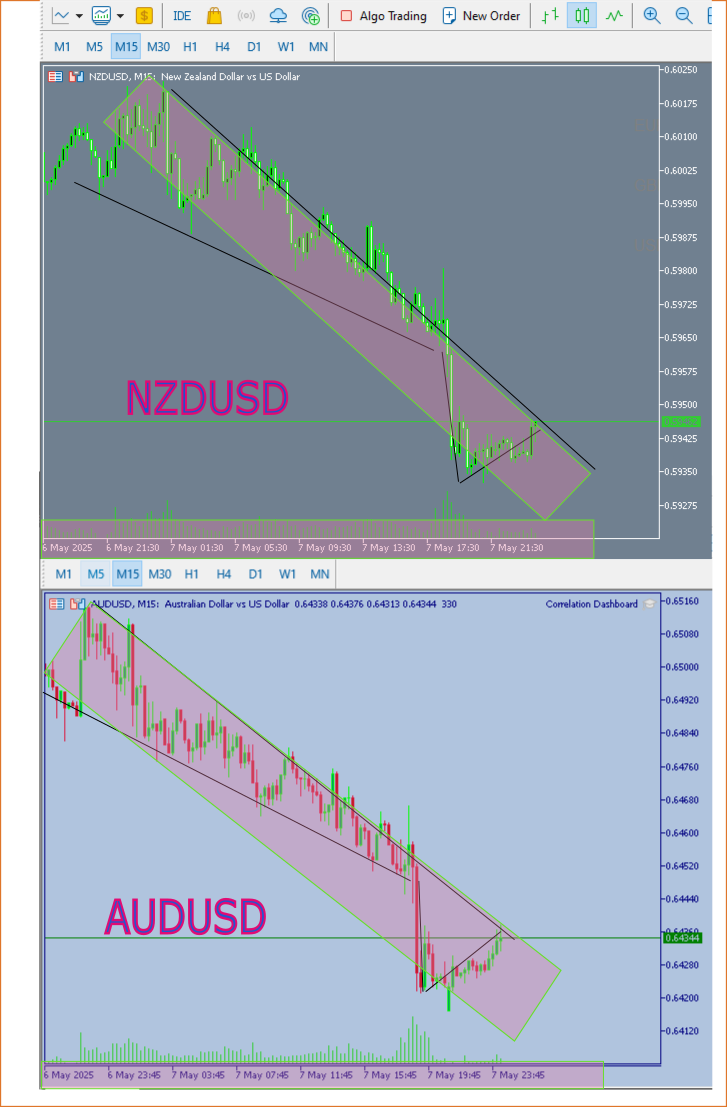
Fig 4. Strong Positive Correlation
The diagram above illustrates a strong positive correlation between these pairs, a direct relationship where they sell and buy almost simultaneously. From May 6 to 7, both pairs initially moved bearish before reversing into a bullish uptrend. Below, I’ve shown a moderate negative correlation: you can spot inverse structures forming, where one pair is selling while the other is buying, and vice versa, most of the time.
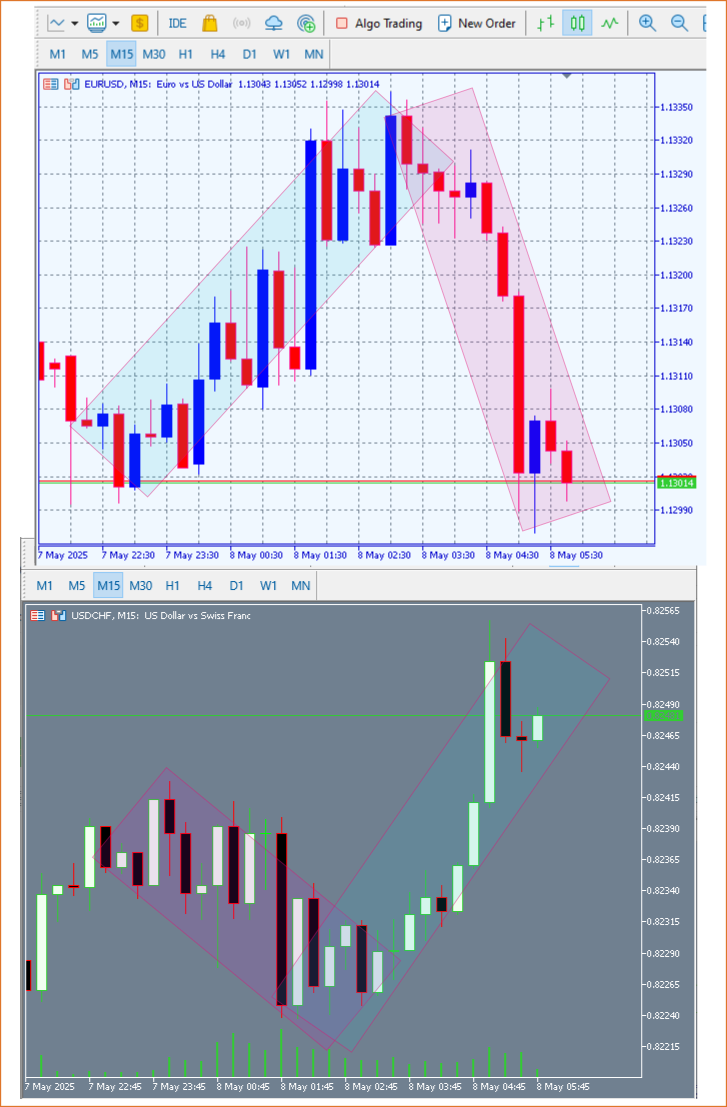
Fig 5. Moderate Negative Correlation
Conclusion
The Correlation Dashboard EA delivers valuable insights into inter-pair price action without you having to switch charts. By showing real-time relationships, it helps you anticipate market shifts across instruments and make more informed trade decisions. The on-chart panel and Experts-tab logs may be basic in appearance, but they clearly present the core functionality: a self-updating dashboard with color-coded coefficients and interpretive messages. You can easily restyle or expand the UI, but the essential analytics are already in place. You are welcome to reach out with any questions or suggestions!
| Date | Tool Name | Description | Version | Updates | Notes |
|---|---|---|---|---|---|
| 01/10/24 | Chart Projector | Script to overlay the previous day's price action with a ghost effect. | 1.0 | Initial Release | Tool number 1 |
| 18/11/24 | Analytical Comment | It provides previous day's information in a tabular format, as well as anticipates the future direction of the market. | 1.0 | Initial Release | Tool number 2 |
| 27/11/24 | Analytics Master | Regular Update of market metrics after every two hours | 1.01 | Second Release | Tool number 3 |
| 02/12/24 | Analytics Forecaster | Regular Update of market metrics after every two hours with telegram integration | 1.1 | Third Edition | Tool number 4 |
| 09/12/24 | Volatility Navigator | The EA analyzes market conditions using the Bollinger Bands, RSI and ATR indicators | 1.0 | Initial Release | Tool Number 5 |
| 19/12/24 | Mean Reversion Signal Reaper | Analyzes market using mean reversion strategy and provides signal | 1.0 | Initial Release | Tool number 6 |
| 9/01/25 | Signal Pulse | Multiple timeframe analyzer | 1.0 | Initial Release | Tool number 7 |
| 17/01/25 | Metrics Board | Panel with button for analysis | 1.0 | Initial Release | Tool number 8 |
| 21/01/25 | External Flow | Analytics through external libraries | 1.0 | Initial Release | Tool number 9 |
| 27/01/25 | VWAP | Volume Weighted Average Price | 1.3 | Initial Release | Tool number 10 |
| 02/02/25 | Heikin Ashi | Trend Smoothening and reversal signal identification | 1.0 | Initial Release | Tool number 11 |
| 04/02/25 | FibVWAP | Signal generation through python analysis | 1.0 | Initial Release | Tool number 12 |
| 14/02/25 | RSI DIVERGENCE | Price action versus RSI divergences | 1.0 | Initial Release | Tool number 13 |
| 17/02/25 | Parabolic Stop and Reverse (PSAR) | Automating PSAR strategy | 1.0 | Initial Release | Tool number 14 |
| 20/02/25 | Quarters Drawer Script | Drawing quarters levels on chart | 1.0 | Initial Release | Tool number 15 |
| 27/02/25 | Intrusion Detector | Detect and alert when price reaches quarters levels | 1.0 | Initial Release | Tool number 16 |
| 27/02/25 | TrendLoom Tool | Multi timeframe analytics panel | 1.0 | Initial Release | Tool number 17 |
| 11/03/25 | Quarters Board | Panel with buttons to activate or disable quarters levels | 1.0 | Initial Release | Tool number 18 |
| 26/03/25 | ZigZag Analyzer | Drawing trendlines using ZigZag Indicator | 1.0 | Initial Release | Tool number 19 |
| 10/04/25 | Correlation Pathfinder | Plotting currency correlations using Python libraries. | 1.0 | Initial Release | Tool number 20 |
| 23/04/25 | Market Structure Flip Detector Tool | Market structure flip detection | 1.0 | Initial Release | Tool number 21 |
| 08/05/25 | Correlation Dashboard | Relationship between different pairs | 1.0 | Initial Release | Tool number 22 |
Warning: All rights to these materials are reserved by MetaQuotes Ltd. Copying or reprinting of these materials in whole or in part is prohibited.
This article was written by a user of the site and reflects their personal views. MetaQuotes Ltd is not responsible for the accuracy of the information presented, nor for any consequences resulting from the use of the solutions, strategies or recommendations described.

- Free trading apps
- Over 8,000 signals for copying
- Economic news for exploring financial markets
You agree to website policy and terms of use
Check out the new article: Price Action Analysis Toolkit Development (Part 22): Correlation Dashboard.
Author: Christian Benjamin
This is nice how much