Articles with examples of indicators developed in MQL5
The articles contain detailed explanation of the attached codes. Download and open them in MetaEditor and program together with the author while reading the article.
Add a new article

You are missing trading opportunities:
- Free trading apps
- Over 8,000 signals for copying
- Economic news for exploring financial markets
Registration
Log in
You agree to website policy and terms of use
If you do not have an account, please register


Graphical Interfaces XI: Rendered controls (build 14.2)
In the new version of the library, all controls will be drawn on separate graphical objects of the OBJ_BITMAP_LABEL type. We will also continue to describe the optimization of code: changes in the core classes of the library will be discussed.

Price Action Analysis Toolkit Development (Part 52): Master Market Structure with Multi-Timeframe Visual Analysis
This article presents the Multi‑Timeframe Visual Analyzer, an MQL5 Expert Advisor that reconstructs and overlays higher‑timeframe candles directly onto your active chart. It explains the implementation, key inputs, and practical outcomes, supported by an animated demo and chart examples showing instant toggling, multi‑timeframe confirmation, and configurable alerts. Read on to see how this tool can make chart analysis faster, clearer, and more efficient.

Practical Application Of Databases For Markets Analysis
Working with data has become the main task for modern software - both for standalone and network applications. To solve this problem a specialized software were created. These are Database Management Systems (DBMS), that can structure, systematize and organize data for their computer storage and processing. As for trading, the most of analysts don't use databases in their work. But there are tasks, where such a solution would have to be handy. This article provides an example of indicators, that can save and load data from databases both with client-server and file-server architectures.

Price Action Analysis Toolkit Development (Part 1): Chart Projector
This project aims to leverage the MQL5 algorithm to develop a comprehensive set of analysis tools for MetaTrader 5. These tools—ranging from scripts and indicators to AI models and expert advisors—will automate the market analysis process. At times, this development will yield tools capable of performing advanced analyses with no human involvement and forecasting outcomes to appropriate platforms. No opportunity will ever be missed. Join me as we explore the process of building a robust market analysis custom tools' chest. We will begin by developing a simple MQL5 program that I have named, Chart Projector.

Graphical Interfaces II: Setting Up the Event Handlers of the Library (Chapter 3)
The previous articles contain the implementation of the classes for creating constituent parts of the main menu. Now, it is time to take a close look at the event handlers in the principle base classes and in the classes of the created controls. We will also pay special attention to managing the state of the chart depending on the location of the mouse cursor.

Multiple Null Bar Re-Count in Some Indicators
The article is concerned with the problem of re-counting of the indicator value in the MetaTrader 4 Client Terminal when the null bar changes. It outlines general idea of how to add to the indicator code some extra program items that allow to restore program code saved before multiple re-counting.
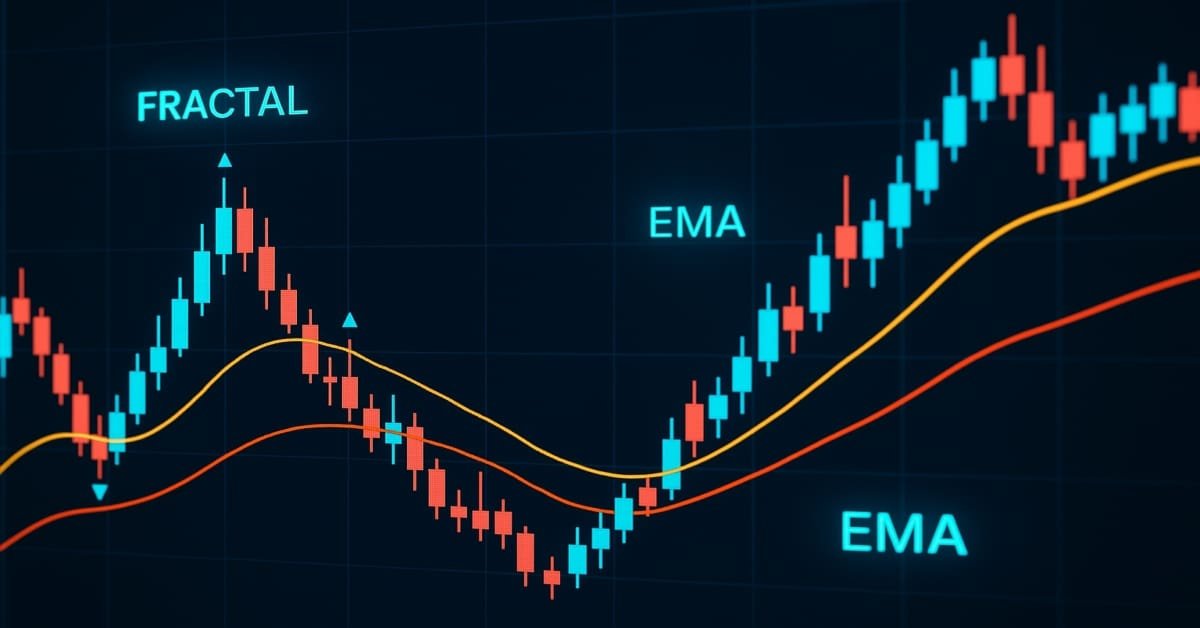
Price Action Analysis Toolkit Development (Part 25): Dual EMA Fractal Breaker
Price action is a fundamental approach for identifying profitable trading setups. However, manually monitoring price movements and patterns can be challenging and time-consuming. To address this, we are developing tools that analyze price action automatically, providing timely signals whenever potential opportunities are detected. This article introduces a robust tool that leverages fractal breakouts alongside EMA 14 and EMA 200 to generate reliable trading signals, helping traders make informed decisions with greater confidence.

Price Action Analysis Toolkit Development (Part 3): Analytics Master — EA
Moving from a simple trading script to a fully functioning Expert Advisor (EA) can significantly enhance your trading experience. Imagine having a system that automatically monitors your charts, performs essential calculations in the background, and provides regular updates every two hours. This EA would be equipped to analyze key metrics that are crucial for making informed trading decisions, ensuring that you have access to the most current information to adjust your strategies effectively.

Graphical Interfaces VIII: the File Navigator Control (Chapter 3)
In the previous chapters of the eighth part of the series, our library has been reinforced by several classes for developing mouse pointers, calendars and tree views. The current article deals with the file navigator control that can also be used as part of an MQL application graphical interface.
Indicators with on-chart interactive controls
The article offers a new perspective on indicator interfaces. I am going to focus on convenience. Having tried dozens of different trading strategies over the years, as well as having tested hundreds of different indicators, I have come to some conclusions I want to share with you in this article.

Price Action Analysis Toolkit Development (Part 6): Mean Reversion Signal Reaper
While some concepts may seem straightforward at first glance, bringing them to life in practice can be quite challenging. In the article below, we'll take you on a journey through our innovative approach to automating an Expert Advisor (EA) that skillfully analyzes the market using a mean reversion strategy. Join us as we unravel the intricacies of this exciting automation process.
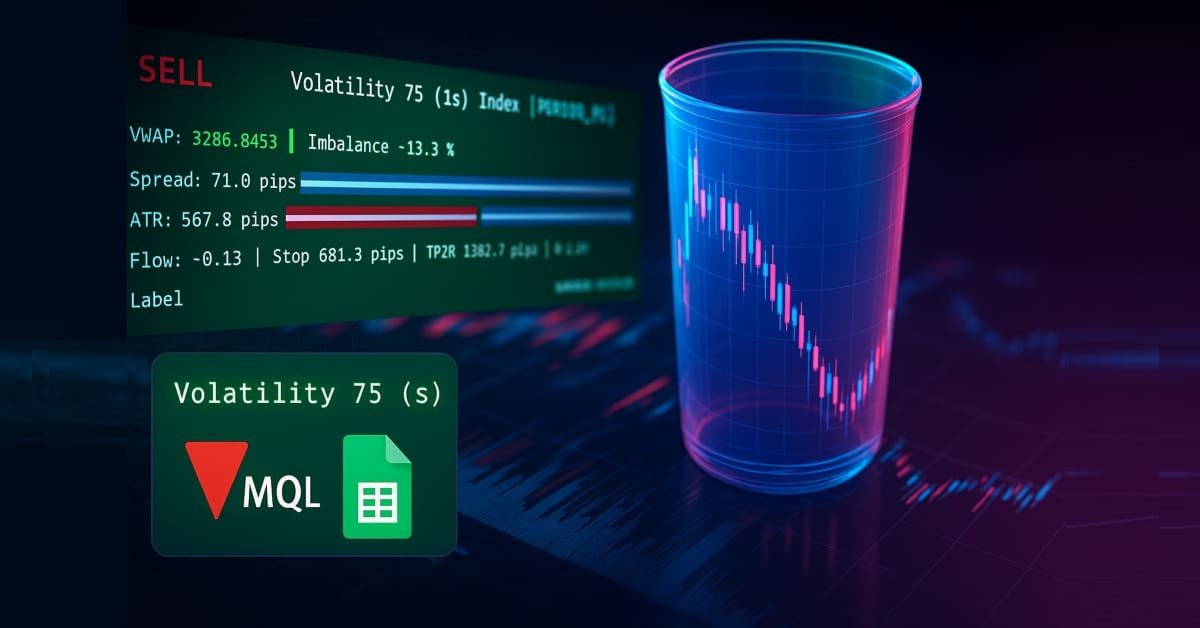
Price Action Analysis Toolkit Development (Part 38): Tick Buffer VWAP and Short-Window Imbalance Engine
In Part 38, we build a production-grade MT5 monitoring panel that converts raw ticks into actionable signals. The EA buffers tick data to compute tick-level VWAP, a short-window imbalance (flow) metric, and ATR-based position sizing. It then visualizes spread, ATR, and flow with low-flicker bars. The system calculates a suggested lot size and a 1R stop, and issues configurable alerts for tight spreads, strong flow, and edge conditions. Auto-trading is intentionally disabled; the focus remains on robust signal generation and a clean user experience.

Price Action Analysis Toolkit Development (Part 49): Integrating Trend, Momentum, and Volatility Indicators into One MQL5 System
Simplify your MetaTrader 5 charts with the Multi Indicator Handler EA. This interactive dashboard merges trend, momentum, and volatility indicators into one real‑time panel. Switch instantly between profiles to focus on the analysis you need most. Declutter with one‑click Hide/Show controls and stay focused on price action. Read on to learn step‑by‑step how to build and customize it yourself in MQL5.
Timeseries in DoEasy library (part 46): Multi-period multi-symbol indicator buffers
In this article, I am going to improve the classes of indicator buffer objects to work in the multi-symbol mode. This will pave the way for creating multi-symbol multi-period indicators in custom programs. I will add the missing functionality to the calculated buffer objects allowing us to create multi-symbol multi-period standard indicators.

Creating multi-symbol, multi-period indicators
In this article, we will look at the principles of creating multi-symbol, multi-period indicators. We will also see how to access the data of such indicators from Expert Advisors and other indicators. We will consider the main features of using multi-indicators in Expert Advisors and indicators and will see how to plot them through custom indicator buffers.
Price Action Analysis Toolkit Development (Part 47): Tracking Forex Sessions and Breakouts in MetaTrader 5
Global market sessions shape the rhythm of the trading day, and understanding their overlap is vital to timing entries and exits. In this article, we’ll build an interactive trading sessions EA that brings those global hours to life directly on your chart. The EA automatically plots color‑coded rectangles for the Asia, Tokyo, London, and New York sessions, updating in real time as each market opens or closes. It features on‑chart toggle buttons, a dynamic information panel, and a scrolling ticker headline that streams live status and breakout messages. Tested on different brokers, this EA combines precision with style—helping traders see volatility transitions, identify cross‑session breakouts, and stay visually connected to the global market’s pulse.
Indicator for Spindles Charting
The article regards spindle chart plotting and its usage in trading strategies and experts. First let's discuss the chart's appearance, plotting and connection with japanese candlestick chart. Next we analyze the indicator's implementation in the source code in the MQL5 language. Let's test the expert based on indicator and formulate the trading strategy.

From Novice to Expert: Support and Resistance Strength Indicator (SRSI)
In this article, we will share insights on how to leverage MQL5 programming to pinpoint market levels—differentiating between weaker and strongest price levels. We will fully develop a working, Support and Resistance Strength Indicator (SRSI).
Graphical Interfaces XI: Refactoring the Library code (build 14.1)
As the library grows, its code must be optimized again in order to reduce its size. The version of the library described in this article has become even more object-oriented. This made the code easier to learn. A detailed description of the latest changes will allow the readers to develop the library independently based on their own needs.

Price Action Analysis Toolkit Development (Part 26): Pin Bar, Engulfing Patterns and RSI Divergence (Multi-Pattern) Tool
Aligned with our goal of developing practical price-action tools, this article explores the creation of an EA that detects pin bar and engulfing patterns, using RSI divergence as a confirmation trigger before generating any trading signals.

Complex indicators made easy using objects
This article provides a method to create complex indicators while also avoiding the problems that arise when dealing with multiple plots, buffers and/or combining data from multiple sources.

Graphical Interfaces VIII: The Tree View Control (Chapter 2)
The previous chapter of part VIII on graphical interfaces has focused on the elements of static and drop-down calendar. The second chapter will be dedicated to an equally complex element — a tree view, that is included in every complete library used for creating graphical interfaces. A tree view implemented in this article contains multiple flexible settings and modes, thus allowing to adjust this element of control to your needs.

Building a Spectrum Analyzer
This article is intended to get its readers acquainted with a possible variant of using graphical objects of the MQL5 language. It analyses an indicator, which implements a panel of managing a simple spectrum analyzer using the graphical objects. The article is meant for readers acquianted with basics of MQL5.

Developing a trading Expert Advisor from scratch (Part 31): Towards the future (IV)
We continue to remove separate parts from our EA. This is the last article within this series. And the last thing to be removed is the sound system. This can be a bit confusing if you haven't followed these article series.

DIY technical indicator
In this article, I will consider the algorithms allowing you to create your own technical indicator. You will learn how to obtain pretty complex and interesting results with very simple initial assumptions.

Custom Indicator Workshop (Part 2) : Building a Practical Supertrend Expert Advisor in MQL5
Learn how to build a Supertrend-driven Expert Advisor in MQL5 from the ground up. The article covers embedding the indicator as a resource, reading buffer values on closed bars, detecting confirmed flips, aligning and switching positions, and configuring stop-loss modes and position sizing. It concludes with Strategy Tester setup and reproducible tests, leaving you with a configurable EA and a clear framework for further research and extensions.

Ready-made templates for including indicators to Expert Advisors (Part 3): Trend indicators
In this reference article, we will look at standard indicators from the Trend Indicators category. We will create ready-to-use templates for indicator use in EAs - declaring and setting parameters, indicator initialization and deinitialization, as well as receiving data and signals from indicator buffers in EAs.
Graphical interfaces X: New features for the Rendered table (build 9)
Until today, the CTable was the most advanced type of tables among all presented in the library. This table is assembled from edit boxes of the OBJ_EDIT type, and its further development becomes problematic. Therefore, in terms of maximum capabilities, it is better to develop rendered tables of the CCanvasTable type even at the current development stage of the library. Its current version is completely lifeless, but starting from this article, we will try to fix the situation.

Custom Indicator Workshop (Part 1): Building the Supertrend Indicator in MQL5
Build a non‑repainting Supertrend in MQL5 for MetaTrader 5 from first principles. We use an iATR handle and CopyBuffer for volatility, bind buffers with SetIndexBuffer, and configure plots (DRAWCOLORCANDLES plus two line bands) via PlotIndexSetInteger. The logic updates only on closed bars with EMPTY_VALUE to suppress inactive bands, exposing atrPeriod and atrMultiplier inputs. You get a clean, EA‑ready overlay with documented buffers for strategies and signals.
Calculation of Integral Characteristics of Indicator Emissions
Indicator emissions are a little-studied area of market research. Primarily, this is due to the difficulty of analysis that is caused by the processing of very large arrays of time-varying data. Existing graphical analysis is too resource intensive and has therefore triggered the development of a parsimonious algorithm that uses time series of emissions. This article demonstrates how visual (intuitive image) analysis can be replaced with the study of integral characteristics of emissions. It can be of interest to both traders and developers of automated trading systems.

Moving Average in MQL5 from scratch: Plain and simple
Using simple examples, we will examine the principles of calculating moving averages, as well as learn about the ways to optimize indicator calculations, including moving averages.

ALGLIB numerical analysis library in MQL5
The article takes a quick look at the ALGLIB 3.19 numerical analysis library, its applications and new algorithms that can improve the efficiency of financial data analysis.

Master MQL5 from beginner to pro (Part II): Basic data types and use of variable
This is a continuation of the series for beginners. In this article, we'll look at how to create constants and variables, write dates, colors, and other useful data. We will learn how to create enumerations like days of the week or line styles (solid, dotted, etc.). Variables and expressions are the basis of programming. They are definitely present in 99% of programs, so understanding them is critical. Therefore, if you are new to programming, this article can be very useful for you. Required programming knowledge level: very basic, within the limits of my previous article (see the link at the beginning).

Developing a trading Expert Advisor from scratch (Part 12): Times and Trade (I)
Today we will create Times & Trade with fast interpretation to read the order flow. It is the first part in which we will build the system. In the next article, we will complete the system with the missing information. To implement this new functionality, we will need to add several new things to the code of our Expert Advisor.

Developing a trading Expert Advisor from scratch (Part 10): Accessing custom indicators
How to access custom indicators directly in an Expert Advisor? A trading EA can be truly useful only if it can use custom indicators; otherwise, it is just a set of codes and instructions.
Canvas based indicators: Filling channels with transparency
In this article I'll introduce a method for creating custom indicators whose drawings are made using the class CCanvas from standard library and see charts properties for coordinates conversion. I'll approach specially indicators which need to fill the area between two lines using transparency.

Price Action Analysis Toolkit Development (Part 55): Designing a CPI Mini-Candle Overlay for Intra-bar Pressure
This article presents the design and MetaTrader 5 implementation of the Candle Pressure Index (CPI)—a CLV-based overlay that visualizes intra-Bar buying and selling pressure directly on price charts. The discussion focuses on candle structure, pressure classification, visualization mechanics, and a non-repainting, transition-based alert system designed for consistent behavior across timeframes and instruments.

From Novice to Expert: Programming Candlesticks
In this article, we take the first step in MQL5 programming, even for complete beginners. We'll show you how to transform familiar candlestick patterns into a fully functional custom indicator. Candlestick patterns are valuable as they reflect real price action and signal market shifts. Instead of manually scanning charts—an approach prone to errors and inefficiencies—we'll discuss how to automate the process with an indicator that identifies and labels patterns for you. Along the way, we’ll explore key concepts like indexing, time series, Average True Range (for accuracy in varying market volatility), and the development of a custom reusable Candlestick Pattern library for use in future projects.

Introduction to MQL5 (Part 15): A Beginner's Guide to Building Custom Indicators (IV)
In this article, you'll learn how to build a price action indicator in MQL5, focusing on key points like low (L), high (H), higher low (HL), higher high (HH), lower low (LL), and lower high (LH) for analyzing trends. You'll also explore how to identify the premium and discount zones, mark the 50% retracement level, and use the risk-reward ratio to calculate profit targets. The article also covers determining entry points, stop loss (SL), and take profit (TP) levels based on the trend structure.

Price Action Analysis Toolkit Development (Part 13): RSI Sentinel Tool
Price action can be effectively analyzed by identifying divergences, with technical indicators such as the RSI providing crucial confirmation signals. In the article below, we explain how automated RSI divergence analysis can identify trend continuations and reversals, thereby offering valuable insights into market sentiment.