
Sigma Score Indicator for MetaTrader 5: A Simple Statistical Anomaly Detector

Introduction
Many traders learn early that price does not move in a smooth, predictable way. Markets have “quiet” periods and then sudden spikes, drops, and shock moves. One practical way to detect whether a move is normal (typical for the recent market) or unusual (rare compared to recent behavior) is to standardize returns and express them in “sigma units”.
That is exactly what the Sigma Score indicator does. It converts the latest return into a z-score (also called a standard score) and plots it in a separate window. In simple terms, the Sigma Score answers one question:
“How many standard deviations is the current bar’s return away from the average return of the last N bars?”
This makes it useful for beginners because you do not need complex trading theory to read it. You only need to understand that a value near 0 is “normal”, while large positive/negative values signal “unusually strong” moves.
What is a Sigma Score and what does it mean?
In statistics, the z-score measures how far a value is from the mean, in units of standard deviation. The standard definition is:
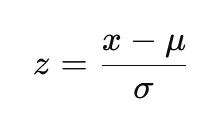
where x is the current value, μ is the mean, and σ is the standard deviation. In finance we often apply the same idea to returns.
This indicator uses log returns, defined as:
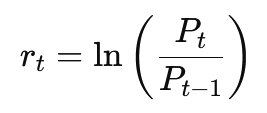
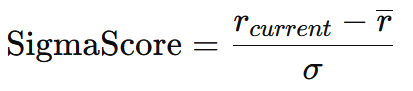
This return definition is very common in quantitative finance because log returns are additive across time (they “sum nicely” over multiple periods). So, in this indicator:
- x is the current log return
- μ is the average log return over the last InpLookback bars
- σ is the standard deviation of log returns over the last InpLookback bars
Standard deviation of (log) returns is also a standard way to express historical volatility.
Why the default thresholds are often ±2.0
If returns were perfectly normally distributed (real markets are not, but this is still a useful rule of thumb), then about 95% of observations fall within ±2 standard deviations of the mean.
That is why many traders use:
- Sigma Score > +2 as an “unusually strong positive return”
- Sigma Score < −2 as an “unusually strong negative return”
Important note for real trading: financial returns often have fat tails (extreme moves happen more often than a perfect normal distribution would suggest). So thresholds are best treated as practical “stress/anomaly zones”, not as guaranteed probabilities.
Building the indicator
Step 1. Create the indicator skeleton (properties and plot)
When you create a new indicator file in MetaEditor, the first important section is the #property block. This is where you tell MetaTrader 5 how the indicator should look.
#property indicator_separate_window
#property indicator_buffers 1
#property indicator_plots   1
#property indicator_type1   DRAW_LINE
#property indicator_color1  clrBlue
#property indicator_width1  2
#property indicator_label1  "Sigma Score"
What we did here:
- indicator_separate_window: the indicator is drawn below the main chart.
- 1 buffer + 1 plot: we only need one line (Sigma Score).
- DRAW_LINE: MetaTrader 5 will draw a line from the values we provide.
- color/label: the line will appear as “Sigma Score” in blue.
Step 2. Inputs (making the indicator configurable)
Inputs are the settings a user can change in MetaTrader 5:
input int    InpLookback = 20;
input double InpUpperThreshold = 2.0;
input double InpLowerThreshold = -2.0;
What these mean in practice:
- Lookback: how many bars define “recent history” for mean and volatility.
- Upper/Lower thresholds: guide lines (often ±2 as a “large move” zone).
Step 3. Buffers and variables
Indicators draw by filling arrays (buffers). This indicator has one output buffer:
double SigmaBuffer[];
We only need one indicator buffer because we plot only one series (Sigma Score). Step 4. Initialization
OnInit()runs once when you attach the indicator. It prepares everything MetaTrader 5 needs to plot.
int OnInit()
{
    // Indicator buffers mapping
    SetIndexBuffer(0, SigmaBuffer, INDICATOR_DATA);
    ArraySetAsSeries(SigmaBuffer, true);

    // Set horizontal levels
    IndicatorSetInteger(INDICATOR_LEVELS, 3);
    IndicatorSetDouble(INDICATOR_LEVELVALUE, 0, 0.0);
    IndicatorSetDouble(INDICATOR_LEVELVALUE, 1, InpUpperThreshold);
    IndicatorSetDouble(INDICATOR_LEVELVALUE, 2, InpLowerThreshold);

    IndicatorSetInteger(INDICATOR_LEVELCOLOR, 0, clrGray);
    IndicatorSetInteger(INDICATOR_LEVELCOLOR, 1, clrRed);
    IndicatorSetInteger(INDICATOR_LEVELCOLOR, 2, clrGreen);

    IndicatorSetInteger(INDICATOR_LEVELSTYLE, 0, STYLE_DOT);
    IndicatorSetInteger(INDICATOR_LEVELSTYLE, 1, STYLE_DASH);
    IndicatorSetInteger(INDICATOR_LEVELSTYLE, 2, STYLE_DASH);

    // Set indicator labels
    PlotIndexSetString(0, PLOT_LABEL, "Sigma Score");
    IndicatorSetString(INDICATOR_SHORTNAME, "Sigma Score (" + IntegerToString(InpLookback) + ")");
    IndicatorSetInteger(INDICATOR_DIGITS, 2);

    return(INIT_SUCCEEDED);
}
What we just built:
-
Buffer mapping (and series order)
SetIndexBuffer(0, SigmaBuffer, INDICATOR_DATA). Connects our SigmaBuffer[] to plot #0. From this point on, whenever we assign a value like SigmaBuffer[i] = ..., MetaTrader will draw it as the indicator line.
ArraySetAsSeries(SigmaBuffer, true). Makes the buffer behave like price arrays. Index 0 is the most recent bar, index 1 is the previous bar, etc. This keeps indexing consistent with close[0], close[1], and so on. -
Horizontal guide levels (with styling)
IndicatorSetInteger(INDICATOR_LEVELS, 3). Creates three horizontal reference lines. We set them to 0.0, the upper threshold, and the lower threshold. This visually separates “normal” readings around zero from unusually large positive or negative values.
In addition, we style these levels for readability. The 0-line is set to gray and dotted, while the thresholds are set to red/green and dashed, so extremes stand out immediately. -
Naming and formatting
We set the plot label ("Sigma Score") and define a short name that includes the lookback value. "Sigma Score (20)", "Sigma Score (50)", etc. This is useful when you add multiple instances of the indicator with different lookbacks.
Finally, IndicatorSetInteger(INDICATOR_DIGITS, 2). Formats the output to two decimals for a clean display.
Step 5. The actual Sigma Score calculation in OnCalculate ()
OnCalculate() is where MetaTrader 5 asks: “Give me the indicator values for the bars.” In our case, that means for each bar, compute the Sigma Score and write it into SigmaBuffer[] so MetaTrader can draw the line. We start with a minimum-data check:
if(rates_total < InpLookback + 1)
{
    return(0);
}
We need at least InpLookback bars to build the rolling statistics, and we also need one additional bar because the log return uses close[i] and close[i+1]. If there isn’t enough history we simply exit and draw nothing. Next, we tell MetaTrader 5 to treat the incoming arrays as time series:
ArraySetAsSeries(close, true);
ArraySetAsSeries(time, true);
We set time[] as series for consistency, even though this version does not use time directly. This ensures also the indexing is consistent. close[0] is the most recent bar, close[1] is the previous one, and so on. That’s important because our loops rely on “look forward in history” using i + j and i + 1. Now we decide how many bars we actually need to recalculate. MetaTrader 5 calls indicators repeatedly, so recalculating the entire chart on every tick would be slow. We separate the first run from later updates:
int start;
if(prev_calculated == 0)
{
    start = rates_total - InpLookback - 1;
    ArrayInitialize(SigmaBuffer, EMPTY_VALUE);
}
else
{
    start = rates_total - prev_calculated;
}
On the very first call ( prev_calculated == 0), we initialize the buffer with EMPTY_VALUE. This is important. EMPTY_VALUEtells MetaTrader 5 “do not draw here”, so you don’t get misleading lines in areas where the indicator cannot be computed yet. We also set start so that we begin at the oldest bar where a full lookback window is available. On subsequent calls, we only compute the newly formed bars. Now comes the actual Sigma Score computation. We loop through the bars we need to update:
for(int i = start; i >= 0; i--)
{
    if(i + InpLookback >= rates_total)
    {
        SigmaBuffer[i] = EMPTY_VALUE;
        continue;
    }

    double sum_returns = 0;
    double sum_squared = 0;
    int valid_count = 0;

    for(int j = 0; j < InpLookback; j++)
    {
        int idx1 = i + j;
        int idx2 = i + j + 1;

        if(idx2 < rates_total && close[idx1] > 0 && close[idx2] > 0)
        {
            double log_return = MathLog(close[idx1] / close[idx2]);
            sum_returns += log_return;
            sum_squared += log_return * log_return;
            valid_count++;
        }
    }

    if(i + 1 < rates_total && close[i] > 0 && close[i + 1] > 0)
    {
        double current_return = MathLog(close[i] / close[i + 1]);

        if(valid_count >= InpLookback)
        {
            double mean = sum_returns / valid_count;
            double variance = (sum_squared / valid_count) - (mean * mean);
            if(variance < 0) variance = 0;

            double stdev = MathSqrt(variance);

            if(stdev > 0.0000001)
                SigmaBuffer[i] = (current_return - mean) / stdev;
            else
                SigmaBuffer[i] = 0;
        }
        else
        {
            SigmaBuffer[i] = EMPTY_VALUE;
        }
    }
    else
    {
        SigmaBuffer[i] = EMPTY_VALUE;
    }
}
This section does the full job in a robust way:
First, we skip bars where we can’t build a full lookback window. If i + InpLookback goes beyond available history, we set SigmaBuffer[i] = EMPTY_VALUE and move on. That prevents MetaTrader 5 from drawing values based on incomplete data. Then we compute the statistics of log returns over the lookback window. Instead of storing returns in a separate array, we compute them “inline” and accumulate two sums:
- sum_returns is the sum of log returns (for the mean)
- sum_squaredis the sum of squared log returns (for the variance)
We also count how many valid return values we computed in valid_count. Because log returns require positive prices, we guard with close > 0. If any return would be invalid, it is simply skipped. Next, we compute the current bar’s log return (the value we want to standardize). If it is valid, and we have a complete lookback window ( valid_count >= InpLookback), we compute:
- mean: sum_returns / valid_count
- variance: (sum_squared / valid_count) - mean²
- standard deviation: sqrt(variance)
Finally, we calculate the Sigma Score (z-score):
In code:
SigmaBuffer[i] = (current_return - mean) / stdev;
We also use a small safety threshold ( stdev > 0.0000001) to avoid dividing by a number extremely close to zero. If volatility is effectively zero we output 0 instead of producing unstable spikes. At the end, we return rates_total so MetaTrader 5 knows we have provided values up to the current bar:
return(rates_total);
We implemented a complete rolling z-score engine that:
- ensures enough bars exist ( InpLookback + 1)
- calculates only what is needed using prev_calculated
- hides non-computable regions with EMPTY_VALUE
- computes log returns, rolling mean, rolling standard deviation
- writes the final Sigma Score into a single plot buffer safely (no divide-by-zero artifacts)

How to think about using Sigma Score in trading
The Sigma Score is not a complete strategy by itself. It is best used as a context and timing tool. The moment you see an extreme value you can decide whether you want to trade mean reversion or momentum.
If you are trading mean reversion, you treat extreme sigma values as “stretch moves”. For example, if the Sigma Score is below −2 the market has moved down unusually strongly relative to the last 20 bars. In a ranging market, traders often look for a stabilization pattern (for example, price stops making new lows, or you get a bullish candle pattern) and then expect some reversion back toward the recent average.
If you are trading momentum, you treat extreme sigma values as “shock continuation signals”. For example, if Sigma Score is above +2 and the market is in a clear uptrend, this may indicate a strong impulse move rather than an immediate fade. In that case, Sigma Score can be used to avoid shorting too early or to time pullback entries instead of fading strength.
In both cases, Sigma Score is also useful for risk management: An extreme sigma reading often means the market is moving fast, spreads may widen and stops may need more room. Even if you do not trade the signal the indicator can help you adapt position size and expectations.
Conclusion
We started with a common trading problem. It is hard to judge whether a price move is truly “extreme” or simply normal noise for the current market regime. By building the Sigma Score indicator step by step, you now have a simple, objective way to measure that question in one number.
We have implemented a complete MetaTrader 5 indicator that calculates log returns, computes their rolling mean and standard deviation over a configurable lookback period, and converts the latest return into a z-score (Sigma Score). As a result, you can interpret market moves in “sigma units”: Values near 0 indicate normal behavior, while readings beyond your thresholds (for example ±2) highlight unusually strong bullish or bearish impulses relative to recent conditions.
Most importantly, we also learned how to apply this output in practice. Sigma Score can be used as a market stress meter to support both mean-reversion and momentum decision-making, and as a risk-management tool to recognize when conditions are abnormal and position sizing or stop distance should be adjusted. With the full code in place, you can now confidently extend the indicator, adding alerts, trend filters, or multi-timeframe logic, while keeping the core idea the same. Quantifying how unusual the latest move is compared to recent history.
References
- Campbell, J.Y., Lo, A.W. and MacKinlay, A.C. (1997) The Econometrics of Financial Markets. Princeton, NJ: Princeton University Press. Available at: https://press.princeton.edu/books/paperback/9780691043012/the-econometrics-of-financial-markets (Accessed: 24 December 2025).
- Cont, R. (2001) ‘Empirical properties of asset returns: stylized facts and statistical issues’, Quantitative Finance, 1(2), pp. 223–236. Available at: https://www.cfm.com/wp-content/uploads/2022/12/163-1997-herd-behavior-and-aggregate-fluctuations-in-financial-market.pdf (Accessed: 24 December 2025).
- Cont, R. (2001) ‘Empirical properties of asset returns: stylized facts and statistical issues’, Quantitative Finance, 1(2), pp. 223–236. Available at: https://rama.cont.perso.math.cnrs.fr/pdf/empirical.pdf (Accessed: 24 December 2025). (Optional) Available at: https://www.tandfonline.com/doi/abs/10.1080/713665670 (Accessed: 24 December 2025).
- Fan, J. and Yao, Q. (2017) The Elements of Financial Econometrics. Cambridge: Cambridge University Press. (Excerpt: “Asset Returns”, definition of log returns). Available at: https://assets.cambridge.org/97811071/91174/excerpt/9781107191174_excerpt.pdf (Accessed: 24 December 2025).
- Hull, J.C. (2002) Options, Futures, and Other Derivatives. 5th edn. Upper Saddle River, NJ: Prentice Hall. (Chapter notes: ‘Estimating Volatility from Historical Data’—volatility estimation via standard deviation of continuously compounded returns). Available at: https://mx.nthu.edu.tw/~jtyang/Teaching/Financial_Engineering/Notes/HullOFO5ed/CH12.pdf (Accessed: 24 December 2025).
- Mandelbrot, B. (1963) ‘The Variation of Certain Speculative Prices’, The Journal of Business, 36(4), pp. 394–419. Available at: https://e-m-h.org/Mand63.pdf (Accessed: 24 December 2025).
- National Institute of Standards and Technology (NIST) (2012) ‘ISO 13528 ZSCORE (LET) — standard definition of a z-score’. NIST/SEMATECH e-Handbook / Dataplot Reference Manual. Available at: https://www.itl.nist.gov/div898/software/dataplot/refman2/auxillar/zscore.htm (Accessed: 24 December 2025).
- Zivot, E. (2014) ‘Return Calculations’ (course notes). University of Washington. (Definition of continuously compounded (log) returns). Available at: https://faculty.washington.edu/ezivot/econ424/returnCalculations.pdf (Accessed: 24 December 2025).
Warning: All rights to these materials are reserved by MetaQuotes Ltd. Copying or reprinting of these materials in whole or in part is prohibited.
This article was written by a user of the site and reflects their personal views. MetaQuotes Ltd is not responsible for the accuracy of the information presented, nor for any consequences resulting from the use of the solutions, strategies or recommendations described.

- Free trading apps
- Over 8,000 signals for copying
- Economic news for exploring financial markets
You agree to website policy and terms of use