

How to Detect and Normalize Chart Objects in MQL5 (Part 1): Building a Chart Object Detection Engine
 3 553
3 553
 0
0

Contents:
Introduction
Traders rely heavily on chart objects: trendlines to mark dynamic support/resistance, horizontal lines for key levels, rectangles for consolidation zones, and Fibonacci tools for retracement targets. These graphical elements transform raw price action into a structured visual framework that guides entry, exit, and risk management decisions. In discretionary trading, the trader's eyes constantly scan these objects, interpreting the price position relative to each line or shape.
The cost of manual monitoring
Consider a trader who draws a trendline connecting swing lows on EURUSD. Each time the price approaches that line, the trader watches for a bounce or a breakout. Similarly, a horizontal resistance line requires constant attention: a touch that rejects the price may signal a short, while a decisive close above could trigger a breakout. A rectangle defines a range; the price behavior at its upper or lower boundary often decides the next move. In manual trading, missing a fast reversal or a sudden spike because of distraction, fatigue, or simply looking away means lost opportunities or unexpected losses. Many traders have experienced a perfect trendline touch that turned into a 50‑pip rally – but they entered too late because they were not alerted automatically. Automated detection of these objects would instantly notify the trader or even execute trades based on pre‑defined rules. Without a systematic way to harvest object data programmatically, every such opportunity must be watched by eye, which is neither scalable nor reliable.
The challenge of scale
The problem intensifies when a trader monitors multiple symbols or timeframes. A single chart may contain dozens of analytical objects – trendlines from different swings, horizontal levels from past support/resistance, rectangles marking consolidation phases. Scanning all of them manually while reacting to live price movement is humanly impossible. An algorithmic approach that systematically collects every object’s coordinates and properties solves this scalability issue, turning a chaotic visual field into a structured dataset ready for automated analysis.
Expert Advisors (EAs) and scripts, however, are blind to this visual layer. By default, MQL5 provides functions to read object properties, but there is no built‑in mechanism to systematically collect, filter, and normalize all analytical objects on a chart. This creates an interpretative gap: a trader sees a clear trendline breakout, while the EA sees only candlesticks. Bridging this gap requires an engineered detection framework that converts graphical overlays into a machine‑readable data stream.
This article presents a systematic MQL5 approach for detecting chart objects, identifying them, and extracting their properties automatically. We will build a reusable detection engine. It iterates over all chart objects, keeps only analytical types (trendlines, rectangles, channels, horizontal/vertical lines, Fibonacci tools, etc.), and returns normalized time/price coordinates. The goal is to turn subjective visual analysis into consistent, rule‑based inputs for algorithmic trading systems.
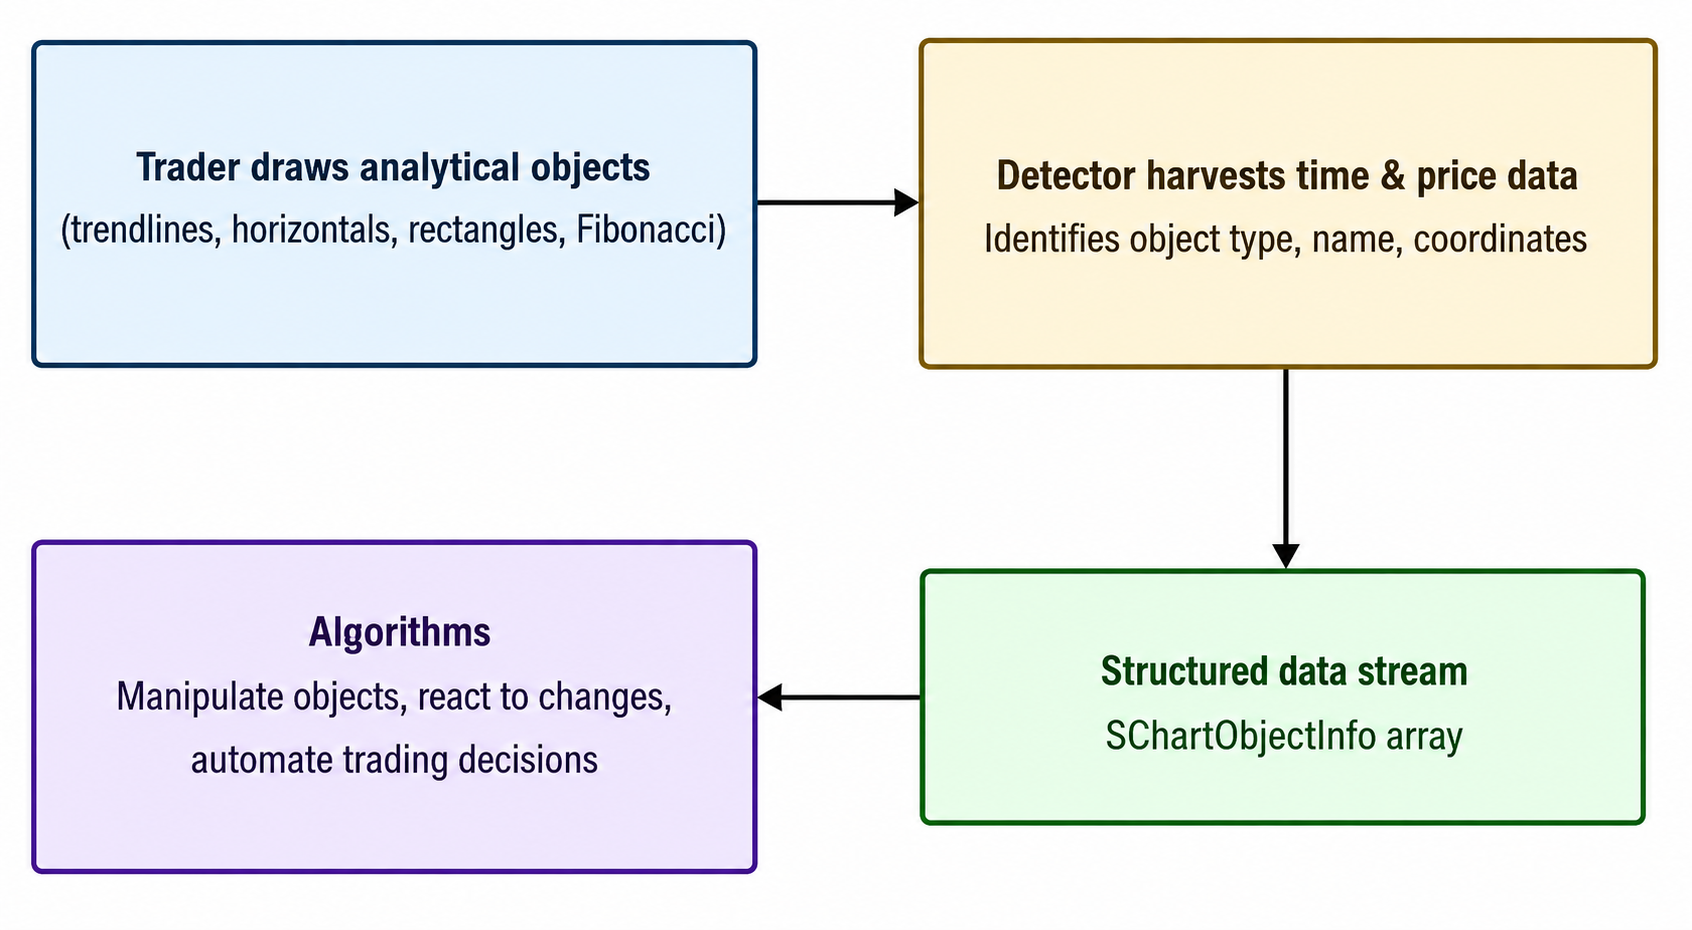
Fig. 1. Conceptual pipeline of analytical object processing.
From trader‑drawn objects, the detection algorithm harvests time, price, and identification data, producing a structured stream (SChartObjectInfo array) that enables subsequent algorithms for manipulation, event reaction, and automated trading decisions.
By the end of this article, you will have two ready‑to‑use files: ChartObjectDetector.mqh (a class encapsulating the detection logic) and ObjectDetectionTestEA.mq5 (a test Expert Advisor that logs all detected objects every few seconds). You can include the detector in any EA to access all drawn analytical objects as structured data, enabling automated strategies that react to trendlines, support/resistance levels, and Fibonacci zones.
Implementation
MQL5 object model overview (CChartObject, raw functions)
MQL5 provides two APIs for chart objects: a raw functional interface (ObjectGetInteger, ObjectGetDouble, ObjectGetString, ObjectsTotal, ObjectName) and the CChartObject class hierarchy. For a detection engine, the raw functions offer several advantages: they work without instantiating wrapper objects, they allow direct indexed access to multi‑point properties (e.g., OBJPROP_TIME with index 0 and 1), and they impose no overhead from virtual methods. We will use the raw approach to build a lightweight, dependency‑free detector that can be included in any EA or script without pulling in the entire CChartObject library. The core functions are:
- ObjectsTotal() – returns the total number of objects on a chart, optionally filtered by sub‑window. We pass the chart ID and use the default parameters to count objects in all windows.
- ObjectName() – retrieves the name of an object by its zero‑based index. This is the primary way to iterate over all objects without knowing their names in advance.
- ObjectGetInteger() / ObjectGetDouble() – read integer and double properties. The indexed overload (with a fourth parameter) is critical for objects that have multiple points, such as trendlines (two anchor points) or Fibonacci tools (two anchors plus level arrays).
Below is the basic iteration pattern that forms the skeleton of our detector. Note the use of OBJPROP_TYPE to distinguish between different kinds of analytical objects.
// Basic iteration over all chart objects
int total = ObjectsTotal(chart_id);
for(int i = 0; i < total; i++)
  {
   string name = ObjectName(chart_id, i);
   int obj_type = (int)ObjectGetInteger(chart_id, name, OBJPROP_TYPE);
   // ... extract further properties
  }
Design of the detection framework (filtering, iteration, extraction)
The detection framework follows a three‑stage pipeline: filter (keep only analytical object types), extract (read time and the price coordinates using type‑specific logic), and store (normalize into a uniform structure). This normalization is crucial because it allows a single consumer – an EA or script – to handle all object types identically, without writing separate logic for trendlines, horizontals, rectangles, or Fibonacci tools. We encapsulate this pipeline inside a class CChartObjectDetector with a single public method Detect() that populates an array of SChartObjectInfo. The class maintains a private member m_chart_id to target a specific chart (0 means the current chart). The Init() method sets this identifier, defaulting to ChartID() if no argument is passed. This design allows the same detector instance to be reused across multiple charts or timeframes without recompilation. Below is the class declaration and the Init() method, each with its required decorative header.
//+------------------------------------------------------------------+
//| Chart Object Detection Class                                     |
//+------------------------------------------------------------------+
class CChartObjectDetector
  {
private:
   long               m_chart_id;
   void               ExtractProperties(string name, int type, SChartObjectInfo &obj);
   bool               IsAnalyticalObject(int type);

public:
//+------------------------------------------------------------------+
//| Initializes the detector with a chart ID (0 = current chart)     |
//+------------------------------------------------------------------+
   void               Init(long chart_id = 0)
                       {
                        //--- If chart_id is 0, use the current chart's ID; otherwise use the provided ID.
                        m_chart_id = (chart_id == 0) ? ChartID() : chart_id;
                       }
//+------------------------------------------------------------------+
//| Detects all analytical objects and returns them in an array      |
//+------------------------------------------------------------------+
   int                Detect(SChartObjectInfo &out_objects[]);
  };
Building a reusable object descriptor (SChartObjectInfo)
A trendline has two anchor points (time1, price1) and (time2, price2). A horizontal line has only a price. A vertical line has only a time. A Fibonacci retracement has two anchor points (often set to zero) plus an array of retracement levels. To avoid forcing the calling EA to write conditional logic for each object type, we define a uniform structure SChartObjectInfo that always contains time1, price1, time2, price2. For objects that lack a second point, we set the unused fields to zero. Additionally, we store the object’s name (string), its numeric type (ENUM_OBJECT), and a trader‑readable type name via a conversion function ObjectTypeToString(). This structure is the contract between the detector and any consumer EA – it normalizes disparate object geometries into a consistent data format. The structure definition and conversion function are shown below with their required headers.
//+------------------------------------------------------------------+
//| Structure to hold normalized object data                         |
//+------------------------------------------------------------------+
struct SChartObjectInfo
  {
   string            name;
   int               type;
   string            type_name;
   datetime          time1;
   datetime          time2;
   double            price1;
   double            price2;
  };

//+------------------------------------------------------------------+
//| Converts MQL5 object type constant to a readable string          |
//+------------------------------------------------------------------+
string ObjectTypeToString(int type)
  {
   switch(type)
     {
      case OBJ_TREND:     return("TREND");
      case OBJ_RECTANGLE: return("RECTANGLE");
      case OBJ_CHANNEL:   return("CHANNEL");
      case OBJ_HLINE:     return("HLINE");
      case OBJ_VLINE:     return("VLINE");
      case OBJ_FIBO:      return("FIBO");
      default:          return("UNKNOWN");
     }
  }
Handling different object types: trendlines, horizontals, rectangles, Fibonacci
The extraction logic is the most critical part of the detector. We implement it inside a private method ExtractProperties() that takes the object name, its type, and a reference to an SChartObjectInfo structure. The method uses a switch statement on the ENUM_OBJECT value. Trendlines, channels, and rectangles use two anchor points. We read them via ObjectGetInteger(..., OBJPROP_TIME, index) and ObjectGetDouble(..., OBJPROP_PRICE, index) for indices 0 and 1. This indexed access is essential because the older property names like OBJPROP_TIME1 do not exist in MQL5 and cause compilation errors.
For horizontal lines, we read only OBJPROP_PRICE at index 0. For vertical lines, only OBJPROP_TIME at index 0. For Fibonacci objects, we also read the two anchor points (even though they are often zero) to remain consistent; the actual retracement levels will be extracted in Part 2 using OBJPROP_FIRSTLEVEL and OBJPROP_LEVELVALUE. The method explicitly zeroes out all coordinate fields before populating them, ensuring no stale data remains from previous calls. The complete class definition with all methods follows.
//+------------------------------------------------------------------+
//|                                          ChartObjectDetector.mqh |
//|                                Copyright 2026, Clemence Benjamin |
//|                                             https://www.mql5.com |
//+------------------------------------------------------------------+
#property copyright "Copyright 2026, Clemence Benjamin"
#property link      "https://www.mql5.com"

//+------------------------------------------------------------------+
//| Chart Object Detection Class                                     |
//+------------------------------------------------------------------+
class CChartObjectDetector
  {
private:
   long              m_chart_id;

public:
//+------------------------------------------------------------------+
//| Initializes the detector with a chart ID                         |
//+------------------------------------------------------------------+
   void              Init(long chart_id = 0)
     {
      m_chart_id = chart_id;
     }

//+------------------------------------------------------------------+
//| Returns the total number of objects on the chart                 |
//+------------------------------------------------------------------+
   int               Total()
     {
      return(ObjectsTotal(m_chart_id));
     }

//+------------------------------------------------------------------+
//| Detects all analytical chart objects and returns them in an array|
//+------------------------------------------------------------------+
   int               Detect(SChartObjectInfo &out_objects[])
     {
      int total = ObjectsTotal(m_chart_id);
      ArrayResize(out_objects, total);
      int count = 0;

      for(int i = 0; i < total; i++)
        {
         string name = ObjectName(m_chart_id, i);
         if(name == "") continue;
         //--- Safety: ensure object still exists
         if(ObjectFind(m_chart_id, name) < 0) continue;
         int type = (int)ObjectGetInteger(m_chart_id, name, OBJPROP_TYPE);
         if(!IsAnalyticalObject(type)) continue;

         SChartObjectInfo obj;
         obj.name = name;
         obj.type = type;
         obj.type_name = ObjectTypeToString(type);
         obj.time1 = obj.time2 = 0;
         obj.price1 = obj.price2 = 0.0;
         ExtractProperties(name, type, obj);
         out_objects[count++] = obj;
        }
      ArrayResize(out_objects, count);
      return(count);
     }

private:
//+------------------------------------------------------------------+
//| Extracts time/price properties based on object type              |
//+------------------------------------------------------------------+
   void              ExtractProperties(string name, int type, SChartObjectInfo &obj)
     {
      obj.time1 = obj.time2 = 0;
      obj.price1 = obj.price2 = 0.0;

      switch(type)
        {
         case OBJ_TREND:
         case OBJ_CHANNEL:
         case OBJ_RECTANGLE:
           {
            obj.time1  = (datetime)ObjectGetInteger(m_chart_id, name, OBJPROP_TIME, 0);
            obj.price1 = ObjectGetDouble(m_chart_id, name, OBJPROP_PRICE, 0);
            obj.time2  = (datetime)ObjectGetInteger(m_chart_id, name, OBJPROP_TIME, 1);
            obj.price2 = ObjectGetDouble(m_chart_id, name, OBJPROP_PRICE, 1);
            break;
           }
         case OBJ_HLINE:
           {
            obj.price1 = ObjectGetDouble(m_chart_id, name, OBJPROP_PRICE, 0);
            break;
           }
         case OBJ_VLINE:
           {
            obj.time1 = (datetime)ObjectGetInteger(m_chart_id, name, OBJPROP_TIME, 0);
            break;
           }
         //--- Fibonacci objects: anchor points may be zero; levels in Part 2
         case OBJ_FIBO:
         case OBJ_FIBOTIMES:
         case OBJ_FIBOFAN:
         case OBJ_FIBOARC:
           {
            obj.time1  = (datetime)ObjectGetInteger(m_chart_id, name, OBJPROP_TIME, 0);
            obj.price1 = ObjectGetDouble(m_chart_id, name, OBJPROP_PRICE, 0);
            obj.time2  = (datetime)ObjectGetInteger(m_chart_id, name, OBJPROP_TIME, 1);
            obj.price2 = ObjectGetDouble(m_chart_id, name, OBJPROP_PRICE, 1);
            break;
           }
         default:
           break;
        }
     }

//+------------------------------------------------------------------+
//| Filters only analytical object types (trendline, rectangle, etc.)|
//+------------------------------------------------------------------+
   bool              IsAnalyticalObject(int type)
     {
      return(type == OBJ_TREND  || type == OBJ_RECTANGLE ||
               type == OBJ_CHANNEL || type == OBJ_HLINE   ||
               type == OBJ_VLINE   || type == OBJ_FIBO);
     }
  };
//+------------------------------------------------------------------+
Test Expert Advisor: integration and periodic detection
The test EA (ObjectDetectionTestEA.mq5) demonstrates how to use the detector in a live trading environment. We break it down into four logical parts, each with its own decorative function header as required by the MQL5 style guide. The EA uses a static timestamp to throttle detection to once every 5 seconds – this prevents log flooding while still providing near‑real‑time updates. The detector.Detect() call populates the objects array, and PrintFormat() outputs each object’s name, type, and the price coordinates. Note that the EA does not perform any trading actions; its sole purpose is to verify that the detector correctly identifies and extracts properties from manually drawn objects.
Step 1 – Include and global instances
The EA includes the detector header and declares two global variables: an instance of CChartObjectDetector and a dynamic array of SChartObjectInfo. The array will be resized automatically by the Detect() method.
//+------------------------------------------------------------------+
//|                                             ObjectDetectionTestEA.mq5 |
//|                                Copyright 2026, Clemence Benjamin |
//|                                             https://www.mql5.com |
//+------------------------------------------------------------------+
#property copyright "Copyright 2026, Clemence Benjamin"
#property link      "https://www.mql5.com"
#property version   "1.00"

#property strict

#include <ChartObjectsAlgorithms/ChartObjectDetector.mqh>

CChartObjectDetector detector;
SChartObjectInfo objects[];
Step 2 – OnInit: initialize the detector
The OnInit() function calls detector.Init(0) to attach the detector to the current chart. It prints a confirmation message and returns INIT_SUCCEEDED. No further initialization is required – the detector is ready to use immediately.
//+------------------------------------------------------------------+
//| Expert initialization function                                   |
//+------------------------------------------------------------------+
int OnInit()
  {
   detector.Init(0); // current chart
   Print("Object Detection EA Initialized");
   return(INIT_SUCCEEDED);
  }
Step 3 – OnDeinit: clean up (optional)
The OnDeinit() function is called when the EA is removed from the chart. In this simple test EA, no specific cleanup is required, but the function is included to follow the standard EA template.
//+------------------------------------------------------------------+
//| Expert deinitialization function                                 |
//+------------------------------------------------------------------+
void OnDeinit(const int reason)
  {
   //--- No resources to free
  }
Step 4 – OnTick: throttled detection
OnTick() is called on every price tick. To avoid writing hundreds of log lines per second, we use a static datetime variable last_run that remembers the last time detection was performed. If less than 5 seconds have elapsed, the function returns immediately. Otherwise, we update last_run and proceed to the detection logic. This pattern is lightweight and effective for demonstration purposes; production systems may use OnTimer() for even lower overhead.
//+------------------------------------------------------------------+
//| Expert tick function                                             |
//+------------------------------------------------------------------+
void OnTick()
  {
   static datetime last_run = 0;

   //--- Run every 5 seconds (avoid spam)
   if(TimeCurrent() - last_run < 5)
      return();

   last_run = TimeCurrent();
Step 5 – Perform detection and print results
We call detector.Detect(objects), which fills the objects array and returns the number of detected analytical objects. The EA then prints a header line and iterates through the array, using PrintFormat() to output each object’s name, type, and the price coordinates. For horizontal lines, only Price1 is meaningful. For vertical lines, the logged Price1 remains zero because the test EA prints only price1 and price2; to see the time coordinate, modify the PrintFormat call to include time1. In a production EA, you would replace this print loop with your own trading logic – for example, checking if the price has crossed a detected trendline.
   int total = detector.Detect(objects);

   Print("------ DETECTED OBJECTS: ", total, " ------");

   for(int i = 0; i < total; i++)
     {
      PrintFormat("Name: %s | Type: %s | Price1: %.5f | Price2: %.5f",
                  objects[i].name,
                  objects[i].type_name,
                  objects[i].price1,
                  objects[i].price2);
     }
  }
//+------------------------------------------------------------------+
Complete test EA code
For reference, the full test EA is reproduced below without interruption, adhering to all styling rules.
//+------------------------------------------------------------------+
//|                                             ObjectDetectionTestEA.mq5 |
//|                                Copyright 2026, Clemence Benjamin |
//|                                             https://www.mql5.com |
//+------------------------------------------------------------------+
#property copyright "Copyright 2026, Clemence Benjamin"
#property link      "https://www.mql5.com"
#property version   "1.00"

#property strict

#include <ChartObjectsAlgorithms/ChartObjectDetector.mqh>

CChartObjectDetector detector;
SChartObjectInfo objects[];

//+------------------------------------------------------------------+
//| Expert initialization function                                   |
//+------------------------------------------------------------------+
int OnInit()
  {
   detector.Init(0); // current chart
   Print("Object Detection EA Initialized");
   return(INIT_SUCCEEDED);
  }

//+------------------------------------------------------------------+
//| Expert deinitialization function                                 |
//+------------------------------------------------------------------+
void OnDeinit(const int reason)
  {
   //--- No resources to free
  }

//+------------------------------------------------------------------+
//| Expert tick function                                             |
//+------------------------------------------------------------------+
void OnTick()
  {
   static datetime last_run = 0;

   //--- Run every 5 seconds (avoid spam)
   if(TimeCurrent() - last_run < 5)
      return();

   last_run = TimeCurrent();

   int total = detector.Detect(objects);

   Print("------ DETECTED OBJECTS: ", total, " ------");

   for(int i = 0; i < total; i++)
     {
      PrintFormat("Name: %s | Type: %s | Price1: %.5f | Price2: %.5f",
                  objects[i].name,
                  objects[i].type_name,
                  objects[i].price1,
                  objects[i].price2);
     }
  }
//+------------------------------------------------------------------+
The detector is now ready for integration into larger trading systems. Note that complex objects like Fibonacci objects will show price1 = price2 = 0 in this version – that is expected because Fibonacci tools store their meaningful data in level arrays. Part 2 of this series will extend the detector to extract Fibonacci levels and handle object events (creation, deletion, modification).
Testing
Test environment setup (any chart, any timeframe)
To test the detector, create a new EA in MetaEditor, name it ObjectDetectionTestEA.mq5, and paste the test EA code exactly as shown. Ensure that the include file ChartObjectDetector.mqh is placed inside MQL5/Include/ChartObjectsAlgorithms/ (create the folder if necessary). Compile both files (F7). No compilation errors should appear. Attach the EA to any chart – for example, EURUSD on M15 – and manually draw a few analytical objects: a trendline, a horizontal line, a rectangle, and optionally a Fibonacci retracement.
Detecting objects in real time (timer‑based polling)
The test EA uses the OnTick() function with a static timestamp to run detection every 5 seconds. This polling method is simple and effective for demonstration. In production, you might use OnTimer() or react to chart events (OnChartEvent) for better efficiency. When you run the EA, the Experts tab will log the number of detected objects and their properties each cycle. Because detection runs on every tick but is throttled to 5 seconds, the CPU load is minimal.
Demonstration of object placement and real‑time detection
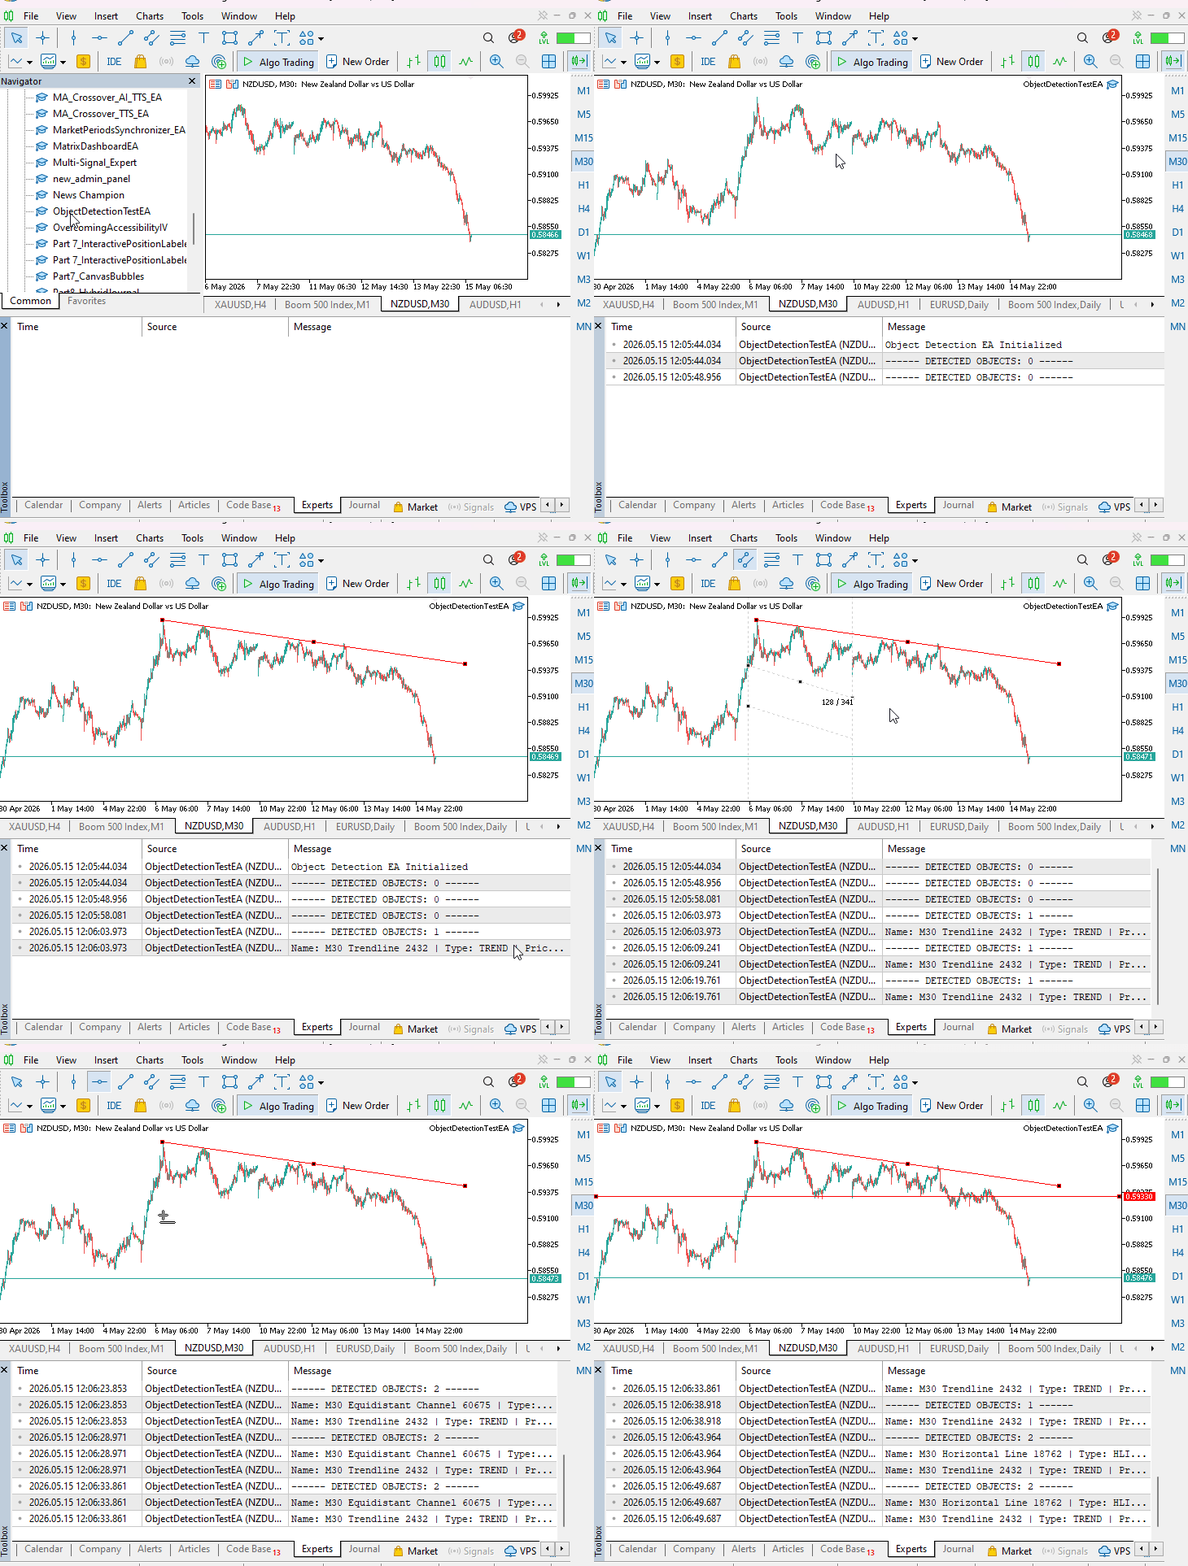
Fig. 2: A GIF demonstrating the insertion of a trendline, a horizontal line, and the EA logging them every 5 seconds.
Validation of extracted properties (prices, times, Fibonacci levels)
For trendlines and rectangles, the logged Price1 and Price2 should match the exact prices you set when drawing. For horizontal lines, only Price1 is shown (the line’s level). For vertical lines, both prices appear as zero because the test EA prints only price1 and price2; to see the time coordinate, modify the PrintFormat call to include time1. Fibonacci objects will show zero for both prices because their main anchor points are often not set; in a production version you would extract the level values using OBJPROP_FIRSTLEVEL and OBJPROP_LEVELVALUE – this will be covered in Part 2. The current behavior is not a bug; it accurately reflects that some analytical tools are not defined by two price points alone.
Why this matters for your trading
Once the detector is running, you no longer need to watch every trendline touch or horizontal level break manually. The EA logs every object’s coordinates in real time, which you can extend to trigger sound alerts, send notifications, or even execute trades automatically. For example, you could program a rule: “if price closes above a detected trendline, buy 0.1 lots.” The same logic applies to rectangles (breakout above upper bound) and horizontal lines (rejection bounce). By automating object monitoring, you free yourself from the screen and reduce reaction time from seconds to milliseconds.
Logging output and verifying against manually drawn objects
Run the EA and watch the output. You should see lines similar to the log below in the Experts tab of the Toolbox.
Test log output – example from NZDUSD M30
2026.05.15 12:07:10.961 ObjectDetectionTestEA (NZDUSD,M30) ------ DETECTED OBJECTS: 2 ------
2026.05.15 12:07:10.961 ObjectDetectionTestEA (NZDUSD,M30) Name: M30 Horizontal Line 18762 | Type: HLINE | Price1: 0.59330 | Price2: 0.00000
2026.05.15 12:07:10.961 ObjectDetectionTestEA (NZDUSD,M30) Name: M30 Trendline 2432 | Type: TREND | Price1: 0.59901 | Price2: 0.59441
2026.05.15 12:07:16.366 ObjectDetectionTestEA (NZDUSD,M30) ------ DETECTED OBJECTS: 2 ------
2026.05.15 12:07:16.366 ObjectDetectionTestEA (NZDUSD,M30) Name: M30 Horizontal Line 18762 | Type: HLINE | Price1: 0.59330 | Price2: 0.00000
2026.05.15 12:07:16.366 ObjectDetectionTestEA (NZDUSD,M30) Name: M30 Trendline 2432 | Type: TREND | Price1: 0.59901 | Price2: 0.59441
2026.05.15 12:07:20.979 ObjectDetectionTestEA (NZDUSD,M30) ------ DETECTED OBJECTS: 2 ------
2026.05.15 12:07:20.979 ObjectDetectionTestEA (NZDUSD,M30) Name: M30 Horizontal Line 18762 | Type: HLINE | Price1: 0.59330 | Price2: 0.00000
2026.05.15 12:07:20.979 ObjectDetectionTestEA (NZDUSD,M30) Name: M30 Trendline 2432 | Type: TREND | Price1: 0.59901 | Price2: 0.59441
Verify that the logged prices match the objects you drew. If an object is missing, ensure it is of a supported type (trendline, rectangle, channel, horizontal, vertical, or Fibonacci). The detector currently ignores text labels, buttons, and other non‑analytical objects. If the log shows “UNKNOWN” for an object you expected, add its type constant to IsAnalyticalObject() and ObjectTypeToString().
Conclusion
We have engineered a systematic MQL5 framework that detects, identifies, and extracts properties from chart objects. The CChartObjectDetector class transforms the subjective visual layer into a structured data stream – an array of SChartObjectInfo objects containing names, types, and time‑price coordinates. This bridges the interpretative gap between discretionary chart analysis and algorithmic execution.
With this detector, an EA can now detect chart objects. Possible applications include: automated breakout strategies based on trendline breaches, support/resistance zone identification from horizontal lines and rectangles, and dynamic stop‑loss placement using channel boundaries. The structured output also enables logging, backtesting of manual setups, and integration with machine learning models.
Detection is only the first step. The current version does not react to object changes (moving a trendline, adding a new Fibonacci level) unless you re‑run the detection. It also does not allow modification of objects from code. In Part 2, we will extend the framework to monitor object events via OnChartEvent() (CHARTEVENT_OBJECT_CREATE/DELETE/CLICK). We will also add Fibonacci level extraction and demonstrate two‑way interaction: creating, modifying, and deleting objects from the EA.
Attachments
ChartObjectDetector.mqh – detection engine (include file). This file contains the complete CChartObjectDetector class and the SChartObjectInfo structure. Copy it to MQL5/Include/ChartObjectsAlgorithms/ChartObjectDetector.mqh.
ObjectDetectionTestEA.mq5 – ready‑to‑run test Expert Advisor. This EA demonstrates how to use the detector. It runs every 5 seconds and prints detected objects to the Experts log. Copy it to MQL5/Experts/ObjectDetectionTestEA.mq5.
Installation instructions:
1. Create the folder MQL5/Include/ChartObjectsAlgorithms/ if it does not exist.
2. Save ChartObjectDetector.mqh inside that folder.
3. Save ObjectDetectionTestEA.mq5 inside MQL5/Experts/.
4. Compile both files (F7 in MetaEditor).
5. Attach the EA to any chart and draw at least one trendline, horizontal line, or rectangle.
6. Observe the output in the Experts tab (View → Strategy Tester / Experts).
| File Name | Type | Version | Description |
|---|---|---|---|
| ChartObjectDetector.mqh | Include file | Detection engine with CChartObjectDetector class and SChartObjectInfo structure | |
| ObjectDetectionTestEA.mq5 | Expert Advisor | 1.00 | Test EA that polls and logs all detected analytical objects every 5 seconds |
This project is supported in Algo Forge.
Warning: All rights to these materials are reserved by MetaQuotes Ltd. Copying or reprinting of these materials in whole or in part is prohibited.
This article was written by a user of the site and reflects their personal views. MetaQuotes Ltd is not responsible for the accuracy of the information presented, nor for any consequences resulting from the use of the solutions, strategies or recommendations described.

 Building the Market Structure Sentinel Indicator in MQL5
 Building a Megaphone Pattern Indicator in MQL5
 News Filtering with MetaTrader 5 Economic Calendar and CSV Fallback
 Market Microstructure in MQL5 (Part 3): Estimating ARFIMA d with GPH

- Free trading apps
- Over 8,000 signals for copying
- Economic news for exploring financial markets
You agree to website policy and terms of use